 Duplex
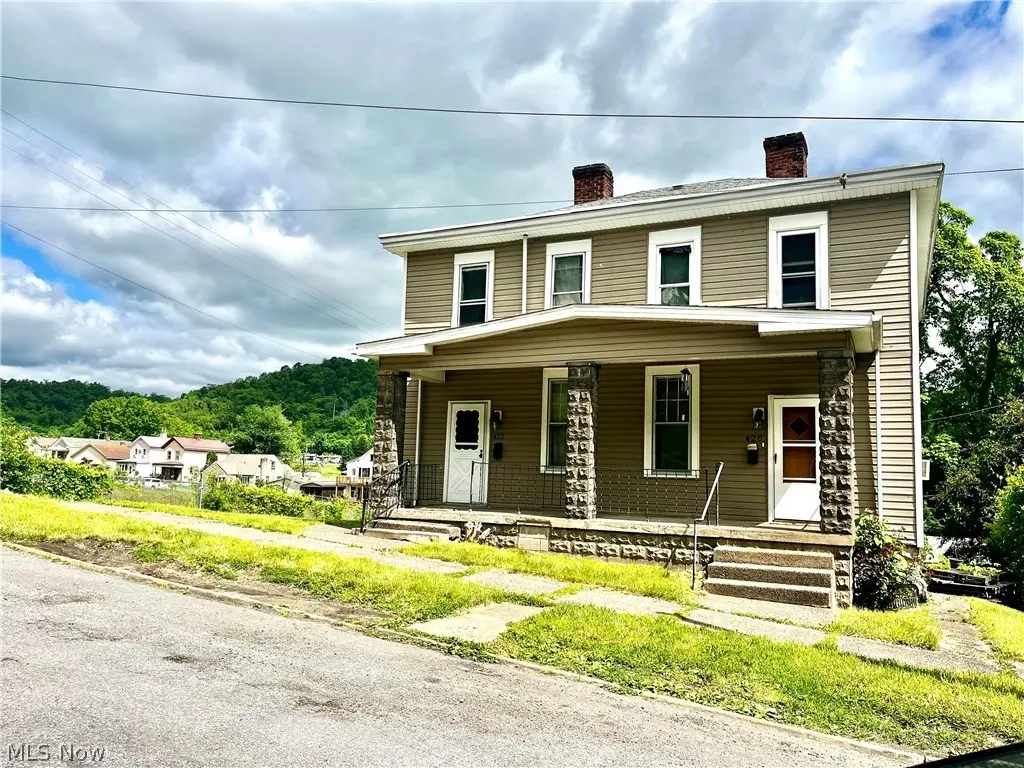
422 Whitely St · Bridgeport, OH
Flood risk 3/10 · Minor
- FEMA flood zone
- X (unshaded)
- Chance of flooding over 30 yrs
- 0.09%
- Est. flood insurance / yr
- $473 – $860
Fire risk 1/10 · Minimal
- Est. fire insurance / yr
- $713 – $1,323
Heat risk 3/10 · Minor
- Hot days now (above 98°F)
- 7 days/yr
- Hot days in 30 yrs
- 19 days/yr
Wind risk 1/10 · Minimal
- Chance of severe wind over 30 yrs
- —
Air-quality risk 2/10 · Minimal
- Unhealthy air days now
- 1 days/yr
- Unhealthy air days in 30 yrs
- 2 days/yr
Risk factors via First Street. Map © Google.
Why this score? — see what drove the D grade
The composite is a weighted blend of 9 inputs, each scored 0–100. Each bar is that input's sub-score; the figure is the points it added to the 100-point composite (weight × sub-score).
- Cash flow +15.0/30.0
- Appreciation +6.4/10.0
- 1% rule +5.0/10.0
- DSCR +5.0/10.0
- Schools +4.4/10.0
- Livability +3.8/5.0
- Rent growth +2.5/5.0
- Condition / age +2.5/5.0
- ARV discount +0.0/15.0
$125,000
🖨 Deal sheet 📄 Offer letter ✓ Due diligence
Multi-family units
County records classify this as Multi-Family (2-4 Unit). Listing-text estimate: 2 units. confirmed
Listing remarks MLS
Side-by-side duplex for sale in Bridgeport! Conveniently located just minutes from Interstate 70, this income-producing property offers easy access to shopping, dining, and everyday essentials. This well-positioned duplex features: One 3-bedroom unit with a long-term tenant already in place One 1-bedroom unit offering additional rental flexibility Tenants pay all utilities $1,600 per month in total rental income Recent plumbing updates already completed Whether you’re looking to expand your portfolio or secure a steady cash-flowing investment, this property checks the boxes. Opportunities like this don’t last long—schedule your showing and come see the potential for yourself!
Key facts
- 5,662 sq ft lot
- Garage
- Built 1900
Neighborhood map
What this means for you Summary
Snapshot
- This is a 1×3bd/1.0ba + 1×1bd/1.0ba units multifamily listed at $125k.
Deal economics
- At list price, monthly cash flow is $5k ($60k/yr) — positive. Per door: $2k/mo.
- The deal already cash-flows at list — no discount required.
- Meets the 1% rule at list price ($8k rent vs $125k).
- Recommended offer: $114k (9.0% below list) — sets the bar for market timing.
Location & tenants
- Location reads 75/100 on livability (#239 in OH, #3,844 nationally) — a middle-class / working-renter tenant base. Strengths: crime A+, cost of living A+, housing A+; Watch: employment D+, amenities F, commute F.
- Bridgeport Exempted Village (suburban): math 49% / reading 57% proficiency, ranked #429 of 656 in OH (top 65%) — acceptable for families but not a draw, mixed tenant base, ~2y average lease.
- Market conditions: 40 active listings in the ZIP; 4 units permitted in Belmont County in 2024 (0 in 5+ unit buildings).
- At $7,540/mo this rent would consume 175% of the median local household income ($52k/yr) — very limited rent-growth headroom before tenants either downsize or default.
Forward outlook
- In year one you build about $4k of equity ($864 loan paydown + $3k appreciation (2.7% local appreciation)).
- Belmont County population projected at -15% by 2050 — secular population decline; favor cash flow + early exit over multi-decade hold.
- At projected returns (2.7% appreciation + 3.0% rent growth), your $35k cash investment doubles in ~1 year — after that, you're playing with house money.
- By year 8, paydown + projected appreciation supports a ~$32k cash-out refi (75% LTV) — recoverable capital for the next deal without selling this one.
Negotiation context
- It's been on market 116 days — a 9% lower offer ($114k) is reasonable based on typical stale-listing flexibility.
- 2 sale attempts with the ask held roughly flat each time — persistent listings suggest the price (not the market) is what's stuck; bring a comps-based counter.
- Current owner paid $80k; list at $125k implies a 56% gain — meaningful room to come down on a strong offer.
Risks & watch-outs
- Watch-outs: property tax is 2.6% of price; built in 1900 — expect roof / HVAC / electrical / plumbing capex.
Questions for the listing agent
- It's been on market 116 days. Have you received any prior offers? Is the seller open to a 9% concession, seller financing, or rate buy-down credit?
- Can we see the unit-by-unit rent roll, current vacancy, and any below-market leases? What's the average tenancy length?
- What capital expenditures (roof, boiler, parking lot, exteriors) have been made in the last 5 years, and what's planned in the next 2?
- Built in 1900 — when were the roof, HVAC, electrical panel, plumbing, and water heater last replaced?
- Property tax is high relative to price — has the assessment been appealed recently, and will the sale trigger a re-assessment?
- Why hasn't it sold? Are there any deal-killer items the seller is aware of (foundation, flood, title, zoning, code violations)?
- Is there a deadline driving the sale (1031 exchange, divorce, estate, relocation)? That informs how much negotiation room exists.
- The area grade is low — what's the realistic commute time and amenity access for the typical tenant pool here? Any planned neighborhood developments (good or bad) we should know about?
- What's the average days-on-market for RENTAL listings here right now (not sales)? A rising rental-DOM trend means longer vacancies and softer asking-rent achievability than the comps imply.
- What's the recent tenant-quality profile in this submarket — average credit score on applications, eviction rate, late-payment / NSF rate, and stable-employment percentage? A property-management company in the area should have these aggregated.
- How much new apartment / multifamily construction is in the pipeline within 1–3 miles? Heavy new supply (>2% of stock underway) typically softens rents 12–24 months out; light construction supports rent growth.
Investment metrics
- 1% rule
- 6.03% ✓
- Cap rate
- 54.12%
- Cash-on-cash
- 170.80%
- DSCR
- 8.60
- GRM
- 1.4
CMA / ARV
- ARV (median comp)
- $90,000
- List price
- $125,000
- Delta
- 38.89%
- Verdict
- OVERPRICED
- Comps
- 19 within 1.0 mi
Show comp detail 1 sale within ~0.75 mi
| Address | Dist | Beds/Ba | Sqft | Sold | Price | $/sf | Match |
|---|---|---|---|---|---|---|---|
| 401 S Huron St | 0.58mi | 5/3.0 (-1) | 2,262 (-4%) | 24mo | $60,000 | $27 | 37 |
Match score weights: distance 35% · size 25% · config 20% · recency 20%. Top-matched comps best support the ARV.
Projected returns pro-forma
2.71% appreciation · 3.0% rent growth · sell at horizon
- IRR
- —
- Equity multiple
- 10.45×
- Total profit
- $330,639
- Equity at exit
- $54,205
- IRR
- —
- Equity multiple
- 22.00×
- Total profit
- $735,022
- Equity at exit
- $82,013
Cash invested: $35,000 (down + closing). Projections, not guarantees.
Landlord ↔ Tenant lean methodology
- Overall (STATE)
- 73 Landlord-Friendly
- State Ohio
- 73 Landlord-Friendly · R+6
- County
- — inherits STATE
- City
- — inherits STATE
ZIP-level market 43912
- Home prices YoY
- 1.7%
- Active inventory
- 40
- Price-to-rent
- 1.6×
Monthly cashflow live
- Estimated rent
- $7,540 medium interval (Pro) →
- Mortgage (P&I)
- −$656
- Tax from tax record
- −$267 /mo · $3,209/yr
- Insurance
- −$52
- HOA
- −$0
- Vacancy / Maint / Mgmt
- −$1,583
- Net cashflow
- $4,982
Break-even live
2-unit breakdown (identical units grouped — click to expand)
| Units | Beds | Baths | Est. rent |
|---|---|---|---|
| 1× unit | 3 | 1 | $6,325 |
| 1× unit | 1 | 1 | $1,215 |
| Total (2 units) | $7,540 | ||
UW: 25.0% down · 7.5% · 30yr · 1.5% tax · 5.0% vac · 8.0% maint · 8.0% mgmt
Financing live
Cash to close
- Down payment
- $31,250
- Closing costs
- $3,750
- Reserves months
- —
- Total cash needed
- —
Loan-product check · same deal, 3 products live
Conventional
25% down · 7.5% · 30yr
- Down + closing
- —
- Monthly P&I
- —
- Monthly cashflow
- —
- DSCR
- —
- Eligible?
- —
Personal DTI + credit; lowest rate.
DSCR
20% down · 8.5% · 30yr
- Down + closing
- —
- Monthly P&I
- —
- Monthly cashflow
- —
- DSCR
- —
- Eligible?
- —
No personal income docs; deal must DSCR.
Hard money
10% down · 12.0% · 12mo
- Down + closing
- —
- Monthly P&I
- —
- Monthly cashflow
- —
- DSCR
- —
- Eligible?
- —
Short-term bridge; refi at stabilization.
Listing history 21 events
-
2026-06-19days on market $125,000 Active 116 DOM
-
2026-06-18days on market $125,000 Active 115 DOM
-
2026-06-17days on market $125,000 Active 114 DOM
-
2026-06-16days on market $125,000 Active 113 DOM
-
2026-06-15days on market $125,000 Active 112 DOM
-
2026-06-14days on market $125,000 Active 110 DOM
-
2026-06-12days on market $125,000 Active 109 DOM
-
2026-06-09days on market $125,000 Active 106 DOM
-
2026-06-08days on market $125,000 Active 105 DOM
-
2026-06-07days on market $125,000 Active 104 DOM
-
2026-06-03days on market $125,000 Active 100 DOM
-
2026-06-02days on market $125,000 Active 99 DOM
-
2026-06-01days on market $125,000 Active 98 DOM
-
2026-05-31days on market $125,000 Active 97 DOM
-
2026-05-30days on market $125,000 Active 96 DOM
-
2026-02-23$125,000 Active 720-char remark
Show marketing remark (720 chars)
Side-by-side duplex for sale in Bridgeport! Conveniently located just minutes from Interstate 70, this income-producing property offers easy access to shopping, dining, and everyday essentials. This well-positioned duplex features: One 3-bedroom unit with a long-term tenant already in place One 1-bedroom unit offering additional rental flexibility Tenants pay all utilities $1,600 per month in total rental income Recent plumbing updates already completed Whether you’re looking to expand your portfolio or secure a steady cash-flowing investment, this property checks the boxes. Opportunities like this don’t last long—schedule your showing and come see the potential for yourself!
-
2025-07-24soldstatus $80,000 Closed 692-char remark
Show marketing remark (692 chars)
Investor Alert! Don’t miss this income-producing duplex in Bridgeport, OH — just one block from I-70, offering unbeatable convenience for tenants and easy access for owners. One unit is currently occupied by a reliable long-term tenant generating $1,050/month. Tenant pays all utilities. The second unit was just rented on a month to month term for $600. Total monthly revenue is $1650. Cash flows from day one, making this an excellent addition to your portfolio. Utilities are separated per unit. All showings must be scheduled through the listing agent with 24-hour notice required out of respect for the current tenant. Act fast — opportunities like this don't last!
-
2025-06-06status Pending 692-char remark
Show marketing remark (692 chars)
Investor Alert! Don’t miss this income-producing duplex in Bridgeport, OH — just one block from I-70, offering unbeatable convenience for tenants and easy access for owners. One unit is currently occupied by a reliable long-term tenant generating $1,050/month. Tenant pays all utilities. The second unit was just rented on a month to month term for $600. Total monthly revenue is $1650. Cash flows from day one, making this an excellent addition to your portfolio. Utilities are separated per unit. All showings must be scheduled through the listing agent with 24-hour notice required out of respect for the current tenant. Act fast — opportunities like this don't last!
-
2025-05-23$87,500 Active 692-char remark
Show marketing remark (692 chars)
Investor Alert! Don’t miss this income-producing duplex in Bridgeport, OH — just one block from I-70, offering unbeatable convenience for tenants and easy access for owners. One unit is currently occupied by a reliable long-term tenant generating $1,050/month. Tenant pays all utilities. The second unit was just rented on a month to month term for $600. Total monthly revenue is $1650. Cash flows from day one, making this an excellent addition to your portfolio. Utilities are separated per unit. All showings must be scheduled through the listing agent with 24-hour notice required out of respect for the current tenant. Act fast — opportunities like this don't last!
-
2023-07-25soldstatus $53,333
-
2015-10-08soldstatus $48,000
ⓘ Source: listings_history table (triggers on properties + properties_extension) + one-shot
backfill from property_details.listing_events for pre-trigger history.
Tax reassessment forecast OH · Partial reset (capped growth)
- Current annual tax
- $3,209 · $267/mo
- Projected year-2 tax
- $3,209 · $267/mo
- Expected delta
- $0/yr ($0/mo · 0.0%)
ⓘ Screening estimate from a state-policy table — verify with the county assessor before closing.
Climate risk First Street
- Flood 3/10 Moderate FEMA zone X (unshaded) · 9% chance over 30 yrs
- Wildfire 1/10 Low
- Heat 3/10 Moderate 7 d/yr ≥98°F today · 19 d/yr by 30 yrs out
- Wind 1/10 Low
- Air quality 2/10 Low 1 unhealthy d/yr today · 2 by 30 yrs out
Nearby sold comps map
Loading sold comps map…
Walkable amenities ~0.75 mi
Loading nearby amenities…
Taxation est. · year 1
- Rental income
- $90,480
- − Mortgage interest
- −$7,002
- − Property taxes
- −$3,209
- − Insurance
- −$625
- − Repairs & maintenance
- −$7,238
- − Management
- −$7,238
- − Depreciation
- −$3,636
- Taxable income
- $61,531
- Est. tax owed @ 24.0%
- −$14,767
- After-tax cash flow
- $45,012/yr
For passive investors: Depreciation is non-cash, so a rental often shows a tax loss while cash-flowing — sheltering income. Rental losses are passive: they offset passive income freely, and up to $25,000/yr can offset ordinary (W-2) income if you actively participate and your MAGI is under $100k (phasing out to $0 by $150k); unused losses carry forward. On sale, claimed depreciation is recaptured at up to 25%, and gains may owe capital-gains tax (a 1031 exchange can defer both). Figures are a year-1 estimate at your 24.0% rate — not tax advice; consult a CPA.
Schools (NCES district)
- District
- Bridgeport Exempted Village
- NCES district ID
- 3904523
- Math proficiency
- 49% ▼ -16.00%
- Reading proficiency
- 57% ▼ -8.00%
- Median HH income
- $31,819
- Composite
- 43.51/100
- National rank
- #2992
- State rank
- #429 of 656 in OH
Livability — Bridgeport
- Score
- 75/100
- State rank
- #239
- US rank
- #3844
Category grades
Schools grade is shown separately in the Schools card above.
Census & demographics
- Census place
- Bridgeport, OH
- County
- Belmont · 63,139 people
- Metro
- Wheeling, WV-OH
- Population (ZIP)
- 5,852
- Household income
- $51,753
- Rent vs Own
- Severe rent burden
- 8.1
Population outlook (Belmont County) Hauer SSP2
- Today (2025)
- 66,568 people
- By 2030
- 64,818 · -2.6%
- By 2040
- 60,702 · -8.8%
- By 2050
- 56,427 · -15.2%
- By 2075
- 46,222 · -30.6%
- By 2100
- 34,611 · -48.0%
Race, ethnicity, and origin ACS 2023
- Neighborhood character
- Predominantly White (88%)
- Race & ethnicity
- White 88% Two or more races 6% Black 4% Hispanic / Latino 2%
- Common ancestry
- Romanian 8% Slovak 2% Lithuanian 2%
- Foreign-born
- 1% · Canada
- Languages at home
- 98% English-only · Spanish 1% German/W. Germanic 1%
Political lean MEDSL · Belmont
- 2024 margin
- Solid R (+47.3) · D 26.0% · R 73.3%
- 2008→2024 swing
- -50.0pp toward R · 2008: 2.7pp · 2024: -47.3pp
- All cycles
- 2024: R+47.3 2020: R+43.6 2016: R+39.5 2012: R+8.4 2008: D+2.7
Not yet ingested
- Civics
- —
Market trends
- HPI YoY
- ▲ 2.71%
- Current HPI
- 159.7811
- Rent YoY
- —
- Metro
- —
- State GDP YoY
- ▲ 1.98%
- F500 in state
- 48
Industry mix (Fortune 500 HQ in OH)
| Industry | F500 HQs | Revenue |
|---|---|---|
| Insurance | 3 | $145B |
|
||
| Industrial Machinery | 3 | $49B |
|
||
| Financial Services | 3 | $24B |
|
||
| Consumer Goods | 2 | $93B |
|
||
| Aerospace / Defense | 2 | $47B |
|
||
| Utilities | 2 | $33B |
|
||
Price history
+160.4% since first listed6 events — show timeline
- 2026-02-23 Listed $125,000 MLSNOW
- 2025-07-24 Sold (MLS) $80,000 MLSNOW
- 2025-06-06 Pending — MLSNOW
- 2025-05-23 Listed $87,500 MLSNOW
- 2023-07-25 Sold (Public Records) $53,333 Public Records
- 2015-10-08 Sold (Public Records) $48,000 Public Records
Property tax history
+20.7%/yrLatest (2025): $3,209 · +26.4% YoY. Source: county tax records.
Cash-flow waterfall
monthlySold comps — $/sqft
last 12 mo · ≤1 miLoading sold comps…