400 Liddy Dr · Brighton, MI
Flood risk 1/10 · Minimal
- FEMA flood zone
- X (unshaded)
- Chance of flooding over 30 yrs
- 0.0%
- Est. flood insurance / yr
- $473 – $860
Fire risk 2/10 · Minimal
- Est. fire insurance / yr
- $784 – $1,456
Heat risk 2/10 · Minimal
- Hot days now (above 95°F)
- 7 days/yr
- Hot days in 30 yrs
- 15 days/yr
Wind risk 2/10 · Minimal
- Chance of severe wind over 30 yrs
- —
Air-quality risk 2/10 · Minimal
- Unhealthy air days now
- 1 days/yr
- Unhealthy air days in 30 yrs
- 2 days/yr
Risk factors via First Street. Map © Google.
Why this score? — see what drove the D- grade
The composite is a weighted blend of 9 inputs, each scored 0–100. Each bar is that input's sub-score; the figure is the points it added to the 100-point composite (weight × sub-score).
- Cash flow +10.1/30.0
- ARV discount +7.5/15.0
- Schools +5.2/10.0
- Livability +3.9/5.0
- 1% rule +2.9/10.0
- DSCR +2.9/10.0
- Rent growth +2.5/5.0
- Condition / age +2.5/5.0
- Appreciation +0.0/10.0
$299,800
🖨 Deal sheet 📄 Offer letter ✓ Due diligence
Listing remarks MLS
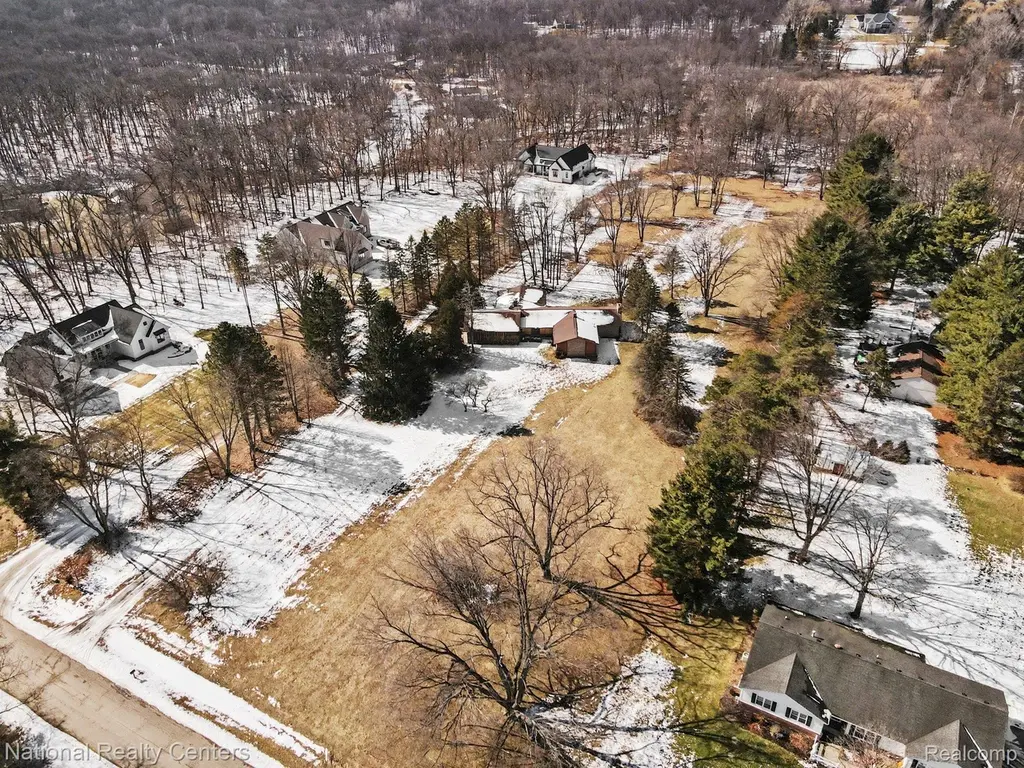
A rare estate-sized offering in the heart of Brighton Township: Positioned on nearly five wooded acres, this property delivers privacy, scale, and the opportunity to create a truly custom legacy setting. This property presents a compelling opportunity to create something truly special. Whether you envision a custom-built private estate, luxury retreat, or long-term investment hold, the land and location set the stage. The existing structure sustained fire damage and is being sold strictly as-is. The value is in the land, setting, and redevelopment potential. An established driveway and utilities already on site provide a meaningful head start for future plans. Properties offering this level of acreage, privacy, and positioning in Brighton are increasingly difficult to find. Bring your builder, your architect, and your vision. Engineered for those ready to build.
Key facts
- Privacy
- Utilities on site
- Wooded acres
Tags
Neighborhood map
What this means for you Summary
Snapshot
- This is a 4-bed/2.0-bath single-family listed at $300k.
Deal economics
- At list price, monthly cash flow is $-175 ($-2k/yr) — negative.
- To cash-flow at today's rent, offer at most $269k (10.3% below list).
- To meet the 1% rule (rent ≥ 1% of price), the offer needs to be $238k (20.6% below list).
- Recommended offer: $238k (20.6% below list) — sets the bar for 1% rule.
- Cap rate 5.6% vs local median 3.2% in Brighton — top-decile yield for the area; either an underpriced asset or a hidden risk that comps aren't pricing in. Stress-test before assuming the spread holds.
Location & tenants
- Location reads 78/100 on livability (#108 in MI, #2,621 nationally) — a middle-class / working-renter tenant base. Strengths: cost of living A+, housing A+, health & safety A+; Watch: amenities F, commute F.
- Hartland Consolidated Schools (suburban): math 52% / reading 62% proficiency, ranked #41 of 540 in MI (top 8%) — acceptable for families but not a draw, mixed tenant base, ~2y average lease; only 11% free/reduced lunch — higher-income household profile.
- Market conditions: 136 active listings in the ZIP; 488 units permitted in Livingston County in 2024 (0 in 5+ unit buildings).
Forward outlook
- Local home prices are declining (-3.0%/yr); year-one equity from $2k of loan paydown is wiped out by about $9k of value loss. Plan a longer hold.
- Livingston County population projected at +7% by 2050 — modest demand growth; plan on rents tracking national, not racing it.
Negotiation context
- It's been on market 106 days — a 9% lower offer ($273k) is reasonable based on typical stale-listing flexibility.
- 8 sale attempts since 17y ago; this cycle's ask has dropped $50k (14%) from the opening price — seller is motivated, your offer sets the floor, not the list.
Questions for the listing agent
- What do current leases actually rent for vs. the listed asking? Can we see a recent rent roll and the last 12 months of T-12 income?
- It's been on market 106 days. Have you received any prior offers? Is the seller open to a 21% concession, seller financing, or rate buy-down credit?
- Built in 1975 — when were the roof, HVAC, electrical panel, plumbing, and water heater last replaced?
- Why hasn't it sold? Are there any deal-killer items the seller is aware of (foundation, flood, title, zoning, code violations)?
- Is there a deadline driving the sale (1031 exchange, divorce, estate, relocation)? That informs how much negotiation room exists.
- Schools are A-rated — typically a magnet for longer-tenancy family renters. What's the average tenant stay here, and is there a school-zone premium baked into asking?
- The area grade is low — what's the realistic commute time and amenity access for the typical tenant pool here? Any planned neighborhood developments (good or bad) we should know about?
- What's the average days-on-market for RENTAL listings here right now (not sales)? A rising rental-DOM trend means longer vacancies and softer asking-rent achievability than the comps imply.
- What's the recent tenant-quality profile in this submarket — average credit score on applications, eviction rate, late-payment / NSF rate, and stable-employment percentage? A property-management company in the area should have these aggregated.
- How much new for-sale + rental construction is in the pipeline within 1–3 miles? Heavy new supply typically softens prices + rents 12–24 months out; constrained supply supports both.
Investment metrics
- 1% rule
- 0.79% ✗
- Cap rate
- 5.59%
- Cash-on-cash
- -2.50%
- DSCR
- 0.89
- GRM
- 10.5
CMA / ARV
- ARV (median comp)
- $635,226
- List price
- $299,800
- Delta
- -52.80%
- Verdict
- UNDERPRICED
- Comps
- 4 within 1.0 mi
Show comp detail 1 sale within ~0.75 mi
| Address | Dist | Beds/Ba | Sqft | Sold | Price | $/sf | Match |
|---|---|---|---|---|---|---|---|
| 410 Liddy Dr | 0.05mi | 3/3.5 (-1) | 2,544 (-13%) | 21mo | $894,000 | $351 | 48 |
Match score weights: distance 35% · size 25% · config 20% · recency 20%. Top-matched comps best support the ARV.
Projected returns pro-forma
-3.0% appreciation · 3.0% rent growth · sell at horizon
- IRR
- -20.4%
- Equity multiple
- 0.29×
- Total profit
- $-59,706
- Equity at exit
- $44,701
- IRR
- -13.6%
- Equity multiple
- 0.21×
- Total profit
- $-66,245
- Equity at exit
- $25,921
Cash invested: $83,944 (down + closing). Projections, not guarantees.
Landlord ↔ Tenant lean methodology
- Overall (STATE)
- 62 Landlord-Friendly
- State Michigan
- 62 Landlord-Friendly · EVEN
- County
- — inherits STATE
- City
- — inherits STATE
ZIP-level market 48114
- Active inventory
- 136
- Price-to-rent
- 10.5×
Monthly cashflow live
- Estimated rent
- $2,380 medium interval (Pro) →
- Mortgage (P&I)
- −$1,572
- Tax from tax record
- −$358 /mo · $4,301/yr
- Insurance
- −$125
- HOA
- −$0
- Vacancy / Maint / Mgmt
- −$500
- Net cashflow
- $-175
Break-even live
UW: 25.0% down · 7.5% · 30yr · 1.5% tax · 5.0% vac · 8.0% maint · 8.0% mgmt
Financing live
Cash to close
- Down payment
- $74,950
- Closing costs
- $8,994
- Reserves months
- —
- Total cash needed
- —
Loan-product check · same deal, 3 products live
Conventional
25% down · 7.5% · 30yr
- Down + closing
- —
- Monthly P&I
- —
- Monthly cashflow
- —
- DSCR
- —
- Eligible?
- —
Personal DTI + credit; lowest rate.
DSCR
20% down · 8.5% · 30yr
- Down + closing
- —
- Monthly P&I
- —
- Monthly cashflow
- —
- DSCR
- —
- Eligible?
- —
No personal income docs; deal must DSCR.
Hard money
10% down · 12.0% · 12mo
- Down + closing
- —
- Monthly P&I
- —
- Monthly cashflow
- —
- DSCR
- —
- Eligible?
- —
Short-term bridge; refi at stabilization.
Listing history 31 events
-
2026-06-18days on market $299,800 Active 106 DOM
-
2026-06-17days on market $299,800 Active 105 DOM
-
2026-06-16days on market $299,800 Active 104 DOM
-
2026-06-15days on market $299,800 Active 103 DOM
-
2026-06-13days on market $299,800 Active 101 DOM
-
2026-06-13days on market $299,800 Active 100 DOM
-
2026-06-09days on market $299,800 Active 97 DOM
-
2026-06-08days on market $299,800 Active 96 DOM
-
2026-06-07days on market $299,800 Active 95 DOM
-
2026-06-04days on market $299,800 Active 92 DOM
-
2026-06-03days on market $299,800 Active 91 DOM
-
2026-06-02days on market $299,800 Active 90 DOM
-
2026-06-01days on market $299,800 Active 89 DOM
-
2026-05-31days on market $299,800 Active 88 DOM
-
2026-03-27price $299,800 874-char remark
Show marketing remark (874 chars)
A rare estate-sized offering in the heart of Brighton Township: Positioned on nearly five wooded acres, this property delivers privacy, scale, and the opportunity to create a truly custom legacy setting. This property presents a compelling opportunity to create something truly special. Whether you envision a custom-built private estate, luxury retreat, or long-term investment hold, the land and location set the stage. The existing structure sustained fire damage and is being sold strictly as-is. The value is in the land, setting, and redevelopment potential. An established driveway and utilities already on site provide a meaningful head start for future plans. Properties offering this level of acreage, privacy, and positioning in Brighton are increasingly difficult to find. Bring your builder, your architect, and your vision. Engineered for those ready to build.
-
2026-03-04$349,900 Active 874-char remark
Show marketing remark (874 chars)
A rare estate-sized offering in the heart of Brighton Township: Positioned on nearly five wooded acres, this property delivers privacy, scale, and the opportunity to create a truly custom legacy setting. This property presents a compelling opportunity to create something truly special. Whether you envision a custom-built private estate, luxury retreat, or long-term investment hold, the land and location set the stage. The existing structure sustained fire damage and is being sold strictly as-is. The value is in the land, setting, and redevelopment potential. An established driveway and utilities already on site provide a meaningful head start for future plans. Properties offering this level of acreage, privacy, and positioning in Brighton are increasingly difficult to find. Bring your builder, your architect, and your vision. Engineered for those ready to build.
-
2026-02-19soldstatus $307,500
-
2011-08-19historical
-
2011-08-19historical
-
2011-02-19$314,900
-
2011-02-19$314,900
-
2011-02-18historical
-
2011-02-18historical
-
2010-08-22$329,900
-
2010-08-22$329,900
-
2010-04-10historical
-
2009-10-03$324,900
-
2009-10-02historical
-
2009-04-02$335,000
ⓘ Source: listings_history table (triggers on properties + properties_extension) + one-shot
backfill from property_details.listing_events for pre-trigger history.
Tax reassessment forecast MI · Partial reset (capped growth)
- Current annual tax
- $4,301 · $358/mo
- Projected year-2 tax
- $4,459 · $372/mo
- Expected delta
- +$158/yr (+$13/mo · 3.7%)
ⓘ Screening estimate from a state-policy table — verify with the county assessor before closing.
Climate risk First Street
- Flood 1/10 Low FEMA zone X (unshaded) · 0% chance over 30 yrs
- Wildfire 2/10 Low
- Heat 2/10 Low 7 d/yr ≥95°F today · 15 d/yr by 30 yrs out
- Wind 2/10 Low
- Air quality 2/10 Low 1 unhealthy d/yr today · 2 by 30 yrs out
Nearby sold comps map
Loading sold comps map…
Walkable amenities ~0.75 mi
Loading nearby amenities…
Taxation est. · year 1
- Rental income
- $28,563
- − Mortgage interest
- −$16,793
- − Property taxes
- −$4,301
- − Insurance
- −$1,499
- − Repairs & maintenance
- −$2,285
- − Management
- −$2,285
- − Depreciation
- −$8,721
- Taxable loss
- −$7,322
- Est. tax savings @ 24.0%
- +$1,757
- After-tax cash flow
- $-344/yr
For passive investors: Depreciation is non-cash, so a rental often shows a tax loss while cash-flowing — sheltering income. Rental losses are passive: they offset passive income freely, and up to $25,000/yr can offset ordinary (W-2) income if you actively participate and your MAGI is under $100k (phasing out to $0 by $150k); unused losses carry forward. On sale, claimed depreciation is recaptured at up to 25%, and gains may owe capital-gains tax (a 1031 exchange can defer both). Figures are a year-1 estimate at your 24.0% rate — not tax advice; consult a CPA.
Schools (NCES district)
- District
- Hartland Consolidated Schools
- NCES district ID
- 2617910
- Math proficiency
- 52% ▼ -8.00%
- Reading proficiency
- 62% ▼ -7.00%
- Median HH income
- $85,269
- Composite
- 51.93/100
- National rank
- #1647
- State rank
- #41 of 540 in MI
Livability — Brighton
- Score
- 78/100
- State rank
- #108
- US rank
- #2621
Category grades
Schools grade is shown separately in the Schools card above.
Census & demographics
- City population
- 27,289
- Population (ZIP)
- 21,476
Population outlook (Livingston County) Hauer SSP2
- Today (2025)
- 202,920 people
- By 2030
- 209,173 · +3.1%
- By 2040
- 216,878 · +6.9%
- By 2050
- 217,485 · +7.2%
- By 2075
- 217,590 · +7.2%
- By 2100
- 197,095 · -2.9%
Race, ethnicity, and origin ACS 2023
- Neighborhood character
- Predominantly White (92%)
- Race & ethnicity
- White 92% Two or more races 4% Hispanic / Latino 3% Asian 2%
- Common ancestry
- Romanian 12% Slovak 3% Lithuanian 3%
- Foreign-born
- 4% · Canada
- Languages at home
- 97% English-only · Other Indo-European 1% Spanish 1%
Political lean MEDSL · Livingston
- 2024 margin
- Strong R (+23.9) · D 37.4% · R 61.3% · Other 1.3%
- 2008→2024 swing
- -10.7pp toward R · 2008: -13.3pp · 2024: -23.9pp
- All cycles
- 2024: R+23.9 2020: R+22.6 2016: R+29.6 2012: R+23.3 2008: R+13.3
Not yet ingested
- Civics
- —
Market trends
- HPI YoY
- ▼ -253.14%
- Current HPI
- 199.3865
- Rent YoY
- —
- Metro
- —
- State GDP YoY
- ▲ 1.37%
- F500 in state
- 28
Industry mix (Fortune 500 HQ in MI)
| Industry | F500 HQs | Revenue |
|---|---|---|
| Automotive Parts | 3 | $48B |
|
||
| Automotive | 2 | $372B |
|
||
| Chemicals | 1 | $45B |
|
||
| Automotive Retail | 1 | $29B |
|
||
| Healthcare / Medical Devices | 1 | $23B |
|
||
| Automotive Technology | 1 | $20B |
|
||
Price history
-10.5% since first listed17 events — show timeline
- 2026-03-27 Price Changed $299,800 MiRealSource-MiMLS
- 2026-03-27 Price Changed $299,800 REALCOMP
- 2026-03-04 Listed $349,900 REALCOMP
- 2026-03-04 Listed $349,900 MiRealSource-MiMLS
- 2026-02-19 Sold (Public Records) $307,500 Public Records
- 2011-08-19 Listing Removed — REALCOMP
- 2011-08-19 Listing Removed — MiRealSource-MiMLS
- 2011-02-19 Listed $314,900 REALCOMP
- 2011-02-19 Listed $314,900 MiRealSource-MiMLS
- 2011-02-18 Listing Removed — REALCOMP
- 2011-02-18 Listing Removed — MiRealSource-MiMLS
- 2010-08-22 Listed $329,900 REALCOMP
- 2010-08-22 Listed $329,900 MiRealSource-MiMLS
- 2010-04-10 Listing Removed — REALCOMP
- 2009-10-03 Listed $324,900 REALCOMP
- 2009-10-02 Listing Removed — REALCOMP
- 2009-04-02 Listed $335,000 REALCOMP
Property tax history
+3.6%/yrLatest (2025): $4,301 · +2.9% YoY. Source: county tax records.
Cash-flow waterfall
monthlySold comps — $/sqft
last 12 mo · ≤1 miLoading sold comps…