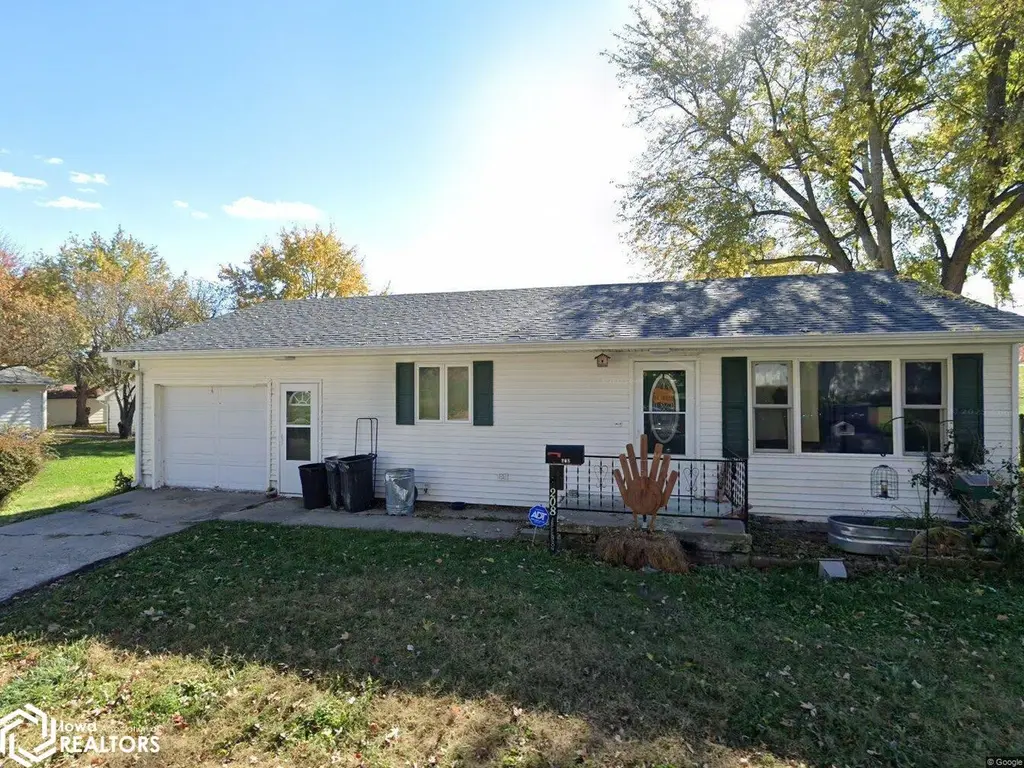
208 Jefferson St · Bedford, IA
Flood risk 4/10 · Minor
- FEMA flood zone
- X (unshaded)
- Chance of flooding over 30 yrs
- 0.22%
- Est. flood insurance / yr
- $507 – $1,088
Fire risk 4/10 · Minor
- Est. fire insurance / yr
- $902 – $1,676
Heat risk 3/10 · Minor
- Hot days now (above 105°F)
- 7 days/yr
- Hot days in 30 yrs
- 15 days/yr
Wind risk 2/10 · Minimal
- Chance of severe wind over 30 yrs
- —
Air-quality risk 1/10 · Minimal
- Unhealthy air days now
- 0 days/yr
- Unhealthy air days in 30 yrs
- 0 days/yr
Risk factors via First Street. Map © Google.
Why this score? — see what drove the D grade
The composite is a weighted blend of 9 inputs, each scored 0–100. Each bar is that input's sub-score; the figure is the points it added to the 100-point composite (weight × sub-score).
- Cash flow +10.8/30.0
- Appreciation +10.0/10.0
- Schools +7.0/10.0
- Livability +4.1/5.0
- DSCR +3.1/10.0
- 1% rule +3.0/10.0
- Rent growth +2.5/5.0
- Condition / age +2.5/5.0
- ARV discount +0.8/15.0
$107,500
🖨 Deal sheet 📄 Offer letter ✓ Due diligence
Listing remarks MLS
Welcome home to this charming two bedroom, one bathroom ranch that proves good things really do come in cozy packages! This affordably priced house is ready for its next chapter, whether you're a first-time buyer, looking to downsize, or searching for a solid investment opportunity. Step inside and you'll find the essentials already waiting for you, including the range, refrigerator, and washer, dryer. The original hardwood floors in both bedrooms make your decor decisions unlimited. The covered deck is perfect for morning coffee sessions or evening hangouts with friends, giving you that extra outdoor living space we all crave. Outside the large lot offers plenty of room to spread out, start a garden, or let the kids and pets run free. You'll also love the fourteen by fifteen storage shed with concrete flooring and the bonus sixteen by twenty-four garage with concrete. That's serious storage and workspace potential right there. Schedule your showing today and see what this home has to offer! Price Reduced!
Key facts
- Covered deck
- Bonus garage
- Large lot
Tags
Neighborhood map
What this means for you Summary
Snapshot
- This is a 2-bed/2.0-bath single-family listed at $108k.
Deal economics
- At list price, monthly cash flow is $-50 ($-594/yr) — negative.
- To cash-flow at today's rent, offer at most $99k (8.1% below list).
- To meet the 1% rule (rent ≥ 1% of price), the offer needs to be $86k (20.2% below list).
- Recommended offer: $86k (20.2% below list) — sets the bar for 1% rule.
Location & tenants
- Location reads 82/100 on livability (#50 in IA, #1,245 nationally) — a professional / high-income tenant draw. Strengths: schools A+, crime A+, cost of living A+; Watch: amenities F, commute F.
- Bedford Community School District (rural): math 81% / reading 85% proficiency, ranked #23 of 289 in IA (top 8%) — strong family-tenant draw, lease renewals of 3-5y typical.
- Market conditions: 33 active listings in the ZIP; 4 units permitted in Taylor County in 2024 (0 in 5+ unit buildings).
Forward outlook
- In year one you build about $11k of equity ($743 loan paydown + $11k appreciation (10.0% local appreciation)).
- At projected returns (10.0% appreciation + 3.0% rent growth), your $30k cash investment doubles in ~3 years — after that, you're playing with house money.
- By year 4, paydown + projected appreciation supports a ~$41k cash-out refi (75% LTV) — recoverable capital for the next deal without selling this one.
Negotiation context
- It's been on market 151 days — a 12% lower offer ($95k) is reasonable based on typical stale-listing flexibility.
- Current owner paid $50k; list at $108k implies a 117% gain — meaningful room to come down on a strong offer.
Questions for the listing agent
- What do current leases actually rent for vs. the listed asking? Can we see a recent rent roll and the last 12 months of T-12 income?
- It's been on market 151 days. Have you received any prior offers? Is the seller open to a 20% concession, seller financing, or rate buy-down credit?
- Built in 1962 — when were the roof, HVAC, electrical panel, plumbing, and water heater last replaced?
- Why hasn't it sold? Are there any deal-killer items the seller is aware of (foundation, flood, title, zoning, code violations)?
- Is there a deadline driving the sale (1031 exchange, divorce, estate, relocation)? That informs how much negotiation room exists.
- Schools are A-rated — typically a magnet for longer-tenancy family renters. What's the average tenant stay here, and is there a school-zone premium baked into asking?
- The area grade is low — what's the realistic commute time and amenity access for the typical tenant pool here? Any planned neighborhood developments (good or bad) we should know about?
- What's the average days-on-market for RENTAL listings here right now (not sales)? A rising rental-DOM trend means longer vacancies and softer asking-rent achievability than the comps imply.
- What's the recent tenant-quality profile in this submarket — average credit score on applications, eviction rate, late-payment / NSF rate, and stable-employment percentage? A property-management company in the area should have these aggregated.
- How much new for-sale + rental construction is in the pipeline within 1–3 miles? Heavy new supply typically softens prices + rents 12–24 months out; constrained supply supports both.
Investment metrics
- 1% rule
- 0.80% ✗
- Cap rate
- 5.74%
- Cash-on-cash
- -1.97%
- DSCR
- 0.91
- GRM
- 10.4
CMA / ARV
- ARV (median comp)
- $93,584
- List price
- $107,500
- Delta
- 14.87%
- Verdict
- OVERPRICED
- Comps
- 20 within 1.0 mi
Show comp detail 6 sales within ~0.75 mi
| Address | Dist | Beds/Ba | Sqft | Sold | Price | $/sf | Match |
|---|---|---|---|---|---|---|---|
| 803 Jackson St | 0.41mi | 2/1.0 | 900 (+5%) | 1mo | $110,000 | $122 | 68 |
| 704 Court St | 0.20mi | 2/1.0 | 812 (-5%) | 13mo | $83,000 | $102 | 67 |
| 507 North St | 0.30mi | 2/2.0 | 944 (+10%) | 4mo | $65,000 | $69 | 66 |
| 1305 Washington St | 0.68mi | 2/1.0 | 864 (+1%) | 12mo | $95,000 | $110 | 53 |
| 1101 Central Ave | 0.28mi | 2/1.0 | 736 (-14%) | 9mo | $116,600 | $158 | 51 |
| 407 Randolph St | 0.70mi | 2/1.0 | 928 (+8%) | 13mo | $89,000 | $96 | 39 |
Match score weights: distance 35% · size 25% · config 20% · recency 20%. Top-matched comps best support the ARV.
Projected returns pro-forma
10.0% appreciation · 3.0% rent growth · sell at horizon
- IRR
- 22.9%
- Equity multiple
- 2.84×
- Total profit
- $55,397
- Equity at exit
- $96,845
- IRR
- 20.4%
- Equity multiple
- 6.50×
- Total profit
- $165,621
- Equity at exit
- $208,849
Cash invested: $30,100 (down + closing). Projections, not guarantees.
Landlord ↔ Tenant lean methodology
- Overall (STATE)
- 83 Strongly Landlord-Friendly
- State Iowa
- 83 Strongly Landlord-Friendly · R+6
- County
- — inherits STATE
- City
- — inherits STATE
ZIP-level market 50833
- Home prices YoY
- 12.5%
- Active inventory
- 33
- Price-to-rent
- 10.4×
Monthly cashflow live
- Estimated rent
- $858 medium interval (Pro) →
- Mortgage (P&I)
- −$564
- Tax from tax record
- −$118 /mo · $1,422/yr
- Insurance
- −$45
- HOA
- −$0
- Vacancy / Maint / Mgmt
- −$180
- Net cashflow
- $-50
Break-even live
UW: 25.0% down · 7.5% · 30yr · 1.5% tax · 5.0% vac · 8.0% maint · 8.0% mgmt
Financing live
Cash to close
- Down payment
- $26,875
- Closing costs
- $3,225
- Reserves months
- —
- Total cash needed
- —
Loan-product check · same deal, 3 products live
Conventional
25% down · 7.5% · 30yr
- Down + closing
- —
- Monthly P&I
- —
- Monthly cashflow
- —
- DSCR
- —
- Eligible?
- —
Personal DTI + credit; lowest rate.
DSCR
20% down · 8.5% · 30yr
- Down + closing
- —
- Monthly P&I
- —
- Monthly cashflow
- —
- DSCR
- —
- Eligible?
- —
No personal income docs; deal must DSCR.
Hard money
10% down · 12.0% · 12mo
- Down + closing
- —
- Monthly P&I
- —
- Monthly cashflow
- —
- DSCR
- —
- Eligible?
- —
Short-term bridge; refi at stabilization.
Listing history 18 events
-
2026-06-18days on market $107,500 Active 151 DOM
-
2026-06-17days on market $107,500 Active 150 DOM
-
2026-06-16days on market $107,500 Active 149 DOM
-
2026-06-15days on market $107,500 Active 148 DOM
-
2026-06-13days on market $107,500 Active 146 DOM
-
2026-06-12days on market $107,500 Active 145 DOM
-
2026-06-09days on market $107,500 Active 142 DOM
-
2026-06-08days on market $107,500 Active 141 DOM
-
2026-06-07days on market $107,500 Active 140 DOM
-
2026-06-05days on market $107,500 Active 138 DOM
-
2026-06-04days on market $107,500 Active 136 DOM
-
2026-06-02days on market $107,500 Active 135 DOM
-
2026-06-01days on market $107,500 Active 134 DOM
-
2026-05-31days on market $107,500 Active 133 DOM
-
2026-05-31days on market $107,500 Active 132 DOM
-
2026-05-07price $107,500 1021-char remark
Show marketing remark (1021 chars)
Welcome home to this charming two bedroom, one bathroom ranch that proves good things really do come in cozy packages! This affordably priced house is ready for its next chapter, whether you're a first-time buyer, looking to downsize, or searching for a solid investment opportunity. Step inside and you'll find the essentials already waiting for you, including the range, refrigerator, and washer, dryer. The original hardwood floors in both bedrooms make your decor decisions unlimited. The covered deck is perfect for morning coffee sessions or evening hangouts with friends, giving you that extra outdoor living space we all crave. Outside the large lot offers plenty of room to spread out, start a garden, or let the kids and pets run free. You'll also love the fourteen by fifteen storage shed with concrete flooring and the bonus sixteen by twenty-four garage with concrete. That's serious storage and workspace potential right there. Schedule your showing today and see what this home has to offer! Price Reduced!
-
2026-01-19$114,500 Active 1021-char remark
Show marketing remark (1021 chars)
Welcome home to this charming two bedroom, one bathroom ranch that proves good things really do come in cozy packages! This affordably priced house is ready for its next chapter, whether you're a first-time buyer, looking to downsize, or searching for a solid investment opportunity. Step inside and you'll find the essentials already waiting for you, including the range, refrigerator, and washer, dryer. The original hardwood floors in both bedrooms make your decor decisions unlimited. The covered deck is perfect for morning coffee sessions or evening hangouts with friends, giving you that extra outdoor living space we all crave. Outside the large lot offers plenty of room to spread out, start a garden, or let the kids and pets run free. You'll also love the fourteen by fifteen storage shed with concrete flooring and the bonus sixteen by twenty-four garage with concrete. That's serious storage and workspace potential right there. Schedule your showing today and see what this home has to offer! Price Reduced!
-
2013-09-10soldstatus $49,500
ⓘ Source: listings_history table (triggers on properties + properties_extension) + one-shot
backfill from property_details.listing_events for pre-trigger history.
Tax reassessment forecast IA · Partial reset (capped growth)
- Current annual tax
- $1,422 · $118/mo
- Projected year-2 tax
- $1,555 · $130/mo
- Expected delta
- +$133/yr (+$11/mo · 9.3%)
ⓘ Screening estimate from a state-policy table — verify with the county assessor before closing.
Climate risk First Street
- Flood 4/10 Moderate FEMA zone X (unshaded) · 22% chance over 30 yrs
- Wildfire 4/10 Moderate
- Heat 3/10 Moderate 7 d/yr ≥105°F today · 15 d/yr by 30 yrs out
- Wind 2/10 Low
- Air quality 1/10 Low 0 unhealthy d/yr today · 0 by 30 yrs out
Nearby sold comps map
Loading sold comps map…
Walkable amenities ~0.75 mi
Loading nearby amenities…
Taxation est. · year 1
- Rental income
- $10,291
- − Mortgage interest
- −$6,022
- − Property taxes
- −$1,422
- − Insurance
- −$538
- − Repairs & maintenance
- −$823
- − Management
- −$823
- − Depreciation
- −$3,127
- Taxable loss
- −$2,464
- Est. tax savings @ 24.0%
- +$591
- After-tax cash flow
- $-3/yr
For passive investors: Depreciation is non-cash, so a rental often shows a tax loss while cash-flowing — sheltering income. Rental losses are passive: they offset passive income freely, and up to $25,000/yr can offset ordinary (W-2) income if you actively participate and your MAGI is under $100k (phasing out to $0 by $150k); unused losses carry forward. On sale, claimed depreciation is recaptured at up to 25%, and gains may owe capital-gains tax (a 1031 exchange can defer both). Figures are a year-1 estimate at your 24.0% rate — not tax advice; consult a CPA.
Schools (NCES district)
- District
- Bedford Community School District
- NCES district ID
- 1904560
- Math proficiency
- 81% ▬ 0.00%
- Reading proficiency
- 85% ▲ 3.00%
- Median HH income
- $43,547
- Composite
- 69.52/100
- National rank
- #305
- State rank
- #23 of 289 in IA
Livability — Bedford
- Score
- 82/100
- State rank
- #50
- US rank
- #1245
Category grades
Schools grade is shown separately in the Schools card above.
Census & demographics
- Census place
- Bedford, IA
- Population (ZIP)
- 2,085
Population outlook (Taylor County) Hauer SSP2
- Today (2025)
- 6,143 people
- By 2030
- 6,100 · -0.7%
- By 2040
- 6,080 · -1.0%
- By 2050
- 6,146 · +0.0%
- By 2075
- 6,596 · +7.4%
- By 2100
- 6,954 · +13.2%
Race, ethnicity, and origin ACS 2023
- Neighborhood character
- Predominantly White (95%)
- Race & ethnicity
- White 95% Hispanic / Latino 2% Two or more races 2%
- Common ancestry
- Slovak 2% Iranian 1% Italian 1%
- Foreign-born
- 1% · Canada
- Languages at home
- 99% English-only · Spanish 1%
Political lean MEDSL · Taylor
- 2024 margin
- Solid R (+55.7) · D 21.6% · R 77.4% · Other 1.0%
- 2008→2024 swing
- -47.1pp toward R · 2008: -8.6pp · 2024: -55.7pp
- All cycles
- 2024: R+55.7 2020: R+52.9 2016: R+45.1 2012: R+14.1 2008: R+8.6
Not yet ingested
- Civics
- —
Market trends
- HPI YoY
- ▲ 15.13%
- Current HPI
- 136.32
- Rent YoY
- —
- Metro
- —
- State GDP YoY
- ▲ 2.48%
- F500 in state
- 4
Industry mix (Fortune 500 HQ in IA)
| Industry | F500 HQs | Revenue |
|---|---|---|
| Financial Services | 1 | $16B |
|
||
| Retail / Convenience | 1 | $15B |
|
||
Price history
+117.2% since first listed3 events — show timeline
- 2026-05-07 Price Changed $107,500 IAR
- 2026-01-19 Listed $114,500 IAR
- 2013-09-10 Sold (Public Records) $49,500 Public Records
Property tax history
+6.0%/yrLatest (2025): $1,422 · +1.3% YoY. Source: county tax records.
Cash-flow waterfall
monthlySold comps — $/sqft
last 12 mo · ≤1 miLoading sold comps…