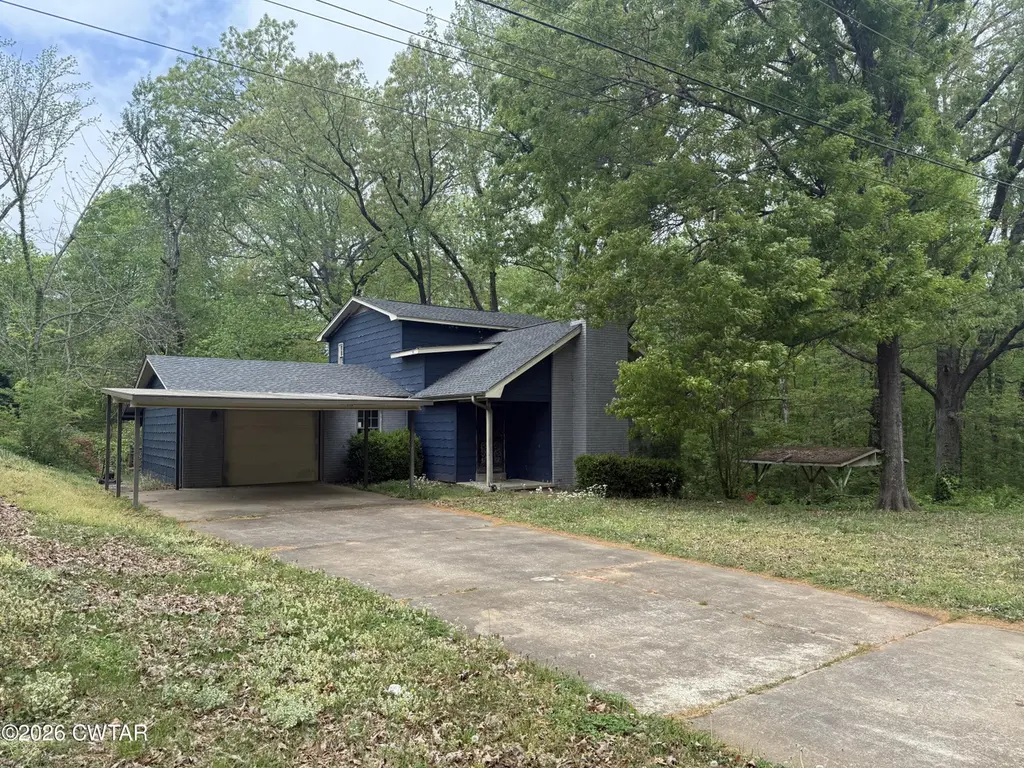
133 Meridian Dr · Jackson, TN
Flood risk 6/10 · Moderate
- FEMA flood zone
- X (unshaded)
- Chance of flooding over 30 yrs
- 0.69%
- Est. flood insurance / yr
- $473 – $860
Fire risk 3/10 · Minor
- Est. fire insurance / yr
- $949 – $1,763
Heat risk 6/10 · Moderate
- Hot days now (above 109°F)
- 7 days/yr
- Hot days in 30 yrs
- 21 days/yr
Wind risk 4/10 · Minor
- Chance of severe wind over 30 yrs
- 15.0%
Air-quality risk 1/10 · Minimal
- Unhealthy air days now
- 0 days/yr
- Unhealthy air days in 30 yrs
- 0 days/yr
Risk factors via First Street. Map © Google.
Why this score? — see what drove the C+ grade
The composite is a weighted blend of 9 inputs, each scored 0–100. Each bar is that input's sub-score; the figure is the points it added to the 100-point composite (weight × sub-score).
- Cash flow +24.0/30.0
- ARV discount +15.0/15.0
- DSCR +7.7/10.0
- 1% rule +5.6/10.0
- Rent growth +3.8/5.0
- Livability +3.1/5.0
- Condition / age +2.5/5.0
- Schools +1.2/10.0
- Appreciation +0.0/10.0
$155,000
🖨 Deal sheet 📄 Offer letter ✓ Due diligence
Listing remarks MLS
Spacious home with nice lot.
Key facts
- Added privacy
- Peaceful feel
- Wooded lot
Tags
Property features AI
Exterior
- Parking: Two total parking spaces; Attached 1-car garage; Covered carport with 2 spaces; Garage faces front
- Utilities: Public water; Public sewer; Electricity connected (220 volts); Natural gas available and connected
- Home design: Single-family residence; Two levels; Entry level facing front
- Construction: Wood siding construction; Block foundation; Built as a residential single-family home
- Exterior features: Covered patio/porch; Wooded lot; Asphalt road frontage on a public maintained city street
Interior
- Bedrooms: Two main-level bedrooms
- Flooring: Tile flooring; Wood flooring
- Bathrooms: Two full bathrooms (one on the main level)
- Heating & cooling: Natural gas heating; Central air conditioning
- Interior features: Beamed ceilings; Gas log and wood-burning fireplace
- Laundry & utility: Washer hookup; Electric dryer hookup
Neighborhood map
What this means for you Summary
Snapshot
- This is a 4-bed/2.0-bath single-family listed at $155k.
Deal economics
- At list price, monthly cash flow is $304 ($4k/yr) — positive.
- The deal already cash-flows at list — no discount required.
- Meets the 1% rule at list price ($2k rent vs $155k).
- Recommended offer: $146k (6.0% below list) — sets the bar for market timing.
- Cap rate 8.6% vs local median 3.5% in Jackson — top-decile yield for the area; either an underpriced asset or a hidden risk that comps aren't pricing in. Stress-test before assuming the spread holds.
Location & tenants
- Location reads 62/100 on livability (#216 in TN) — a middle-class / working-renter tenant base. Strengths: cost of living A+, housing A+; Watch: health & safety C-, schools F, crime F.
- Madison County (urban): math 10% / reading 17% proficiency, ranked #131 of 139 in TN (top 94%) — low school quality limits family demand, transient renter base, plan for 1-2y turnover; 68% free/reduced lunch — lower-income household profile, screen leases tightly.
- Market conditions: Rents rising fast (+5.2%/yr); 253 active listings in the ZIP; lower-income renter base — watch delinquency; 247 units permitted in Madison County in 2024 (0 in 5+ unit buildings).
- At $1,638/mo this rent would consume 45% of the median local household income ($43k/yr) (locally 1701% of renters already pay >50% of income on rent) — very limited rent-growth headroom before tenants either downsize or default.
Forward outlook
- Local home prices are declining (-3.0%/yr); year-one equity from $1k of loan paydown is wiped out by about $5k of value loss. Plan a longer hold.
- Madison County population projected at -12% by 2050 — secular population decline; favor cash flow + early exit over multi-decade hold.
- At projected returns (-3.0% appreciation + 5.2% rent growth), your $43k cash investment doubles in ~10 years — after that, you're playing with house money.
Negotiation context
- It's been on market 64 days — a 6% lower offer ($146k) is reasonable based on typical stale-listing flexibility.
- 3 sale attempts since 11y ago with the ask held roughly flat each time — persistent listings suggest the price (not the market) is what's stuck; bring a comps-based counter.
- Current owner paid $44k; list at $155k implies a 252% gain — meaningful room to come down on a strong offer.
Risks & watch-outs
- Climate carrying-cost: major flood risk; extreme-heat days projected 7→21/yr by 2055 (HVAC capex compounding) — expect insurance premiums to compound above CPI over the hold.
Questions for the listing agent
- It's been on market 64 days. Have you received any prior offers? Is the seller open to a 6% concession, seller financing, or rate buy-down credit?
- Built in 1979 — when were the roof, HVAC, electrical panel, plumbing, and water heater last replaced?
- Why hasn't it sold? Are there any deal-killer items the seller is aware of (foundation, flood, title, zoning, code violations)?
- Is there a deadline driving the sale (1031 exchange, divorce, estate, relocation)? That informs how much negotiation room exists.
- Schools are F-rated, which usually means shorter tenancies and higher turnover. Who's the typical renter profile here, and what's been the actual vacancy rate?
- Crime grade is F in this area — have there been break-ins, vandalism, or insurance claims at this property in the last 3 years? What carrier currently insures it and at what premium?
- What's the average days-on-market for RENTAL listings here right now (not sales)? A rising rental-DOM trend means longer vacancies and softer asking-rent achievability than the comps imply.
- What's the recent tenant-quality profile in this submarket — average credit score on applications, eviction rate, late-payment / NSF rate, and stable-employment percentage? A property-management company in the area should have these aggregated.
- How much new for-sale + rental construction is in the pipeline within 1–3 miles? Heavy new supply typically softens prices + rents 12–24 months out; constrained supply supports both.
Investment metrics
- 1% rule
- 1.06% ✓
- Cap rate
- 8.65%
- Cash-on-cash
- 8.41%
- DSCR
- 1.37
- GRM
- 7.9
CMA / ARV
- ARV (on-the-fly)
- $207,115
- Comps found
- 11
Show comp detail 11 sales within ~0.75 mi
| Address | Dist | Beds/Ba | Sqft | Sold | Price | $/sf | Match |
|---|---|---|---|---|---|---|---|
| 87 Michelle Ln | 0.42mi | 4/2.0 | 1,857 (+3%) | 3mo | $250,000 | $135 | 73 |
| 301 Bolivar Hwy | 0.53mi | 4/2.0 | 1,746 (-3%) | 1mo | $160,000 | $92 | 70 |
| 19 Meridian Dr | 0.26mi | 4/2.0 | 1,585 (-12%) | 5mo | $170,000 | $107 | 64 |
| 35 Watlington Rd | 0.55mi | 3/2.0 (-1) | 1,742 (-3%) | 3mo | $296,000 | $170 | 61 |
| 37 Watlington Rd | 0.55mi | 3/2.0 (-1) | 1,692 (-6%) | 2mo | $295,000 | $174 | 58 |
| 9 Timberhill Dr | 0.31mi | 3/2.0 (-1) | 1,958 (+9%) | 17mo | $295,000 | $151 | 52 |
| 652 Chester Levee Rd | 0.74mi | 3/2.0 (-1) | 1,862 (+3%) | 10mo | $85,000 | $46 | 46 |
| 205 Bolivar Hwy | 0.44mi | 3/1.5 (-1) | 1,569 (-13%) | 7mo | $159,000 | $101 | 45 |
| 276 Old Malesus Rd | 0.33mi | 3/2.0 (-1) | 1,995 (+11%) | 22mo | $301,200 | $151 | 43 |
| 34 Malesus Heights Dr | 0.51mi | 3/2.0 (-1) | 1,560 (-13%) | 23mo | $179,900 | $115 | 30 |
| 85 Pecan Cir | 0.63mi | 3/2.0 (-1) | 2,000 (+11%) | 21mo | $215,000 | $108 | 30 |
Match score weights: distance 35% · size 25% · config 20% · recency 20%. Top-matched comps best support the ARV.
Projected returns pro-forma
-3.0% appreciation · 5.19% rent growth · sell at horizon
- IRR
- -1.2%
- Equity multiple
- 0.95×
- Total profit
- $-2,073
- Equity at exit
- $23,111
- IRR
- 10.5%
- Equity multiple
- 1.90×
- Total profit
- $38,878
- Equity at exit
- $13,402
Cash invested: $43,400 (down + closing). Projections, not guarantees.
Landlord ↔ Tenant lean methodology
- Overall (STATE)
- 87 Strongly Landlord-Friendly
- State Tennessee
- 87 Strongly Landlord-Friendly · R+13
- County
- — inherits STATE
- City
- — inherits STATE
ZIP-level market 38301
- Rents YoY
- 5.2%
- Active inventory
- 253
- Price-to-rent
- 7.9×
Monthly cashflow live
- Estimated rent
- $1,638 medium interval (Pro) →
- Mortgage (P&I)
- −$813
- Tax from tax record
- −$113 /mo · $1,351/yr
- Insurance
- −$65
- HOA
- −$0
- Vacancy / Maint / Mgmt
- −$344
- Net cashflow
- $304
Break-even live
UW: 25.0% down · 7.5% · 30yr · 1.5% tax · 5.0% vac · 8.0% maint · 8.0% mgmt
Financing live
Cash to close
- Down payment
- $38,750
- Closing costs
- $4,650
- Reserves months
- —
- Total cash needed
- —
Loan-product check · same deal, 3 products live
Conventional
25% down · 7.5% · 30yr
- Down + closing
- —
- Monthly P&I
- —
- Monthly cashflow
- —
- DSCR
- —
- Eligible?
- —
Personal DTI + credit; lowest rate.
DSCR
20% down · 8.5% · 30yr
- Down + closing
- —
- Monthly P&I
- —
- Monthly cashflow
- —
- DSCR
- —
- Eligible?
- —
No personal income docs; deal must DSCR.
Hard money
10% down · 12.0% · 12mo
- Down + closing
- —
- Monthly P&I
- —
- Monthly cashflow
- —
- DSCR
- —
- Eligible?
- —
Short-term bridge; refi at stabilization.
Listing history 24 events
-
2026-06-19days on market $155,000 Active 64 DOM
-
2026-06-18price $155,000 Active 63 DOM
-
2026-06-18days on market $160,000 Active 63 DOM
-
2026-06-17days on market $160,000 Active 62 DOM
-
2026-06-16days on market $160,000 Active 61 DOM
-
2026-06-15days on market $160,000 Active 60 DOM
-
2026-06-14days on market $160,000 Active 58 DOM
-
2026-06-13days on market $160,000 Active 57 DOM
-
2026-06-10days on market $160,000 Active 55 DOM
-
2026-06-09days on market $160,000 Active 54 DOM
-
2026-06-08days on market $160,000 Active 53 DOM
-
2026-06-07days on market $160,000 Active 52 DOM
-
2026-06-05days on market $160,000 Active 49 DOM
-
2026-06-03days on market $160,000 Active 48 DOM
-
2026-06-02days on market $160,000 Active 47 DOM
-
2026-06-01days on market $160,000 Active 46 DOM
-
2026-05-31days on market $160,000 Active 45 DOM
-
2026-05-30days on market $160,000 Active 44 DOM
-
2026-04-16$160,000 Active
-
2018-04-05soldstatus $44,000 28-char remark
Show marketing remark (28 chars)
Spacious home with nice lot.
-
2017-12-05$49,500 28-char remark
Show marketing remark (28 chars)
Spacious home with nice lot.
-
2015-05-19soldstatus $67,900 354-char remark
Show marketing remark (354 chars)
Nice 3 Bedroom 2 Bath Home, Sunroom overlooks a Creek, Hardwood Floors, Newer Dishwasher, Eat In Kitchen, Wooded Lot, Exquisite Vaulted Ceilings, Wood Beamed Ceiling in Living Room. Vintage Charm with original Front Door from the 70's. 2 Car Attached Carport and 2 Car Attached Garage. Call the Haltom Home Team at 731.984.2200 to view this listing today
-
2015-04-10$69,600 354-char remark
Show marketing remark (354 chars)
Nice 3 Bedroom 2 Bath Home, Sunroom overlooks a Creek, Hardwood Floors, Newer Dishwasher, Eat In Kitchen, Wooded Lot, Exquisite Vaulted Ceilings, Wood Beamed Ceiling in Living Room. Vintage Charm with original Front Door from the 70's. 2 Car Attached Carport and 2 Car Attached Garage. Call the Haltom Home Team at 731.984.2200 to view this listing today
-
2012-09-14soldstatus $92,000
ⓘ Source: listings_history table (triggers on properties + properties_extension) + one-shot
backfill from property_details.listing_events for pre-trigger history.
Tax reassessment forecast TN · Resets to sale price
- Current annual tax
- $1,351 · $113/mo
- Projected year-2 tax
- $1,351 · $113/mo
- Expected delta
- $0/yr ($0/mo · 0.0%)
ⓘ Screening estimate from a state-policy table — verify with the county assessor before closing.
Climate risk First Street
- Flood 6/10 Major FEMA zone X (unshaded) · 69% chance over 30 yrs
- Wildfire 3/10 Moderate
- Heat 6/10 Major 7 d/yr ≥109°F today · 21 d/yr by 30 yrs out
- Wind 4/10 Moderate 15% chance of damaging wind over 30 yrs
- Air quality 1/10 Low 0 unhealthy d/yr today · 0 by 30 yrs out
Nearby sold comps map
Loading sold comps map…
Walkable amenities ~0.75 mi
Loading nearby amenities…
Taxation est. · year 1
- Rental income
- $19,660
- − Mortgage interest
- −$8,682
- − Property taxes
- −$1,351
- − Insurance
- −$775
- − Repairs & maintenance
- −$1,573
- − Management
- −$1,573
- − Depreciation
- −$4,509
- Taxable income
- $1,197
- Est. tax owed @ 24.0%
- −$287
- After-tax cash flow
- $3,364/yr
For passive investors: Depreciation is non-cash, so a rental often shows a tax loss while cash-flowing — sheltering income. Rental losses are passive: they offset passive income freely, and up to $25,000/yr can offset ordinary (W-2) income if you actively participate and your MAGI is under $100k (phasing out to $0 by $150k); unused losses carry forward. On sale, claimed depreciation is recaptured at up to 25%, and gains may owe capital-gains tax (a 1031 exchange can defer both). Figures are a year-1 estimate at your 24.0% rate — not tax advice; consult a CPA.
Schools (NCES district)
- District
- Madison County
- NCES district ID
- 4702580
- Math proficiency
- 10% ▼ -11.00%
- Reading proficiency
- 17% ▼ -4.00%
- Median HH income
- $42,015
- Composite
- 11.74/100
- National rank
- #9687
- State rank
- #131 of 139 in TN
Livability — Jackson
- Score
- 62/100
- State rank
- #216
- US rank
- #16488
Category grades
Schools grade is shown separately in the Schools card above.
Census & demographics
- Census place
- Jackson, TN
- County
- Madison County · 87,024 people
- City population
- 87,024
- Metro
- Jackson, TN
- Population (ZIP)
- 33,536
- Household income
- $43,227
- Rent vs Own
- Severe rent burden
- 1701.0
Population outlook (Madison County) Hauer SSP2
- Today (2025)
- 95,952 people
- By 2030
- 94,264 · -1.8%
- By 2040
- 89,607 · -6.6%
- By 2050
- 84,133 · -12.3%
- By 2075
- 72,215 · -24.7%
- By 2100
- 62,062 · -35.3%
Race, ethnicity, and origin ACS 2023
- Neighborhood character
- Diverse neighborhood (Simpson 0.57)
- Race & ethnicity
- Black 50% White 42% Two or more races 5% Hispanic / Latino 4%
- Common ancestry
- Slovak 1% Serbian 1% Portuguese 1%
- Foreign-born
- 3% · Canada
- Languages at home
- 96% English-only · Spanish 3%
Political lean MEDSL · Madison
- 2024 margin
- R (+18.2) · D 40.3% · R 58.5% · Other 1.2%
- 2008→2024 swing
- +3.4pp toward D · 2008: -21.6pp · 2024: -18.2pp
- All cycles
- 2024: R+18.2 2020: R+12.9 2016: R+15.6 2012: R+8.9 2008: R+21.6
Not yet ingested
- Civics
- —
Market trends
- HPI YoY
- ▼ -112.26%
- Current HPI
- 162.2273
- Rent YoY
- ▲ 5.19%
- Metro
- Jackson, TN
- State GDP YoY
- ▲ 2.78%
- F500 in state
- 22
Industry mix (Fortune 500 HQ in TN)
| Industry | F500 HQs | Revenue |
|---|---|---|
| Healthcare | 3 | $91B |
|
||
| Retail | 3 | $72B |
|
||
| Transportation / Logistics | 1 | $88B |
|
||
| Paper / Packaging | 1 | $19B |
|
||
| Insurance | 1 | $13B |
|
||
| Energy | 1 | $12B |
|
||
Price history
+73.9% since first listed6 events — show timeline
- 2026-04-16 Listed $160,000 CWTAR
- 2018-04-05 Sold (MLS) $44,000 CWTAR
- 2017-12-05 Listed $49,500 CWTAR
- 2015-05-19 Sold (MLS) $67,900 CWTAR
- 2015-04-10 Listed $69,600 CWTAR
- 2012-09-14 Sold (Public Records) $92,000 Public Records
Property tax history
+4.4%/yrLatest (2025): $1,351 · +0.1% YoY. Source: county tax records.
Cash-flow waterfall
monthlySold comps — $/sqft
last 12 mo · ≤1 miLoading sold comps…