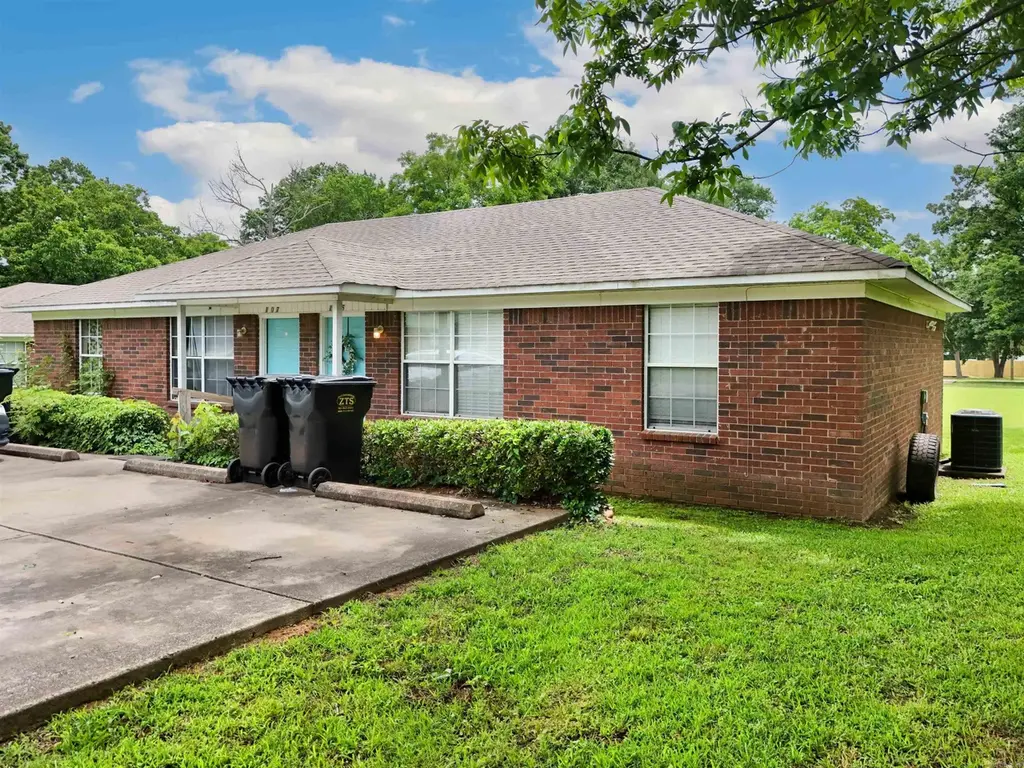
105 & 107 E 4th St · Ward, AR
Flood risk 1/10 · Minimal
- FEMA flood zone
- X (unshaded)
- Chance of flooding over 30 yrs
- 0.0%
- Est. flood insurance / yr
- $507 – $1,088
Fire risk 4/10 · Minor
- Est. fire insurance / yr
- $1,499 – $2,785
Heat risk 6/10 · Moderate
- Hot days now (above 109°F)
- 7 days/yr
- Hot days in 30 yrs
- 19 days/yr
Wind risk 3/10 · Minor
- Chance of severe wind over 30 yrs
- 8.0%
Air-quality risk 2/10 · Minimal
- Unhealthy air days now
- 1 days/yr
- Unhealthy air days in 30 yrs
- 1 days/yr
Risk factors via First Street. Map © Google.
Why this score? — see what drove the C- grade
The composite is a weighted blend of 9 inputs, each scored 0–100. Each bar is that input's sub-score; the figure is the points it added to the 100-point composite (weight × sub-score).
- Cash flow +15.4/30.0
- Appreciation +7.7/10.0
- ARV discount +7.5/15.0
- DSCR +4.7/10.0
- Schools +4.0/10.0
- Livability +3.5/5.0
- 1% rule +3.2/10.0
- Rent growth +2.5/5.0
- Condition / age +2.5/5.0
$179,900
🖨 Deal sheet 📄 Offer letter ✓ Due diligence
Listing remarks
Great Investment Property-- Duplex for Sale in Cabot School District. Looking for a fantastic investment in a prime location? This duplex features 2 units with 2 bedrooms and 1 bathroom—perfect for tenants seeking comfort and convenience. Situated on a quiet street—ideal for individuals, families or professionals. Property received a new roof within the last 2-3 yrs and HVAC replaced in 2021. Located in the highly sought-after Cabot School District. Each unit has its own parking and outdoor space. These fully-occupied duplexes are an excellent opportunity for investors looking for steady rental income or homeowners interested in living in one unit while renting out the others. D
Key facts
- Hvac replaced
- Parking
- Outdoor space
Tags
Property features AI
Finance
- Other: Property managed by Bart Gray Property Mgmt
- Financial info: Yearly lease type available; Potential financing: Cash, FHA, Conventional, VA; Tenant pays all utilities; Owner-paid expenses include taxes, insurance, maintenance/lawn care, electric, water/sewer; Two rental units producing market rents listed between $700–$750 for 2-bedroom units
Exterior
- Parking: Parking for 4+ cars; Parking pads
- Utilities: Electric (Co-Op); Public water; Public sewer
- Home design: Duplex / multi-unit property (2 units); Single-story entry
- Construction: Brick and frame exterior with metal/vinyl siding; Architectural shingle roof; Slab foundation; Built with appraisal-verified building area
- Exterior features: Porch; Level lot; Inside city limits
Interior
- Kitchen: Free-standing stove; Dishwasher
- Bedrooms: Two 2-bedroom units (each unit: 2 bedrooms)
- Flooring: Concrete; Laminate; Partial carpet; Tile; Vinyl
- Bathrooms: Each unit has 1 bathroom
- Heating & cooling: Central electric heating; Central electric cooling
- Interior features: Washer connection; Electric dryer connection; Electric hot water heater; Smoke detector; Ceiling fans; Sheetrock ceilings and walls
- Laundry & utility: Washer connection; Electric dryer connection
Neighborhood map
What this means for you Summary
Snapshot
- This is a 4-bed/2.0-bath other listed at $180k.
Deal economics
- At list price, monthly cash flow is $69 ($831/yr) — positive.
- The deal already cash-flows at list — no discount required.
- To meet the 1% rule (rent ≥ 1% of price), the offer needs to be $147k (18.1% below list).
- Recommended offer: $147k (18.1% below list) — sets the bar for 1% rule.
- Cap rate 6.8% vs local median 4.9% in Ward — top-decile yield for the area; either an underpriced asset or a hidden risk that comps aren't pricing in. Stress-test before assuming the spread holds.
Location & tenants
- Location reads 69/100 on livability (#66 in AR) — a middle-class / working-renter tenant base. Strengths: cost of living A+, housing A+, crime B; Watch: amenities F, commute F.
- Cabot School District (suburban): math 48% / reading 43% proficiency, ranked #29 of 238 in AR (top 12%) — families likely to look elsewhere, expect single-tenant / working-renter base with shorter leases.
- Market conditions: 147 active listings in the ZIP; 11 comparable units currently listed for rent nearby; rentals at typical pace (median 24d on market — plan ~3-4 weeks tenant-placement turnaround); 185 units permitted in Lonoke County in 2024 (0 in 5+ unit buildings).
Forward outlook
- In year one you build about $11k of equity ($1k loan paydown + $10k appreciation (5.3% local appreciation)).
- Lonoke County population projected at +12% by 2050 — modest demand growth; plan on rents tracking national, not racing it.
- At projected returns (5.3% appreciation + 3.0% rent growth), your $50k cash investment doubles in ~4 years — after that, you're playing with house money.
- By year 4, paydown + projected appreciation supports a ~$37k cash-out refi (75% LTV) — recoverable capital for the next deal without selling this one.
Negotiation context
- It's been on market 17 days — a 2% lower offer ($177k) is reasonable based on typical stale-listing flexibility.
- 3 sale attempts with the ask held roughly flat each time — persistent listings suggest the price (not the market) is what's stuck; bring a comps-based counter.
Risks & watch-outs
- Climate carrying-cost: extreme-heat days projected 7→19/yr by 2055 (HVAC capex compounding) — expect insurance premiums to compound above CPI over the hold.
Questions for the listing agent
- Is there a deadline driving the sale (1031 exchange, divorce, estate, relocation)? That informs how much negotiation room exists.
- What's the average days-on-market for RENTAL listings here right now (not sales)? A rising rental-DOM trend means longer vacancies and softer asking-rent achievability than the comps imply.
- What's the recent tenant-quality profile in this submarket — average credit score on applications, eviction rate, late-payment / NSF rate, and stable-employment percentage? A property-management company in the area should have these aggregated.
- How much new for-sale + rental construction is in the pipeline within 1–3 miles? Heavy new supply typically softens prices + rents 12–24 months out; constrained supply supports both.
Investment metrics
- 1% rule
- 0.82% ✗
- Cap rate
- 6.75%
- Cash-on-cash
- 1.65%
- DSCR
- 1.07
- GRM
- 10.2
CMA / ARV
No comps found within radius.
Projected returns pro-forma
5.35% appreciation · 3.0% rent growth · sell at horizon
- IRR
- 15.1%
- Equity multiple
- 1.98×
- Total profit
- $49,468
- Equity at exit
- $105,844
- IRR
- 15.5%
- Equity multiple
- 3.86×
- Total profit
- $143,993
- Equity at exit
- $185,978
Cash invested: $50,372 (down + closing). Projections, not guarantees.
Landlord ↔ Tenant lean methodology
- Overall (STATE)
- 92 Strongly Landlord-Friendly
- State Arkansas
- 92 Strongly Landlord-Friendly · R+14
- County
- — inherits STATE
- City
- — inherits STATE
ZIP-level market 72176
- Home prices YoY
- 2.6%
- Active inventory
- 147
- Price-to-rent
- 10.2×
Monthly cashflow live
- Estimated rent
- $1,474 high interval (Pro) →
- Mortgage (P&I)
- −$943
- Tax from tax record
- −$77 /mo · $925/yr
- Insurance
- −$75
- HOA
- −$0
- Vacancy / Maint / Mgmt
- −$310
- Net cashflow
- $69
Break-even live
UW: 25.0% down · 7.5% · 30yr · 1.5% tax · 5.0% vac · 8.0% maint · 8.0% mgmt
Financing live
Cash to close
- Down payment
- $44,975
- Closing costs
- $5,397
- Reserves months
- —
- Total cash needed
- —
Loan-product check · same deal, 3 products live
Conventional
25% down · 7.5% · 30yr
- Down + closing
- —
- Monthly P&I
- —
- Monthly cashflow
- —
- DSCR
- —
- Eligible?
- —
Personal DTI + credit; lowest rate.
DSCR
20% down · 8.5% · 30yr
- Down + closing
- —
- Monthly P&I
- —
- Monthly cashflow
- —
- DSCR
- —
- Eligible?
- —
No personal income docs; deal must DSCR.
Hard money
10% down · 12.0% · 12mo
- Down + closing
- —
- Monthly P&I
- —
- Monthly cashflow
- —
- DSCR
- —
- Eligible?
- —
Short-term bridge; refi at stabilization.
Rent comps 11 comps
| Address | Beds | Baths | Sqft | Rent | $/sqft | DOM | Units | Dist |
|---|---|---|---|---|---|---|---|---|
| 404 Scott St Ward, AR | 3.0 | 2.0 | 1195 | $1,195 | $1.00 | 19d | 1 | 0.09mi |
| 14 Stephens St Ward, AR | 3.0 | 2.0 | 1128 | $1,395 | $1.24 | 44d | 1 | 0.34mi |
| 21 Kasidyann Ct Ward, AR | 4.0 | 2.0 | 1415 | $1,795 | $1.27 | 23d | 1 | 0.51mi |
| 33 Langford St Ward, AR | 3.0 | 2.0 | 1175 | $1,300 | $1.11 | 23d | 1 | 0.52mi |
| 561 Brewer St Ward, AR | 3.0 | 2.0 | 1050 | $1,450 | $1.38 | 44d | 1 | 0.60mi |
| 39 Bud Grimes Rd Ward, AR | 3.0 | 2.0 | 1308 | $1,550 | $1.19 | 19d | 1 | 0.69mi |
| 21 Weatherwood Ward, AR | 3.0 | 2.0 | 1156 | $1,300 | $1.12 | 23d | 1 | 0.95mi |
| 29 Green Apple Ward, AR | 3.0 | 2.0 | 1200 | $1,450 | $1.21 | 19d | 1 | 1.00mi |
| 23 Green Apple Ward, AR | 3.0 | 2.0 | 1212 | $1,450 | $1.20 | 23d | 1 | 1.01mi |
| 21 Windsor Park Dr Ward, AR | 3.0 | 2.0 | 1442 | $1,500 | $1.04 | 23d | 1 | 1.36mi |
| 12 Gold Meadows Loop Ward, AR | 3.0 | 2.0 | 1484 | $1,300 | $0.88 | 23d | 1 | 1.44mi |
Listing history 13 events
-
2026-06-18days on market $179,900 Active 17 DOM
-
2026-06-17days on market $179,900 Active 16 DOM
-
2026-06-16days on market $179,900 Active 15 DOM
-
2026-06-15days on market $179,900 Active 14 DOM
-
2026-06-14days on market $179,900 Active 12 DOM
-
2026-06-10days on market $179,900 Active 9 DOM
-
2026-06-09days on market $179,900 Active 8 DOM
-
2026-06-08statusdays on market $179,900 Active 7 DOM
-
2026-06-07days on market $179,900 New Listing 6 DOM
-
2026-06-05days on market $179,900 New Listing 3 DOM
-
2026-06-03days on market $179,900 New Listing 2 DOM
-
2026-06-02remarks 687-char remark
-
2026-06-02$179,900 New Listing 1 DOM
ⓘ Source: listings_history table (triggers on properties + properties_extension) + one-shot
backfill from property_details.listing_events for pre-trigger history.
Tax reassessment forecast AR · Resets to sale price
- Current annual tax
- $925 · $77/mo
- Projected year-2 tax
- $1,151 · $96/mo
- Expected delta
- +$227/yr (+$19/mo · 24.5%)
ⓘ Screening estimate from a state-policy table — verify with the county assessor before closing.
Climate risk First Street
- Flood 1/10 Low FEMA zone X (unshaded) · 0% chance over 30 yrs
- Wildfire 4/10 Moderate
- Heat 6/10 Major 7 d/yr ≥109°F today · 19 d/yr by 30 yrs out
- Wind 3/10 Moderate 8% chance of damaging wind over 30 yrs
- Air quality 2/10 Low 1 unhealthy d/yr today · 1 by 30 yrs out
Nearby sold comps map
Loading sold comps map…
Walkable amenities ~0.75 mi
Loading nearby amenities…
Taxation est. · year 1
- Rental income
- $17,691
- − Mortgage interest
- −$10,077
- − Property taxes
- −$925
- − Insurance
- −$900
- − Repairs & maintenance
- −$1,415
- − Management
- −$1,415
- − Depreciation
- −$5,233
- Taxable loss
- −$2,274
- Est. tax savings @ 24.0%
- +$546
- After-tax cash flow
- $1,377/yr
For passive investors: Depreciation is non-cash, so a rental often shows a tax loss while cash-flowing — sheltering income. Rental losses are passive: they offset passive income freely, and up to $25,000/yr can offset ordinary (W-2) income if you actively participate and your MAGI is under $100k (phasing out to $0 by $150k); unused losses carry forward. On sale, claimed depreciation is recaptured at up to 25%, and gains may owe capital-gains tax (a 1031 exchange can defer both). Figures are a year-1 estimate at your 24.0% rate — not tax advice; consult a CPA.
Schools (NCES district)
- District
- Cabot School District
- NCES district ID
- 0503750
- Math proficiency
- 48% ▼ -14.00%
- Reading proficiency
- 43% ▼ -10.00%
- Median HH income
- $55,993
- Composite
- 39.66/100
- National rank
- #3912
- State rank
- #29 of 238 in AR
Livability — Ward
- Score
- 69/100
- State rank
- #66
- US rank
- #8464
Category grades
Schools grade is shown separately in the Schools card above.
Census & demographics
- Census place
- Ward, AR
- County
- Lonoke County · 46,130 people
- City population
- 8,678
- Metro
- Little Rock-North Little Rock-Conway, AR
- Population (ZIP)
- 8,678
- Household income
- $68,840
- Rent vs Own
- Severe rent burden
- 90.0
Population outlook (Lonoke County) Hauer SSP2
- Today (2025)
- 78,072 people
- By 2030
- 80,673 · +3.3%
- By 2040
- 84,977 · +8.8%
- By 2050
- 87,778 · +12.4%
- By 2075
- 91,398 · +17.1%
- By 2100
- 87,858 · +12.5%
Race, ethnicity, and origin ACS 2023
- Neighborhood character
- Predominantly White (85%)
- Race & ethnicity
- White 85% Two or more races 7% Hispanic / Latino 6% Black 2% Asian 1%
- Hispanic origin (detail)
- Mexican 2%
- Common ancestry
- Russian 2% Iranian 1% Slovak 1%
- Foreign-born
- 2% · Canada
- Languages at home
- 95% English-only · Spanish 3% Tagalog/Filipino 1% German/W. Germanic 1%
Political lean MEDSL · Lonoke
- 2024 margin
- Solid R (+53.7) · D 22.2% · R 75.8% · Other 2.0%
- 2008→2024 swing
- -6.2pp toward R · 2008: -47.5pp · 2024: -53.7pp
- All cycles
- 2024: R+53.7 2020: R+52.8 2016: R+53.3 2012: R+50.9 2008: R+47.5
Not yet ingested
- Civics
- —
Market trends
- HPI YoY
- ▲ 5.35%
- Current HPI
- 208.9387
- Rent YoY
- —
- Metro
- Little Rock-North Little Rock-Conway, AR
- State GDP YoY
- ▲ 3.80%
- F500 in state
- 10
Industry mix (Fortune 500 HQ in AR)
| Industry | F500 HQs | Revenue |
|---|---|---|
| Retail | 1 | $681B |
|
||
| Food / Agriculture | 1 | $53B |
|
||
| Retail / Energy | 1 | $22B |
|
||
| Transportation / Logistics | 1 | $12B |
|
||
| Energy | 1 | $4B |
|
||
Price history
-4.1% since first listed5 events — show timeline
- 2026-06-01 Listed $179,900 CARMLS
- 2025-10-02 Listing Removed — CARMLS
- 2025-08-11 Listed $189,900 CARMLS
- 2025-07-16 Listing Removed — CARMLS
- 2025-06-11 Listed $187,500 CARMLS
Property tax history
+0.4%/yrLatest (2025): $925 · +0.0% YoY. Source: county tax records.
Cash-flow waterfall
monthlySold comps — $/sqft
last 12 mo · ≤1 miLoading sold comps…