 🔨 Auction
821 N Franklin St · Red Cloud, NE
Flood risk 1/10 · Minimal
- FEMA flood zone
- X (unshaded)
- Chance of flooding over 30 yrs
- 0.0%
- Est. flood insurance / yr
- $473 – $860
Fire risk 4/10 · Minor
- Est. fire insurance / yr
- $1,161 – $2,155
Heat risk 4/10 · Minor
- Hot days now (above 103°F)
- 7 days/yr
- Hot days in 30 yrs
- 16 days/yr
Wind risk 2/10 · Minimal
- Chance of severe wind over 30 yrs
- —
Air-quality risk 2/10 · Minimal
- Unhealthy air days now
- 1 days/yr
- Unhealthy air days in 30 yrs
- 1 days/yr
Risk factors via First Street. Map © Google.
Why this score? — see what drove the F grade
The composite is a weighted blend of 9 inputs, each scored 0–100. Each bar is that input's sub-score; the figure is the points it added to the 100-point composite (weight × sub-score).
- ARV discount +7.5/15.0
- Appreciation +6.8/10.0
- Cash flow +5.4/30.0
- Livability +3.7/5.0
- Schools +3.6/10.0
- Rent growth +2.5/5.0
- Condition / age +2.5/5.0
- 1% rule +0.0/10.0
- DSCR +0.0/10.0
$25,000
🖨 Deal sheet 📄 Offer letter ✓ Due diligence
Listing remarks
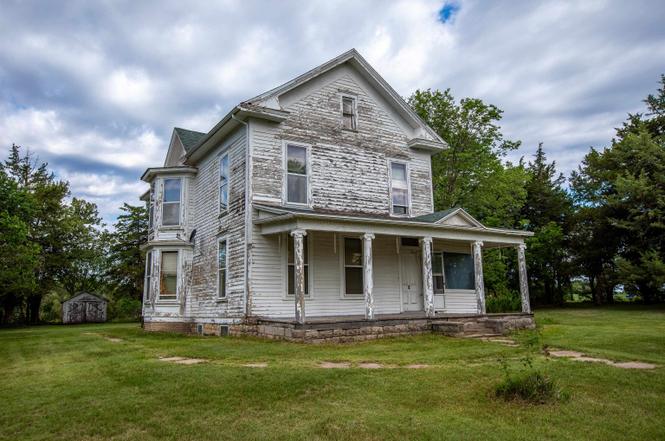
ONLINE ONLY REAL ESTATE AUCTION - (LIST PRICE IS SUGGESTED/OPENING BID ONLY, FINAL PRICE WILL BE DETERMINED ON THE AUCTION) 821 N Franklin - Red Cloud, NE ONLINE ONLY REAL ESTATE AUCTION PROPERTY SHOWN BY APPT ONLY! CONTACT RHYNALDS AUCTION & REALTY, LLC FOR YOUR PERSONAL SHOWING AT 308-832-2444. A rare opportunity to own a historic home situated on over 6 acres! Built in 1880, this property is full of original character and offers beautiful high ceilings, abundant natural light, and spacious rooms throughout. The home will need some work to bring it back to its full potential, but the charm and possibilities are undeniable. The main floor features a front parlor, living room, di
Key facts
- Original character
- Spacious rooms
- High ceilings
Tags
Property features AI
Finance
- Other: Listing broker: Rhynalds Auction & Realty; Listing agent: Rusty Rhynalds (308-832-7407), broker phone 308-832-2444
- Financial info: Annual tax amount approximately $1,058.42
Exterior
- Home design: Residential property; Auction property
- Construction: Zoning: red
- Exterior features: Approximately 6.63 acres
Interior
- Bathrooms: One main-level bathroom
- Interior features: Basement
Neighborhood map
What this means for you Summary
Snapshot
- This is a 2-bed/2.0-bath single-family listed at $25k.
Deal economics
- At list price, monthly cash flow is $-463 ($-6k/yr) — negative.
- The deal already cash-flows at list — no discount required.
- Meets the 1% rule at list price ($1k rent vs $25k).
Location & tenants
- Location reads 74/100 on livability (#121 in NE, #4,675 nationally) — a middle-class / working-renter tenant base. Strengths: crime A+, cost of living A+, housing A+; Watch: schools C-, employment D+, amenities F.
- Red Cloud Community Schools (rural): math 40% / reading 40% proficiency, ranked #219 of 245 in NE (top 89%) — families likely to look elsewhere, expect single-tenant / working-renter base with shorter leases.
- Market conditions: 7 active listings in the ZIP; 2 units permitted in Webster County in 2024 (0 in 5+ unit buildings).
Forward outlook
- In year one you build about $9k of equity ($1k loan paydown + $8k appreciation (3.5% local appreciation)).
- Webster County population projected to shrink 5% by 2050 — rents likely to lag national; underwrite the cash flow, not the appreciation.
- By year 4, paydown + projected appreciation supports a ~$30k cash-out refi (75% LTV) — recoverable capital for the next deal without selling this one.
Negotiation context
- Only 1 days on market — expect competitive offers; lowballing is unlikely to land.
Risks & watch-outs
- Watch-outs: property tax is 4.2% of price; built in 1880 — expect roof / HVAC / electrical / plumbing capex.
Questions for the listing agent
- What do current leases actually rent for vs. the listed asking? Can we see a recent rent roll and the last 12 months of T-12 income?
- Built in 1880 — when were the roof, HVAC, electrical panel, plumbing, and water heater last replaced?
- Property tax is high relative to price — has the assessment been appealed recently, and will the sale trigger a re-assessment?
- Is there a deadline driving the sale (1031 exchange, divorce, estate, relocation)? That informs how much negotiation room exists.
- The area grade is low — what's the realistic commute time and amenity access for the typical tenant pool here? Any planned neighborhood developments (good or bad) we should know about?
- What's the average days-on-market for RENTAL listings here right now (not sales)? A rising rental-DOM trend means longer vacancies and softer asking-rent achievability than the comps imply.
- What's the recent tenant-quality profile in this submarket — average credit score on applications, eviction rate, late-payment / NSF rate, and stable-employment percentage? A property-management company in the area should have these aggregated.
- How much new for-sale + rental construction is in the pipeline within 1–3 miles? Heavy new supply typically softens prices + rents 12–24 months out; constrained supply supports both.
Investment metrics
- 1% rule
- 0.49% ✗
- Cap rate
- 3.68%
- Cash-on-cash
- -9.33%
- DSCR
- 0.59
- GRM
- 16.9
CMA / ARV
- ARV (on-the-fly)
- $212,888
- Comps found
- 1
Show comp detail 1 sale within ~0.75 mi
| Address | Dist | Beds/Ba | Sqft | Sold | Price | $/sf | Match |
|---|---|---|---|---|---|---|---|
| 1144 GH Rd | 0.28mi | 2/1.0 | 2,352 (-2%) | 18mo | $210,100 | $89 | 65 |
Match score weights: distance 35% · size 25% · config 20% · recency 20%. Top-matched comps best support the ARV.
Projected returns pro-forma
3.54% appreciation · 3.0% rent growth · sell at horizon
- IRR
- 0.6%
- Equity multiple
- 1.04×
- Total profit
- $2,245
- Equity at exit
- $102,314
- IRR
- 4.3%
- Equity multiple
- 1.70×
- Total profit
- $41,743
- Equity at exit
- $163,005
Cash invested: $59,609 (down + closing). Projections, not guarantees.
Landlord ↔ Tenant lean methodology
- Overall (STATE)
- 83 Strongly Landlord-Friendly
- State Nebraska
- 83 Strongly Landlord-Friendly · R+13
- County
- — inherits STATE
- City
- — inherits STATE
ZIP-level market 68970
- Home prices YoY
- 1.6%
- Active inventory
- 7
- Price-to-rent
- 2.0×
Monthly cashflow live
- Estimated rent
- $1,051 medium interval (Pro) →
- Mortgage (P&I)
- −$1,116
- Tax from tax record
- −$88 /mo · $1,058/yr
- Insurance
- −$89
- HOA
- −$0
- Vacancy / Maint / Mgmt
- −$221
- Net cashflow
- $-463
Break-even live
UW: 25.0% down · 7.5% · 30yr · 1.5% tax · 5.0% vac · 8.0% maint · 8.0% mgmt
Financing live
Cash to close
- Down payment
- $53,222
- Closing costs
- $6,387
- Reserves months
- —
- Total cash needed
- —
Loan-product check · same deal, 3 products live
Conventional
25% down · 7.5% · 30yr
- Down + closing
- —
- Monthly P&I
- —
- Monthly cashflow
- —
- DSCR
- —
- Eligible?
- —
Personal DTI + credit; lowest rate.
DSCR
20% down · 8.5% · 30yr
- Down + closing
- —
- Monthly P&I
- —
- Monthly cashflow
- —
- DSCR
- —
- Eligible?
- —
No personal income docs; deal must DSCR.
Hard money
10% down · 12.0% · 12mo
- Down + closing
- —
- Monthly P&I
- —
- Monthly cashflow
- —
- DSCR
- —
- Eligible?
- —
Short-term bridge; refi at stabilization.
Listing history 2 events
-
2026-06-18remarks 695-char remark
-
2026-06-18$25,000 Active 1 DOM
ⓘ Source: listings_history table (triggers on properties + properties_extension) + one-shot
backfill from property_details.listing_events for pre-trigger history.
Tax reassessment forecast NE · Resets to sale price
- Current annual tax
- $1,058 · $88/mo
- Projected year-2 tax
- $1,058 · $88/mo
- Expected delta
- $0/yr ($0/mo · 0.0%)
ⓘ Screening estimate from a state-policy table — verify with the county assessor before closing.
Climate risk First Street
- Flood 1/10 Low FEMA zone X (unshaded) · 0% chance over 30 yrs
- Wildfire 4/10 Moderate
- Heat 4/10 Moderate 7 d/yr ≥103°F today · 16 d/yr by 30 yrs out
- Wind 2/10 Low
- Air quality 2/10 Low 1 unhealthy d/yr today · 1 by 30 yrs out
Nearby sold comps map
Loading sold comps map…
Walkable amenities ~0.75 mi
Loading nearby amenities…
Taxation est. · year 1
- Rental income
- $12,609
- − Mortgage interest
- −$11,925
- − Property taxes
- −$1,058
- − Insurance
- −$1,064
- − Repairs & maintenance
- −$1,009
- − Management
- −$1,009
- − Depreciation
- −$6,193
- Taxable loss
- −$9,649
- Est. tax savings @ 24.0%
- +$2,316
- After-tax cash flow
- $-3,243/yr
For passive investors: Depreciation is non-cash, so a rental often shows a tax loss while cash-flowing — sheltering income. Rental losses are passive: they offset passive income freely, and up to $25,000/yr can offset ordinary (W-2) income if you actively participate and your MAGI is under $100k (phasing out to $0 by $150k); unused losses carry forward. On sale, claimed depreciation is recaptured at up to 25%, and gains may owe capital-gains tax (a 1031 exchange can defer both). Figures are a year-1 estimate at your 24.0% rate — not tax advice; consult a CPA.
Schools (NCES district)
- District
- Red Cloud Community Schools
- NCES district ID
- 3175990
- Math proficiency
- 40% ▼ -5.00%
- Reading proficiency
- 40% ▬ 0.00%
- Median HH income
- $35,560
- Composite
- 35.54/100
- National rank
- #9734
- State rank
- #219 of 245 in NE
Livability — Red Cloud
- Score
- 74/100
- State rank
- #121
- US rank
- #4675
Category grades
Schools grade is shown separately in the Schools card above.
Census & demographics
- Census place
- Red Cloud, NE
- Population (ZIP)
- 1,243
Population outlook (Webster County) Hauer SSP2
- Today (2025)
- 3,563 people
- By 2030
- 3,510 · -1.5%
- By 2040
- 3,463 · -2.8%
- By 2050
- 3,394 · -4.7%
- By 2075
- 3,239 · -9.1%
- By 2100
- 2,706 · -24.1%
Race, ethnicity, and origin ACS 2023
- Neighborhood character
- Predominantly White (90%)
- Race & ethnicity
- White 90% Two or more races 4% Hispanic / Latino 4% Native American 2%
- Common ancestry
- Scottish 2% Lithuanian 2% Portuguese 2%
- Foreign-born
- 1%
- Languages at home
- 98% English-only · Spanish 1%
Political lean MEDSL · Webster
- 2024 margin
- Solid R (+65.4) · D 16.8% · R 82.2% · Other 1.0%
- 2008→2024 swing
- -27.9pp toward R · 2008: -37.5pp · 2024: -65.4pp
- All cycles
- 2024: R+65.4 2020: R+62.7 2016: R+60.1 2012: R+47.1 2008: R+37.5
Not yet ingested
- Civics
- —
Market trends
- HPI YoY
- ▲ 3.54%
- Current HPI
- 224.6825
- Rent YoY
- —
- Metro
- —
- State GDP YoY
- ▲ 0.68%
- F500 in state
- 2
Industry mix (Fortune 500 HQ in NE)
| Industry | F500 HQs | Revenue |
|---|---|---|
| Conglomerate | 1 | $371B |
|
||
Price history
-66.7% since first listed2 events — show timeline
- 2026-06-09 Listed $25,000 GMNMLS
- 2024-04-01 Sold (Public Records) $75,000 Public Records
Property tax history
+2.4%/yrLatest (2025): $1,058 · -17.0% YoY. Source: county tax records.
Cash-flow waterfall
monthlySold comps — $/sqft
last 12 mo · ≤1 miLoading sold comps…