 Multi-family
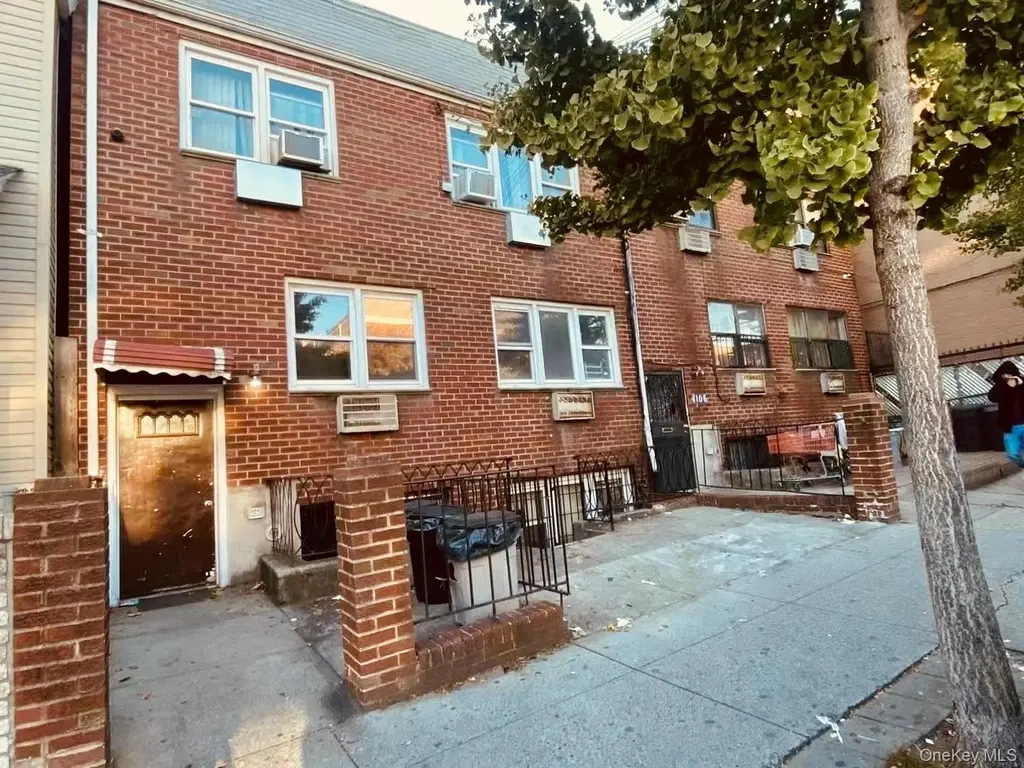
41-08 111th St · New York, NY
Flood risk 1/10 · Minimal
- FEMA flood zone
- X (unshaded)
- Chance of flooding over 30 yrs
- 0.0%
- Est. flood insurance / yr
- $507 – $1,088
Fire risk 1/10 · Minimal
- Est. fire insurance / yr
- $691 – $1,283
Heat risk 6/10 · Moderate
- Hot days now (above 99°F)
- 7 days/yr
- Hot days in 30 yrs
- 15 days/yr
Wind risk 6/10 · Moderate
- Chance of severe wind over 30 yrs
- 27.0%
Air-quality risk 4/10 · Minor
- Unhealthy air days now
- 5 days/yr
- Unhealthy air days in 30 yrs
- 6 days/yr
Risk factors via First Street. Map © Google.
Why this score? — see what drove the B+ grade
The composite is a weighted blend of 9 inputs, each scored 0–100. Each bar is that input's sub-score; the figure is the points it added to the 100-point composite (weight × sub-score).
- Cash flow +25.7/30.0
- ARV discount +15.0/15.0
- Appreciation +8.7/10.0
- DSCR +8.6/10.0
- 1% rule +7.3/10.0
- Schools +5.0/10.0
- Livability +3.8/5.0
- Rent growth +2.5/5.0
- Condition / age +2.5/5.0
$1,259,000
🖨 Deal sheet 📄 Offer letter ✓ Due diligence
Multi-family units
County records classify this as Multi-Family (5+ Unit). Listing-text estimate: 1 unit. estimate disagrees with records
5+ unit building — per-unit beds/baths from public records are typically unavailable; the breakdown below (if shown) is an estimate from the listing text.
Listing remarks
Six Dwelling property. Building Size:25x58. Prime location near the 7 train exceptional 6 units investment opportunity property. 3 Vacant units ready for immediate current market rents. 3 Occupied units providing steady rental income. Lot size 25x100 Building Size:25x58. 2 units with 2 bedrooms, 1 bath, and 4 units with 1 bedroom, 1 bath, kitchen and living room. ..
Key facts
- 3 vacant units
- 3 occupied units
- Steady rental income
Tags
Property features AI
Finance
- Financial info: Tax year 2025 (tax amount displayed in original data excluded per instructions)
Exterior
- Parking: No carport; Other parking features
- Utilities: Sewer: Other; Utilities: see remarks
- Home design: Quadruplex property; Total building area approximately 4350 (source: other)
- Construction: Brick construction
- Exterior features: Brick exterior; Not waterfront
Interior
- Heating & cooling: Natural gas heating; Additional heating details available in remarks; No cooling system
- Interior features: Additional interior details listed as 'Other'
Neighborhood map
What this means for you Summary
Snapshot
- This is a multifamily listed at $1.26M.
Deal economics
- At list price, monthly cash flow is $3k ($36k/yr) — positive.
- The deal already cash-flows at list — no discount required.
- Meets the 1% rule at list price ($15k rent vs $1.26M).
- Recommended offer: $1.24M (1.5% below list) — sets the bar for market timing.
- Cap rate 9.2% vs local median 2.6% in New York — top-decile yield for the area; either an underpriced asset or a hidden risk that comps aren't pricing in. Stress-test before assuming the spread holds.
Location & tenants
- Location reads 75/100 on livability (#268 in NY, #4,188 nationally) — a middle-class / working-renter tenant base. Strengths: amenities A+, commute A+, health & safety A; Watch: crime F, cost of living F.
- Market conditions: 243 active listings in the ZIP; 3 comparable units currently listed for rent nearby; rentals at typical pace (median 25d on market — plan ~3-4 weeks tenant-placement turnaround); 5,302 units permitted in Queens County in 2024 (4,918 in 5+ unit buildings).
- At $15,440/mo this rent would consume 256% of the median local household income ($72k/yr) (locally 6817% of renters already pay >50% of income on rent) — very limited rent-growth headroom before tenants either downsize or default.
Forward outlook
- In year one you build about $102k of equity ($9k loan paydown + $93k appreciation (7.4% local appreciation)).
- Queens County population projected at +16% by 2050 — long-run rental-demand tailwind backs the buy-and-hold thesis.
- At projected returns (7.4% appreciation + 3.0% rent growth), your $353k cash investment doubles in ~3 years — after that, you're playing with house money.
- By year 2, paydown + projected appreciation supports a ~$163k cash-out refi (75% LTV) — recoverable capital for the next deal without selling this one.
Negotiation context
- It's been on market 23 days — a 2% lower offer ($1.24M) is reasonable based on typical stale-listing flexibility.
- 6 sale attempts since 10y ago with the ask held roughly flat each time — persistent listings suggest the price (not the market) is what's stuck; bring a comps-based counter.
- Current owner paid $475k; list at $1.26M implies a 165% gain — meaningful room to come down on a strong offer.
Risks & watch-outs
- Climate carrying-cost: major wind risk, 27% chance of damaging wind over 30y; extreme-heat days projected 7→15/yr by 2055 (HVAC capex compounding) — expect insurance premiums to compound above CPI over the hold.
Questions for the listing agent
- Built in 1973 — when were the roof, HVAC, electrical panel, plumbing, and water heater last replaced?
- Is there a deadline driving the sale (1031 exchange, divorce, estate, relocation)? That informs how much negotiation room exists.
- Schools are B-rated — typically a magnet for longer-tenancy family renters. What's the average tenant stay here, and is there a school-zone premium baked into asking?
- Crime grade is F in this area — have there been break-ins, vandalism, or insurance claims at this property in the last 3 years? What carrier currently insures it and at what premium?
- What's the average days-on-market for RENTAL listings here right now (not sales)? A rising rental-DOM trend means longer vacancies and softer asking-rent achievability than the comps imply.
- What's the recent tenant-quality profile in this submarket — average credit score on applications, eviction rate, late-payment / NSF rate, and stable-employment percentage? A property-management company in the area should have these aggregated.
- How much new apartment / multifamily construction is in the pipeline within 1–3 miles? Heavy new supply (>2% of stock underway) typically softens rents 12–24 months out; light construction supports rent growth.
Investment metrics
- 1% rule
- 1.23% ✓
- Cap rate
- 9.16%
- Cash-on-cash
- 10.25%
- DSCR
- 1.46
- GRM
- 6.8
CMA / ARV
- ARV (on-the-fly)
- $1,905,300
- Comps found
- 2
Show comp detail 2 sales within ~0.75 mi
| Address | Dist | Beds/Ba | Sqft | Sold | Price | $/sf | Match |
|---|---|---|---|---|---|---|---|
| 50-41 103 St | 0.57mi | 9/5.0 | 3,975 (-9%) | 6mo | $1,300,000 | $327 | 54 |
| 108-73 53rd Ave | 0.52mi | 11/8.0 | 3,935 (-10%) | 12mo | $1,725,000 | $438 | 50 |
Match score weights: distance 35% · size 25% · config 20% · recency 20%. Top-matched comps best support the ARV.
Projected returns pro-forma
7.4% appreciation · 3.0% rent growth · sell at horizon
- IRR
- 26.7%
- Equity multiple
- 2.88×
- Total profit
- $663,005
- Equity at exit
- $905,541
- IRR
- 24.3%
- Equity multiple
- 6.06×
- Total profit
- $1,782,395
- Equity at exit
- $1,750,953
Cash invested: $352,520 (down + closing). Projections, not guarantees.
Landlord ↔ Tenant lean methodology
- Overall (CITY)
- 0 Strongly Tenant-Friendly
- State New York
- 15 Strongly Tenant-Friendly · D+10
- County
- — inherits STATE
- City New York
- 0 Strongly Tenant-Friendly · D+34
ZIP-level market 11368
- Home prices YoY
- 2.7%
- Active inventory
- 243
- Price-to-rent
- 38.0×
Monthly cashflow live
- Estimated rent
- $15,440 high interval (Pro) →
- Mortgage (P&I)
- −$6,602
- Tax from tax record
- −$2,060 /mo · $24,723/yr
- Insurance
- −$525
- HOA
- −$0
- Vacancy / Maint / Mgmt
- −$3,242
- Net cashflow
- $3,010
Break-even live
6-unit breakdown (identical units grouped — click to expand)
| Units | Beds | Baths | Est. rent |
|---|---|---|---|
| 2× units | 2 | 1 | $5,516 |
| #1 | 2 | 1 | $2,758 |
| #2 | 2 | 1 | $2,758 |
| 4× units | 1 | 1 | $9,924 |
| #3 | 1 | 1 | $2,481 |
| #4 | 1 | 1 | $2,481 |
| #5 | 1 | 1 | $2,481 |
| #6 | 1 | 1 | $2,481 |
| Total (6 units) | $15,440 | ||
UW: 25.0% down · 7.5% · 30yr · 1.5% tax · 5.0% vac · 8.0% maint · 8.0% mgmt
Financing live
Cash to close
- Down payment
- $314,750
- Closing costs
- $37,770
- Reserves months
- —
- Total cash needed
- —
Loan-product check · same deal, 3 products live
Conventional
25% down · 7.5% · 30yr
- Down + closing
- —
- Monthly P&I
- —
- Monthly cashflow
- —
- DSCR
- —
- Eligible?
- —
Personal DTI + credit; lowest rate.
DSCR
20% down · 8.5% · 30yr
- Down + closing
- —
- Monthly P&I
- —
- Monthly cashflow
- —
- DSCR
- —
- Eligible?
- —
No personal income docs; deal must DSCR.
Hard money
10% down · 12.0% · 12mo
- Down + closing
- —
- Monthly P&I
- —
- Monthly cashflow
- —
- DSCR
- —
- Eligible?
- —
Short-term bridge; refi at stabilization.
Rent comps 3 comps
| Address | Beds | Baths | Sqft | Rent | $/sqft | DOM | Units | Dist |
|---|---|---|---|---|---|---|---|---|
| 94-28 53rd Ave Unit 3 Elmhurst, NY | 3.0 | 2.0 | 3300 | $3,500 | $1.06 | 24d | 1 | 1.01mi |
| 33-30 89th St Unit 3 Flushing, NY | 3.0 | 1.0 | 3713 | $3,400 | $0.92 | 21d | 1 | 1.24mi |
| 9212 25th Ave East Elmhurst, NY | 2.0 | 1.0 | 5360 | $3,000 | $0.56 | 24d | 1 | 1.42mi |
Listing history 37 events
-
2026-06-18days on market $1,259,000 Active 23 DOM
-
2026-06-17days on market $1,259,000 Active 22 DOM
-
2026-06-16days on market $1,259,000 Active 21 DOM
-
2026-06-15days on market $1,259,000 Active 20 DOM
-
2026-06-13days on market $1,259,000 Active 18 DOM
-
2026-06-10days on market $1,259,000 Active 14 DOM
-
2026-06-08days on market $1,259,000 Active 13 DOM
-
2026-06-08days on market $1,259,000 Active 12 DOM
-
2026-06-04days on market $1,259,000 Active 9 DOM
-
2026-06-03days on market $1,259,000 Active 8 DOM
-
2026-06-02days on market $1,259,000 Active 7 DOM
-
2026-06-01days on market $1,259,000 Active 6 DOM
-
2026-05-31days on market $1,259,000 Active 5 DOM
-
2026-05-26$1,259,000 Active
-
2025-10-25price $995,000
-
2024-08-30historical
-
2024-05-28$1,298,000 Active
-
2024-04-30historical
-
2024-03-26price $1,399,000
-
2024-03-01price $13,909,000
-
2023-11-03$1,550,000 Active
-
2023-10-07historical
-
2023-07-10$1,190,000 Active
-
2022-04-06historical
-
2021-07-25price $1,059,000
-
2020-11-09$1,100,000 Active
-
2018-10-22soldstatus $475,000
-
2017-12-18historical
-
2017-05-09price $1,100,000
-
2017-05-09price $1,000,100
-
2017-04-19price $1,000,000
-
2017-01-17price $1,300,000
-
2016-10-17$1,400,000 New
-
1987-05-18soldstatus $268,000
-
1985-06-26soldstatus $225,000
-
1985-03-13soldstatus $225,000
-
1985-02-28soldstatus $145,000
ⓘ Source: listings_history table (triggers on properties + properties_extension) + one-shot
backfill from property_details.listing_events for pre-trigger history.
Tax reassessment forecast NY · Partial reset (capped growth)
- Current annual tax
- $24,723 · $2,060/mo
- Projected year-2 tax
- $24,723 · $2,060/mo
- Expected delta
- $0/yr ($0/mo · 0.0%)
ⓘ Screening estimate from a state-policy table — verify with the county assessor before closing.
Climate risk First Street
- Flood 1/10 Low FEMA zone X (unshaded) · 0% chance over 30 yrs
- Wildfire 1/10 Low
- Heat 6/10 Major 7 d/yr ≥99°F today · 15 d/yr by 30 yrs out
- Wind 6/10 Major 27% chance of damaging wind over 30 yrs
- Air quality 4/10 Moderate 5 unhealthy d/yr today · 6 by 30 yrs out
Nearby sold comps map
Loading sold comps map…
Walkable amenities ~0.75 mi
Loading nearby amenities…
Taxation est. · year 1
- Rental income
- $185,280
- − Mortgage interest
- −$70,524
- − Property taxes
- −$24,723
- − Insurance
- −$6,295
- − Repairs & maintenance
- −$14,822
- − Management
- −$14,822
- − Depreciation
- −$36,625
- Taxable income
- $17,468
- Est. tax owed @ 24.0%
- −$4,192
- After-tax cash flow
- $31,933/yr
For passive investors: Depreciation is non-cash, so a rental often shows a tax loss while cash-flowing — sheltering income. Rental losses are passive: they offset passive income freely, and up to $25,000/yr can offset ordinary (W-2) income if you actively participate and your MAGI is under $100k (phasing out to $0 by $150k); unused losses carry forward. On sale, claimed depreciation is recaptured at up to 25%, and gains may owe capital-gains tax (a 1031 exchange can defer both). Figures are a year-1 estimate at your 24.0% rate — not tax advice; consult a CPA.
Schools (NCES district)
No district data.
Livability — New York
- Score
- 75/100
- State rank
- #268
- US rank
- #4188
Category grades
Schools grade is shown separately in the Schools card above.
Census & demographics
- Census place
- New York, NY
- County
- Queens County · 1,914,869 people
- City population
- 7,731,280
- Metro
- New York-Newark-Jersey City, NY-NJ-PA
- Population (ZIP)
- 105,716
- Household income
- $72,270
- Rent vs Own
- Severe rent burden
- 6817.0
Population outlook (Queens County) Hauer SSP2
- Today (2025)
- 2,546,320 people
- By 2030
- 2,643,059 · +3.8%
- By 2040
- 2,815,563 · +10.6%
- By 2050
- 2,944,423 · +15.6%
- By 2075
- 3,123,338 · +22.7%
- By 2100
- 3,098,688 · +21.7%
Race, ethnicity, and origin ACS 2023
- Neighborhood character
- Predominantly Hispanic (75%)
- Race & ethnicity
- Hispanic / Latino 75% Two or more races 14% Asian 12% Black 8% White 4% Native American 1%
- Hispanic origin (detail)
- Mexican 20% Puerto Rican 2% Dominican 14%
- Foreign-born
- 60% · Canada, China, Jamaica
- Languages at home
- 15% English-only · Spanish 70% Chinese 6% Other Indo-European 3%
Political lean MEDSL · Queens
- 2024 margin
- Strong D (+24.6) · D 62.3% · R 37.7%
- 2008→2024 swing
- -26.2pp toward R · 2008: 50.8pp · 2024: 24.6pp
- All cycles
- 2024: D+24.6 2020: D+45.2 2016: D+53.4 2012: D+58.5 2008: D+50.8
Not yet ingested
- Civics
- —
Market trends
- HPI YoY
- ▲ 7.40%
- Current HPI
- 282.8276
- Rent YoY
- —
- Metro
- New York-Newark-Jersey City, NY-NJ-PA
- State GDP YoY
- ▲ 2.60%
- F500 in state
- 92
Industry mix (Fortune 500 HQ in NY)
| Industry | F500 HQs | Revenue |
|---|---|---|
| Financial Services | 10 | $950B |
|
||
| Consumer Goods | 9 | $162B |
|
||
| Insurance | 4 | $225B |
|
||
| Telecommunications | 2 | $144B |
|
||
| Pharmaceuticals | 2 | $112B |
|
||
| Media / Entertainment | 2 | $69B |
|
||
Price history
+768.3% since first listed24 events — show timeline
- 2026-05-26 Listed $1,259,000 OneKey® MLS as Distributed by MLS Grid
- 2025-10-25 Price Changed $995,000 FSBO.com
- 2024-08-30 Listing Removed — OneKey® MLS as Distributed by MLS Grid
- 2024-05-28 Listed $1,298,000 OneKey® MLS as Distributed by MLS Grid
- 2024-04-30 Listing Removed — OneKey® MLS as Distributed by MLS Grid
- 2024-03-26 Price Changed $1,399,000 OneKey® MLS as Distributed by MLS Grid
- 2024-03-01 Price Changed $13,909,000 OneKey® MLS as Distributed by MLS Grid
- 2023-11-03 Listed $1,550,000 OneKey® MLS as Distributed by MLS Grid
- 2023-10-07 Listing Removed — OneKey® MLS as Distributed by MLS Grid
- 2023-07-10 Listed $1,190,000 OneKey® MLS as Distributed by MLS Grid
- 2022-04-06 Listing Removed — OneKey® MLS as Distributed by MLS Grid
- 2021-07-25 Price Changed $1,059,000 OneKey® MLS as Distributed by MLS Grid
- 2020-11-09 Listed $1,100,000 OneKey® MLS as Distributed by MLS Grid
- 2018-10-22 Sold (Public Records) $475,000 Public Records
- 2017-12-18 Listing Removed — OneKey® MLS as Distributed by MLS Grid
- 2017-05-09 Price Changed $1,100,000 OneKey® MLS as Distributed by MLS Grid
- 2017-05-09 Price Changed $1,000,100 OneKey® MLS as Distributed by MLS Grid
- 2017-04-19 Price Changed $1,000,000 OneKey® MLS as Distributed by MLS Grid
- 2017-01-17 Price Changed $1,300,000 OneKey® MLS as Distributed by MLS Grid
- 2016-10-17 Listed $1,400,000 OneKey® MLS as Distributed by MLS Grid
- 1987-05-18 Sold (Public Records) $268,000 Public Records
- 1985-06-26 Sold (Public Records) $225,000 Public Records
- 1985-03-13 Sold (Public Records) $225,000 Public Records
- 1985-02-28 Sold (Public Records) $145,000 Public Records
Property tax history
+2.5%/yrLatest (2025): $24,723 · -39.9% YoY. Source: county tax records.
Cash-flow waterfall
monthlySold comps — $/sqft
last 12 mo · ≤1 miLoading sold comps…