 Fourplex
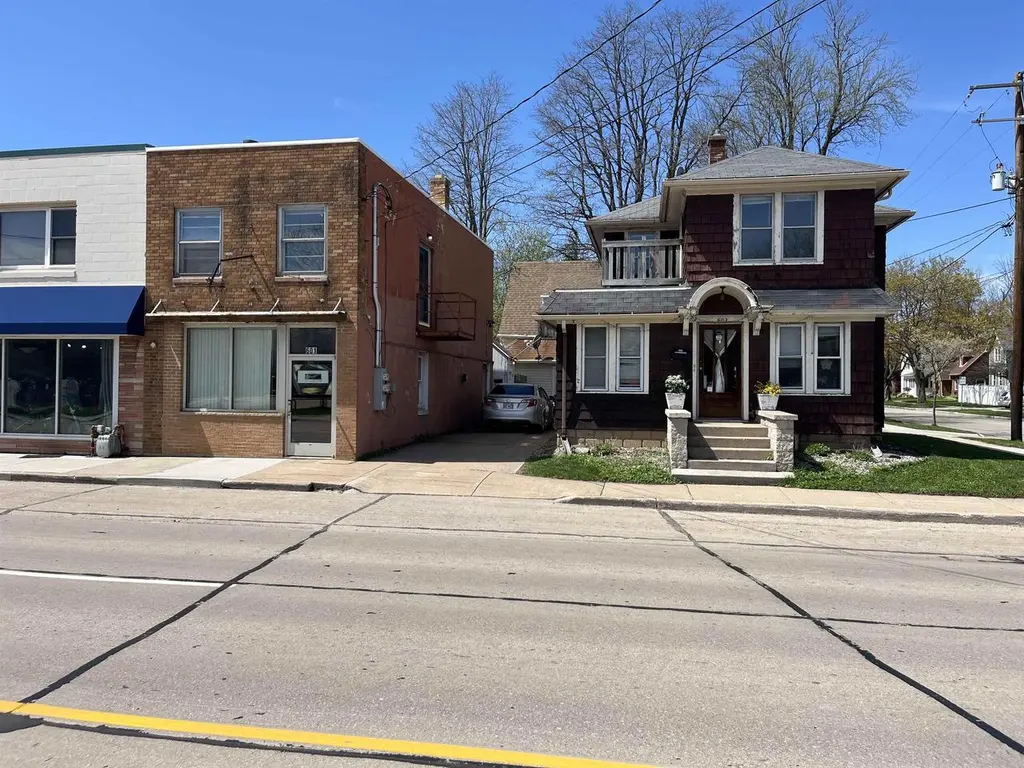
603 N Richmond St · Appleton, WI
Flood risk No data
- FEMA flood zone
- —
- Chance of flooding over 30 yrs
- —
- Est. flood insurance / yr
- —
Fire risk No data
- Est. fire insurance / yr
- —
Heat risk No data
- Hot days now (above threshold)
- —
- Hot days in 30 yrs
- —
Wind risk No data
- Chance of severe wind over 30 yrs
- —
Air-quality risk No data
- Unhealthy air days now
- —
- Unhealthy air days in 30 yrs
- —
Risk factors via First Street. Map © Google.
Why this score? — see what drove the B- grade
The composite is a weighted blend of 9 inputs, each scored 0–100. Each bar is that input's sub-score; the figure is the points it added to the 100-point composite (weight × sub-score).
- Cash flow +30.0/30.0
- 1% rule +10.0/10.0
- DSCR +10.0/10.0
- ARV discount +7.5/15.0
- Livability +4.1/5.0
- Schools +3.0/10.0
- Rent growth +2.7/5.0
- Condition / age +2.5/5.0
- Appreciation +0.0/10.0
$359,900
🖨 Deal sheet (PDF) 📄 Offer letter ✓ Due diligence
Multi-family units
County records classify this as Multi-Family (2-4 Unit). Listing-text estimate: 4 units. confirmed
Listing remarks
Fully occupied mixed-use 4-unit investment property generating $3,768/month ($45,216 annualized). Diverse unit mix includes three residential units and one commercial space, providing stable, consistent income. The commercial unit is roughly 800 square feet bringing the total square footage to 2808. Strong rental history with clean, well-maintained interiors and opportunity for future rent upside. High-visibility location with convenient access to local amenities. Financials, rent roll, and lease documents available upon request. All measurements are approximate and not guaranteed; buyer to verify all dimensions.
Key facts
- One commercial space
- 0.4 acre lot
- Built 1954
Tags
Property features AI
Finance
- Other: Owner listed as source for year-built information
- Financial info: Total of 3 units in the building
Exterior
- Parking: No on-site parking
- Utilities: Municipal water; Municipal sewer
- Home design: Multi-family property; Building style: 2-story / bi-level; Estimated total living area in the 2,001–2,500 sq ft range
- Construction: Block basement
- Exterior features: Wood exterior; Lot size about 0.4 acre (< 1/2 acre); Zoned for multi-family (4 units)
Interior
- Kitchen: Unit 2 kitchen approx. 10 x 11
- Bedrooms: Unit 1: 2 bedrooms; Unit 2: 2 bedrooms (primary 11 x 12; second bedroom 8 x 11); Unit 3: number of bedrooms not specified
- Bathrooms: Unit 1: 1 full bath; Unit 2: 1 full bath; Unit 3: 1 full bath
- Heating & cooling: Forced air heating; Natural gas fuel
- Interior features: Basement is block construction (no finished below-grade space)
Neighborhood map
What this means for you Summary
Snapshot
- This is a 4 × 4-bed/3.0-bath units multifamily listed at $360k.
Deal economics
- At list price, monthly cash flow is $3k ($31k/yr) — positive. Per door: $653/mo.
- The deal already cash-flows at list — no discount required.
- Meets the 1% rule at list price ($6k rent vs $360k).
- Recommended offer: $349k (3.0% below list) — sets the bar for market timing.
- Cap rate 15.0% vs local median 3.8% in Appleton — top-decile yield for the area; either an underpriced asset or a hidden risk that comps aren't pricing in. Stress-test before assuming the spread holds.
Location & tenants
- Location reads 82/100 on livability (#44 in WI, #1,073 nationally) — a professional / high-income tenant draw. Strengths: commute A+, cost of living A+, housing A+; Watch: amenities C-.
- Appleton Area School District (urban): math 33% / reading 36% proficiency, ranked #224 of 342 in WI (top 66%) — families likely to look elsewhere, expect single-tenant / working-renter base with shorter leases.
- Market conditions: Rents flat; 32 active listings in the ZIP; 460 units permitted in Outagamie County in 2024 (30 in 5+ unit buildings).
- At $6,455/mo this rent would consume 116% of the median local household income ($67k/yr) (locally 876% of renters already pay >50% of income on rent) — very limited rent-growth headroom before tenants either downsize or default.
Forward outlook
- Local home prices are declining (-3.0%/yr); year-one equity from $2k of loan paydown is wiped out by about $11k of value loss. Plan a longer hold.
- Outagamie County population projected at +8% by 2050 — modest demand growth; plan on rents tracking national, not racing it.
- At projected returns (-3.0% appreciation + 0.7% rent growth), your $101k cash investment doubles in ~5 years — after that, you're playing with house money.
Negotiation context
- It's been on market 43 days — a 3% lower offer ($349k) is reasonable based on typical stale-listing flexibility.
Risks & watch-outs
- Watch-outs: built in 1954 — expect roof / HVAC / electrical / plumbing capex.
Questions for the listing agent
- It's been on market 43 days. Have you received any prior offers? Is the seller open to a 3% concession, seller financing, or rate buy-down credit?
- Can we see the unit-by-unit rent roll, current vacancy, and any below-market leases? What's the average tenancy length?
- What capital expenditures (roof, boiler, parking lot, exteriors) have been made in the last 5 years, and what's planned in the next 2?
- Built in 1954 — when were the roof, HVAC, electrical panel, plumbing, and water heater last replaced?
- Is there a deadline driving the sale (1031 exchange, divorce, estate, relocation)? That informs how much negotiation room exists.
- What's the average days-on-market for RENTAL listings here right now (not sales)? A rising rental-DOM trend means longer vacancies and softer asking-rent achievability than the comps imply.
- What's the recent tenant-quality profile in this submarket — average credit score on applications, eviction rate, late-payment / NSF rate, and stable-employment percentage? A property-management company in the area should have these aggregated.
- How much new apartment / multifamily construction is in the pipeline within 1–3 miles? Heavy new supply (>2% of stock underway) typically softens rents 12–24 months out; light construction supports rent growth.
Investment metrics
- 1% rule
- 1.79% ✓
- Cap rate
- 15.00%
- Cash-on-cash
- 31.11%
- DSCR
- 2.38
- GRM
- 4.6
CMA / ARV
- ARV (median comp)
- $220,624
- List price
- $359,900
- Delta
- 63.13%
- Verdict
- OVERPRICED
- Comps
- 20 within 1.0 mi
Projected returns pro-forma
-3.0% appreciation · 0.67% rent growth · sell at horizon
- IRR
- 23.3%
- Equity multiple
- 1.93×
- Total profit
- $93,365
- Equity at exit
- $53,662
- IRR
- 29.7%
- Equity multiple
- 3.36×
- Total profit
- $238,014
- Equity at exit
- $31,118
Cash invested: $100,772 (down + closing). Projections, not guarantees.
Landlord ↔ Tenant lean methodology
- Overall (STATE)
- 73 Landlord-Friendly
- State Wisconsin
- 73 Landlord-Friendly · R+2
- County
- — inherits STATE
- City
- — inherits STATE
ZIP-level market 54911
- Rents YoY
- 0.7%
- Active inventory
- 32
- Price-to-rent
- 18.6×
Monthly cashflow live
- Estimated rent
- $6,455 medium interval (Pro) →
- Mortgage (P&I)
- −$1,887
- Tax est. 1.5%
- −$450 /mo · $5,398/yr
- Insurance
- −$150
- HOA
- −$0
- Vacancy / Maint / Mgmt
- −$1,356
- Net cashflow
- $2,612
Break-even live
Sensitivity live
| Price | -10% $2,861 | -5% $2,737 | +0% $2,612 | +5% $2,488 | +10% $2,364 |
|---|---|---|---|---|---|
| Rent | -10% $2,102 | -5% $2,357 | +0% $2,612 | +5% $2,867 | +10% $3,122 |
| Rate | -1.0pp $2,794 | -0.5pp $2,704 | base $2,612 | +0.5pp $2,519 | +1.0pp $2,424 |
4-unit breakdown (identical units grouped — click to expand)
| Units | Beds | Baths | Est. rent |
|---|---|---|---|
| 4× units | 4 | 3 | $6,456 |
| #1 | 4 | 3 | $1,614 |
| #2 | 4 | 3 | $1,614 |
| #3 | 4 | 3 | $1,614 |
| #4 | 4 | 3 | $1,614 |
| Total (4 units) | $6,455 | ||
UW: 25.0% down · 7.5% · 30yr · 1.5% tax · 5.0% vac · 8.0% maint · 8.0% mgmt
Financing live
Cash to close
- Down payment
- $89,975
- Closing costs
- $10,797
- Reserves months
- —
- Total cash needed
- —
Loan-product check · same deal, 3 products live
Conventional
25% down · 7.5% · 30yr
- Down + closing
- —
- Monthly P&I
- —
- Monthly cashflow
- —
- DSCR
- —
- Eligible?
- —
Personal DTI + credit; lowest rate.
DSCR
20% down · 8.5% · 30yr
- Down + closing
- —
- Monthly P&I
- —
- Monthly cashflow
- —
- DSCR
- —
- Eligible?
- —
No personal income docs; deal must DSCR.
Hard money
10% down · 12.0% · 12mo
- Down + closing
- —
- Monthly P&I
- —
- Monthly cashflow
- —
- DSCR
- —
- Eligible?
- —
Short-term bridge; refi at stabilization.
Listing history 18 events
-
2026-06-19days on market $359,900 Active 43 DOM
-
2026-06-18days on market $359,900 Active 42 DOM
-
2026-06-17days on market $359,900 Active 41 DOM
-
2026-06-16days on market $359,900 Active 40 DOM
-
2026-06-15days on market $359,900 Active 39 DOM
-
2026-06-14days on market $359,900 Active 37 DOM
-
2026-06-13days on market $359,900 Active 36 DOM
-
2026-06-10days on market $359,900 Active 34 DOM
-
2026-06-09days on market $359,900 Active 33 DOM
-
2026-06-08days on market $359,900 Active 32 DOM
-
2026-06-07days on market $359,900 Active 31 DOM
-
2026-06-05days on market $359,900 Active 28 DOM
-
2026-06-03days on market $359,900 Active 27 DOM
-
2026-06-02days on market $359,900 Active 26 DOM
-
2026-06-01days on market $359,900 Active 25 DOM
-
2026-05-31days on market $359,900 Active 24 DOM
-
2026-05-30days on market $359,900 Active 23 DOM
-
2026-05-06$359,900 Active 620-char remark
ⓘ Source: listings_history table (triggers on properties + properties_extension) + one-shot
backfill from property_details.listing_events for pre-trigger history.
Nearby sold comps map
Loading sold comps map…
Walkable amenities ~0.75 mi
Loading nearby amenities…
Taxation est. · year 1
- Rental income
- $77,460
- − Mortgage interest
- −$20,160
- − Property taxes
- −$5,398
- − Insurance
- −$1,800
- − Repairs & maintenance
- −$6,197
- − Management
- −$6,197
- − Depreciation
- −$10,470
- Taxable income
- $27,239
- Est. tax owed @ 24.0%
- −$6,537
- After-tax cash flow
- $24,810/yr
For passive investors: Depreciation is non-cash, so a rental often shows a tax loss while cash-flowing — sheltering income. Rental losses are passive: they offset passive income freely, and up to $25,000/yr can offset ordinary (W-2) income if you actively participate and your MAGI is under $100k (phasing out to $0 by $150k); unused losses carry forward. On sale, claimed depreciation is recaptured at up to 25%, and gains may owe capital-gains tax (a 1031 exchange can defer both). Figures are a year-1 estimate at your 24.0% rate — not tax advice; consult a CPA.
Schools (NCES district)
- District
- Appleton Area School District
- NCES district ID
- 5500390
- Math proficiency
- 33% ▼ -6.00%
- Reading proficiency
- 36% ▼ -1.00%
- Median HH income
- $53,892
- Composite
- 30.3/100
- National rank
- #6279
- State rank
- #224 of 342 in WI
Livability — Appleton
- Score
- 82/100
- State rank
- #44
- US rank
- #1073
Category grades
Schools grade is shown separately in the Schools card above.
Census & demographics
- Census place
- Appleton, WI
- County
- Outagamie County · 155,051 people
- City population
- 126,671
- Metro
- Appleton, WI
- Population (ZIP)
- 25,308
- Household income
- $67,001
- Rent vs Own
- Severe rent burden
- 876.0
Population outlook (Outagamie County) Hauer SSP2
- Today (2025)
- 195,863 people
- By 2030
- 201,154 · +2.7%
- By 2040
- 209,053 · +6.7%
- By 2050
- 211,957 · +8.2%
- By 2075
- 214,299 · +9.4%
- By 2100
- 200,825 · +2.5%
Race, ethnicity, and origin ACS 2023
- Neighborhood character
- Predominantly White (82%)
- Race & ethnicity
- White 82% Hispanic / Latino 7% Two or more races 6% Asian 6% Black 2%
- Hispanic origin (detail)
- Mexican 4% Puerto Rican 1%
- Common ancestry
- Romanian 9% Iranian 5% Portuguese 4%
- Foreign-born
- 6% · Canada, China, Vietnam
- Languages at home
- 90% English-only · Other Asian/Pacific 4% Spanish 3% Chinese 1%
Political lean MEDSL · Outagamie
- 2024 margin
- R (+10.2) · D 44.2% · R 54.4% · Other 1.5%
- 2008→2024 swing
- -21.8pp toward R · 2008: 11.6pp · 2024: -10.2pp
- All cycles
- 2024: R+10.2 2020: R+9.9 2016: R+12.6 2012: R+1.8 2008: D+11.6
Not yet ingested
- Civics
- —
Market trends
- HPI YoY
- ▼ -237.96%
- Current HPI
- 218.9027
- Rent YoY
- ▲ 0.67%
- Metro
- Appleton, WI
- State GDP YoY
- ▲ 2.10%
- F500 in state
- 20
Industry mix (Fortune 500 HQ in WI)
| Industry | F500 HQs | Revenue |
|---|---|---|
| Industrial Machinery | 4 | $23B |
|
||
| Industrial Technology | 2 | $36B |
|
||
| Insurance | 1 | $36B |
|
||
| Professional Services | 1 | $19B |
|
||
| Utilities | 1 | $9B |
|
||
| Consumer Goods | 1 | $3B |
|
||
Price history
1 event — show timeline
- 2026-05-06 Listed $359,900 RANW
Cash-flow waterfall
monthlySold comps — $/sqft
last 12 mo · ≤1 miLoading sold comps…