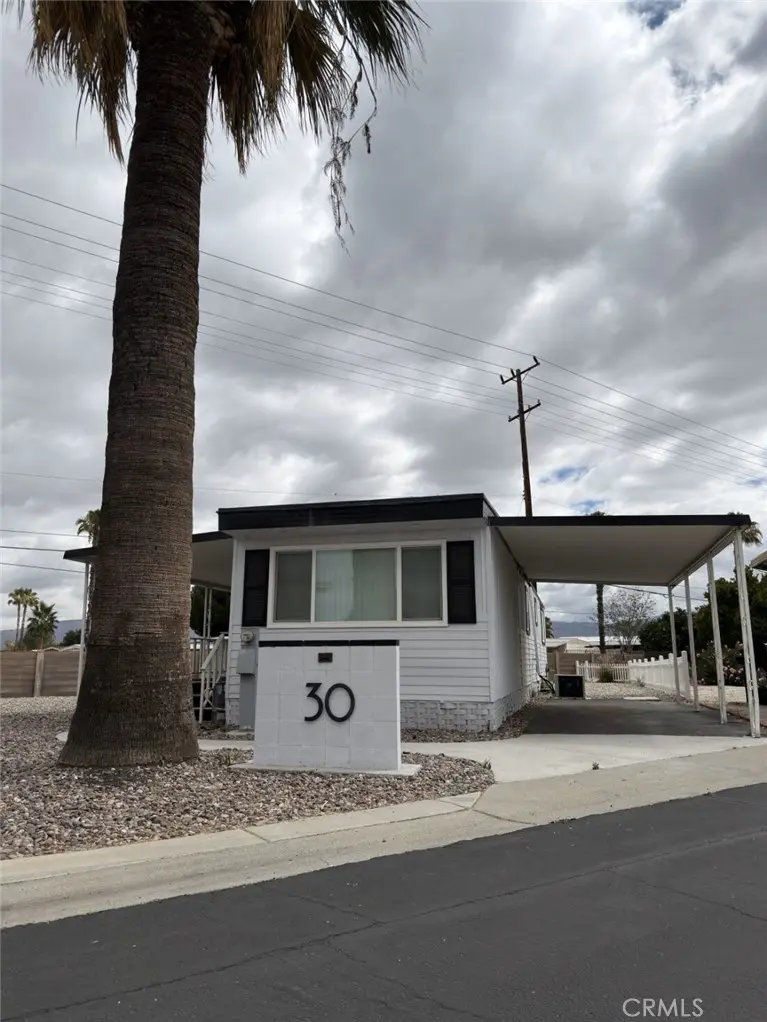
260 N Lyon Ave. Space 30 · Hemet, CA
Flood risk 1/10 · Minimal
- FEMA flood zone
- X (unshaded)
- Chance of flooding over 30 yrs
- 0.0%
- Est. flood insurance / yr
- $507 – $1,088
Fire risk 1/10 · Minimal
- Est. fire insurance / yr
- $659 – $1,223
Heat risk 7/10 · Major
- Hot days now (above 104°F)
- 6 days/yr
- Hot days in 30 yrs
- 16 days/yr
Wind risk 1/10 · Minimal
- Chance of severe wind over 30 yrs
- —
Air-quality risk 6/10 · Moderate
- Unhealthy air days now
- 12 days/yr
- Unhealthy air days in 30 yrs
- 14 days/yr
Risk factors via First Street. Map © Google.
Why this score? — see what drove the B- grade
The composite is a weighted blend of 9 inputs, each scored 0–100. Each bar is that input's sub-score; the figure is the points it added to the 100-point composite (weight × sub-score).
- Cash flow +30.0/30.0
- 1% rule +10.0/10.0
- DSCR +10.0/10.0
- ARV discount +7.5/15.0
- Condition / age +4.0/5.0
- Rent growth +2.9/5.0
- Livability +2.6/5.0
- Schools +2.5/10.0
- Appreciation +0.0/10.0
$57,000
🖨 Deal sheet (PDF) 📄 Offer letter ✓ Due diligence
Listing remarks MLS
SELLER FINANCING Available! 55+ community! Presenting a move-in-ready 1 bedroom, 1 bathroom, single wide home of living space and large land space, located at Space 30. Completely renovated, this home is freshly painted, with stylish wood laminate flooring, and a brand-new kitchen complete with modern cabinets, countertops, a sink, and stainless steel appliances (refrigerator, stove/oven). The design allows for easy entrance from both the carport and a spacious porch. Inside, you'll find a spacious layout that includes a large living and dining area, a comfortable spacious bedroom, and a spacious bathroom, shower, and ample closet space. laundry room in the shed. The community offers a wealth of amenities, such as a large, air-conditioned clubhouse with a banquet room, kitchen, heated pool, indoor jacuzzi, billiards and TV lounge, a small gym, laundry facilities, and security patrols three times nightly. Owned and operated by the same family since 1966, this community is well-maintained, peaceful, ideally located near shopping areas, and worth a look. Don't miss out on this gem!
Key facts
- Renovated home
- Open-concept kitchen
- Large covered patio
Tags
Property features AI
Finance
- Other: Access via city streets; paved road frontage; Directions: From Florida Ave head north on Lyon Ave, then right into park
- HOA & community: Senior community; Street lighting; Park name: Devonshire Downs Mobile Home Park; Rent includes pool; Monthly land lease ($860) paid to park
Exterior
- Parking: Covered, paved off-street parking; Attached carport (1 space)
- Security: Property provides 2+ access exits and parking accessibility
- Utilities: Natural gas connected; Electricity connected (standard); Water connected (district/public); Public sewer
- Home design: Single-story; Mobile home model Hillcrest (12' x 57'); Entry on Lyon Ave; Faces southwest; Turnkey condition
- Construction: Pier jacks foundation; Mobile home remains on site
- Exterior features: Porch, patio, and deck; Awning; Community pool; Has view; 0-1 Unit/Acre lot character
Interior
- Kitchen: Remodeled kitchen open to family room; Gas range and gas oven; Range/stove hood; Microwave; Refrigerator; Gas water heater
- Bedrooms: All bedrooms on ground level
- Flooring: Vinyl flooring
- Bathrooms: One full bathroom with walk-in shower (remodeled)
- Heating & cooling: Ductless heating; Ductless cooling
- Interior features: Beamed ceilings; Sliding glass door(s)
- Laundry & utility: Community laundry
Neighborhood map
What this means for you Summary
Snapshot
- This is a 1-bed/1.0-bath manufactured listed at $57k. Condition is rated good.
Deal economics
- At list price, monthly cash flow is $792 ($10k/yr) — positive.
- The deal already cash-flows at list — no discount required.
- Meets the 1% rule at list price ($2k rent vs $57k).
- Cap rate 23.0% vs local median 4.9% in Hemet — top-decile yield for the area; either an underpriced asset or a hidden risk that comps aren't pricing in. Stress-test before assuming the spread holds.
Location & tenants
- Location reads 51/100 on livability (#1,056 in CA) — a working-class tenant base; expect higher turnover. Strengths: housing A+; Watch: crime D+, schools F, amenities F.
- Hemet Unified (suburban): math 19% / reading 41% proficiency, ranked #360 of 517 in CA (top 70%) — families likely to look elsewhere, expect single-tenant / working-renter base with shorter leases; 66% free/reduced lunch — lower-income household profile, screen leases tightly.
- Market conditions: Rents rising (+1.8%/yr); 264 active listings in the ZIP; 20 comparable units currently listed for rent nearby; rentals leasing fast (median 9d on market — plan ~1-2 weeks tenant-placement turnaround); 9,195 units permitted in Riverside County in 2024 (1,512 in 5+ unit buildings).
- This rent runs 36% of the median local income ($49k/yr) — at the standard rent-burdened threshold; future hikes will face affordability resistance.
Forward outlook
- Local home prices are declining (-3.0%/yr); year-one equity from $394 of loan paydown is wiped out by about $2k of value loss. Plan a longer hold.
- Riverside County population projected at +22% by 2050 — long-run rental-demand tailwind backs the buy-and-hold thesis.
- At projected returns (-3.0% appreciation + 1.8% rent growth), your $16k cash investment doubles in ~2 years — after that, you're playing with house money.
Negotiation context
- Only 10 days on market — expect competitive offers; lowballing is unlikely to land.
- 2 sale attempts since 2y ago with the ask held roughly flat each time — persistent listings suggest the price (not the market) is what's stuck; bring a comps-based counter.
- Current owner paid $49k; 16% above their basis — modest negotiation headroom, anchor on the comps not their cost.
Risks & watch-outs
- Climate carrying-cost: extreme-heat days projected 6→16/yr by 2055 (HVAC capex compounding) — expect insurance premiums to compound above CPI over the hold.
Questions for the listing agent
- Built in 1964 — when were the roof, HVAC, electrical panel, plumbing, and water heater last replaced?
- Is there a deadline driving the sale (1031 exchange, divorce, estate, relocation)? That informs how much negotiation room exists.
- Schools are F-rated, which usually means shorter tenancies and higher turnover. Who's the typical renter profile here, and what's been the actual vacancy rate?
- Crime grade is D in this area — have there been break-ins, vandalism, or insurance claims at this property in the last 3 years? What carrier currently insures it and at what premium?
- What's the average days-on-market for RENTAL listings here right now (not sales)? A rising rental-DOM trend means longer vacancies and softer asking-rent achievability than the comps imply.
- What's the recent tenant-quality profile in this submarket — average credit score on applications, eviction rate, late-payment / NSF rate, and stable-employment percentage? A property-management company in the area should have these aggregated.
- How much new for-sale + rental construction is in the pipeline within 1–3 miles? Heavy new supply typically softens prices + rents 12–24 months out; constrained supply supports both.
Investment metrics
- 1% rule
- 2.63% ✓
- Cap rate
- 22.97%
- Cash-on-cash
- 59.55%
- DSCR
- 3.65
- GRM
- 3.2
CMA / ARV
- ARV (on-the-fly)
- $31,464
- Comps found
- 5
Show comp detail 5 sales within ~0.75 mi
| Address | Dist | Beds/Ba | Sqft | Sold | Price | $/sf | Match |
|---|---|---|---|---|---|---|---|
| 1895 W Devonshire Ave #135 | 0.30mi | 2/1.0 (+1) | 696 (+2%) | 5mo | $26,000 | $37 | 74 |
| 332 N Lyon Ave #29 | 0.11mi | 1/1.0 | 636 (-7%) | 23mo | $27,000 | $42 | 64 |
| 260 N Lyon Ave #118 | 0.09mi | 1/1.0 | 600 (-12%) | 14mo | $35,000 | $58 | 63 |
| 601 N Kirby St #108 | 0.73mi | 2/1.0 (+1) | 720 (+5%) | 6mo | $33,000 | $46 | 47 |
| 609 Imperial Way | 0.73mi | 2/1.0 (+1) | 600 (-12%) | 18mo | $264,500 | $441 | 26 |
Match score weights: distance 35% · size 25% · config 20% · recency 20%. Top-matched comps best support the ARV.
Projected returns pro-forma
-3.0% appreciation · 1.76% rent growth · sell at horizon
- IRR
- 56.8%
- Equity multiple
- 3.47×
- Total profit
- $39,382
- Equity at exit
- $8,499
- IRR
- 61.3%
- Equity multiple
- 6.76×
- Total profit
- $91,937
- Equity at exit
- $4,928
Cash invested: $15,960 (down + closing). Projections, not guarantees.
Landlord ↔ Tenant lean methodology
- Overall (STATE)
- 18 Strongly Tenant-Friendly
- State California
- 18 Strongly Tenant-Friendly · D+13
- County
- — inherits STATE
- City
- — inherits STATE
ZIP-level market 92543
- Home prices YoY
- -26.7%
- Rents YoY
- 1.8%
- Active inventory
- 264
- Price-to-rent
- 3.2×
Monthly cashflow live
- Estimated rent
- $1,501 high interval (Pro) →
- Mortgage (P&I)
- −$299
- Tax est. 1.5%
- −$71 /mo · $855/yr
- Insurance
- −$24
- HOA
- −$0
- Vacancy / Maint / Mgmt
- −$315
- Net cashflow
- $792
Break-even live
Sensitivity live
| Price | -10% $831 | -5% $812 | +0% $792 | +5% $772 | +10% $753 |
|---|---|---|---|---|---|
| Rent | -10% $673 | -5% $733 | +0% $792 | +5% $851 | +10% $911 |
| Rate | -1.0pp $821 | -0.5pp $807 | base $792 | +0.5pp $777 | +1.0pp $762 |
UW: 25.0% down · 7.5% · 30yr · 1.5% tax · 5.0% vac · 8.0% maint · 8.0% mgmt
Financing live
Cash to close
- Down payment
- $14,250
- Closing costs
- $1,710
- Reserves months
- —
- Total cash needed
- —
Loan-product check · same deal, 3 products live
Conventional
25% down · 7.5% · 30yr
- Down + closing
- —
- Monthly P&I
- —
- Monthly cashflow
- —
- DSCR
- —
- Eligible?
- —
Personal DTI + credit; lowest rate.
DSCR
20% down · 8.5% · 30yr
- Down + closing
- —
- Monthly P&I
- —
- Monthly cashflow
- —
- DSCR
- —
- Eligible?
- —
No personal income docs; deal must DSCR.
Hard money
10% down · 12.0% · 12mo
- Down + closing
- —
- Monthly P&I
- —
- Monthly cashflow
- —
- DSCR
- —
- Eligible?
- —
Short-term bridge; refi at stabilization.
Rent comps 20 comps
| Address | Beds | Baths | Sqft | Rent | $/sqft | DOM | Units | Dist |
|---|---|---|---|---|---|---|---|---|
| 201 N Valley View Dr Hemet, CA | 1.0 | 1.0 | 552 | $1,500 | $2.72 | 44d | 1 | 0.26mi |
| 2098 W Acacia Ave Hemet, CA | 1.0–3.0 | 1.0–2.0 | 895 | $1,595 | $1.78 | 0d | 1 | 0.56mi |
| 2770 W Devonshire Ave Hemet, CA | 1.0–2.0 | 1.0–2.0 | 707 | $1,625 | $2.30 | 0d | 10 | 0.73mi |
| 233 N Alessandro St Hemet, CA | 1.0 | 1.0 | 690 | $1,400 | $2.03 | 44d | 1 | 0.80mi |
| 199 N Inez St Apt D Hemet, CA | 1.0 | 1.0 | 650 | $1,300 | $2.00 | 0d | 1 | 0.87mi |
| 199 N Inez St Apt D Hemet, CA | 1.0 | 1.0 | 650 | $1,300 | $2.00 | 8d | 1 | 0.87mi |
| 3030 W Acacia Ave Hemet, CA | 1.0–2.0 | 1.0–2.0 | 807 | $1,590 | $1.97 | 0d | 8 | 0.97mi |
| 113 E Kimball Ave Unit 2 Hemet, CA | 2.0 | 1.0 | 500 | $1,295 | $2.59 | 44d | 1 | 1.04mi |
| 426 N Buena Vista St Hemet, CA | 2.0 | 1.0 | 680 | $1,550 | $2.28 | 4d | 1 | 1.22mi |
| 426 N Buena Vista St Apt 1 Hemet, CA | 2.0 | 1.0 | 680 | $1,550 | $2.28 | 8d | 1 | 1.22mi |
| 560 E Oakland Ave Apt P Hemet, CA | 1.0 | 1.0 | 550 | $1,325 | $2.41 | 17d | 1 | 1.26mi |
| 526 Greystone Ln Hemet, CA | 2.0 | 1.0 | 700 | $1,600 | $2.29 | 18d | 1 | 1.27mi |
| 526 Greystone Ln Apt 3 Hemet, CA | 2.0 | 1.0 | 700 | $1,650 | $2.36 | 44d | 1 | 1.27mi |
| 526 Greystone Ln Hemet, CA | 2.0 | 1.0 | 700 | $1,600 | $2.29 | 44d | 1 | 1.27mi |
| 1074 W Johnston Ave Hemet, CA | 2.0 | 1.0 | 460 | $1,500 | $3.26 | 0d | 1 | 1.27mi |
| 893 S Palm Ave Hemet, CA | 2.0 | 2.0 | 720 | $1,375 | $1.91 | 5d | 1 | 1.30mi |
| 3800 W Devonshire Ave Hemet, CA | 3.0 | 1.0–2.0 | 816 | $2,008 | $2.46 | 0d | 8 | 1.38mi |
| 811 E Menlo Ave Apt 12 Hemet, CA | 1.0 | 1.0 | 550 | $1,300 | $2.36 | 25d | 1 | 1.45mi |
| 811 E Menlo Ave Unit 02 Hemet, CA | 1.0 | 1.0 | 550 | $1,300 | $2.36 | 44d | 1 | 1.45mi |
| 210 N Santa Fe St Hemet, CA | 1.0 | 1.0 | 600 | $1,300 | $2.17 | 4d | 1 | 1.46mi |
Listing history 7 events
-
2026-06-18days on market $57,000 Active 10 DOM
-
2026-06-17days on market $57,000 Active 9 DOM
-
2026-06-16days on market $57,000 Active 8 DOM
-
2026-06-15days on market $57,000 Active 7 DOM
-
2026-06-13days on market $57,000 Active 5 DOM
-
2026-06-09remarks 699-char remark
-
2026-06-09$57,000 Active 1 DOM
ⓘ Source: listings_history table (triggers on properties + properties_extension) + one-shot
backfill from property_details.listing_events for pre-trigger history.
Climate risk First Street
- Flood 1/10 Low FEMA zone X (unshaded) · 0% chance over 30 yrs
- Wildfire 1/10 Low
- Heat 7/10 Severe 6 d/yr ≥104°F today · 16 d/yr by 30 yrs out
- Wind 1/10 Low
- Air quality 6/10 Major 12 unhealthy d/yr today · 14 by 30 yrs out
Nearby sold comps map
Loading sold comps map…
Walkable amenities ~0.75 mi
Loading nearby amenities…
Taxation est. · year 1
- Rental income
- $18,015
- − Mortgage interest
- −$3,193
- − Property taxes
- −$855
- − Insurance
- −$285
- − Repairs & maintenance
- −$1,441
- − Management
- −$1,441
- − Depreciation
- −$1,658
- Taxable income
- $9,141
- Est. tax owed @ 24.0%
- −$2,194
- After-tax cash flow
- $7,311/yr
For passive investors: Depreciation is non-cash, so a rental often shows a tax loss while cash-flowing — sheltering income. Rental losses are passive: they offset passive income freely, and up to $25,000/yr can offset ordinary (W-2) income if you actively participate and your MAGI is under $100k (phasing out to $0 by $150k); unused losses carry forward. On sale, claimed depreciation is recaptured at up to 25%, and gains may owe capital-gains tax (a 1031 exchange can defer both). Figures are a year-1 estimate at your 24.0% rate — not tax advice; consult a CPA.
Condition & rehab AI · 13 photos
This move-in-ready 1-bedroom, 1-bath home in the popular Devonshire Downs 55+ community has been updated with fresh paint, wood-look laminate flooring, and a modern kitchen. It is in good condition and ready for immediate occupancy.
Value-add opportunities
- Both paint exterior — enhances curb appeal and resale value
- Both trim landscaping — improves curb appeal and rental value
Renovation cost estimate screening
Value-add ROI direction
- Both paint exterior — enhances curb appeal and resale value ↑
- Both trim landscaping — improves curb appeal and rental value ↑
ⓘ Cost ranges are severity-bucket heuristics (US national rule-of-thumb). Get contractor quotes + a written scope before underwriting a rehab budget.
Schools (NCES district)
- District
- Hemet Unified
- NCES district ID
- 0616920
- Math proficiency
- 19% ▼ -3.00%
- Reading proficiency
- 41% ▲ 4.00%
- Median HH income
- $39,962
- Composite
- 25.16/100
- National rank
- #7517
- State rank
- #360 of 517 in CA
Livability — Hemet
- Score
- 51/100
- State rank
- #1056
- US rank
- #25208
Category grades
Schools grade is shown separately in the Schools card above.
Census & demographics
- Census place
- Hemet, CA
- County
- Riverside County · 2,287,001 people
- City population
- 137,670
- Metro
- Riverside-San Bernardino-Ontario, CA
- Population (ZIP)
- 39,937
- Household income
- $49,396
- Rent vs Own
- Severe rent burden
- 2144.0
Population outlook (Riverside County) Hauer SSP2
- Today (2025)
- 2,664,475 people
- By 2030
- 2,802,692 · +5.2%
- By 2040
- 3,050,904 · +14.5%
- By 2050
- 3,256,783 · +22.2%
- By 2075
- 3,655,058 · +37.2%
- By 2100
- 3,766,594 · +41.4%
Race, ethnicity, and origin ACS 2023
- Neighborhood character
- Diverse neighborhood (Simpson 0.61)
- Race & ethnicity
- Hispanic / Latino 54% White 30% Two or more races 18% Black 10% Native American 2% Asian 2%
- Hispanic origin (detail)
- Mexican 48% Puerto Rican 1%
- Common ancestry
- Slovak 1% Romanian 1% Portuguese 1%
- Foreign-born
- 21% · Canada
- Languages at home
- 59% English-only · Spanish 38% Arabic 1% Tagalog/Filipino 1%
Political lean MEDSL · Riverside
- 2024 margin
- Toss-up / Even · D 48.0% · R 49.3% · Other 2.6%
- 2008→2024 swing
- -3.6pp toward R · 2008: 2.3pp · 2024: -1.3pp
- All cycles
- 2024: R+1.3 2020: D+8.0 2016: D+4.3 2012: R+0.4 2008: D+2.3
Not yet ingested
- Civics
- —
Market trends
- HPI YoY
- ▼ -147.46%
- Current HPI
- 405.1277
- Rent YoY
- ▲ 1.76%
- Metro
- Riverside-San Bernardino-Ontario, CA
- State GDP YoY
- ▲ 3.21%
- F500 in state
- 116
Industry mix (Fortune 500 HQ in CA)
| Industry | F500 HQs | Revenue |
|---|---|---|
| Technology | 27 | $1,492B |
|
||
| Financial Services | 3 | $174B |
|
||
| Retail | 3 | $44B |
|
||
| Insurance | 3 | $26B |
|
||
| Media / Entertainment | 2 | $115B |
|
||
| Pharmaceuticals / Biotech | 2 | $62B |
|
||
Price history
-5.0% since first listed5 events — show timeline
- 2026-06-09 Price Changed $57,000 CRMLS
- 2026-06-08 Listed $59,999 CRMLS
- 2024-05-31 Sold (MLS) $49,000 CRMLS
- 2024-05-03 Pending — CRMLS
- 2024-04-08 Listed $59,997 CRMLS
Cash-flow waterfall
monthlySold comps — $/sqft
last 12 mo · ≤1 miLoading sold comps…