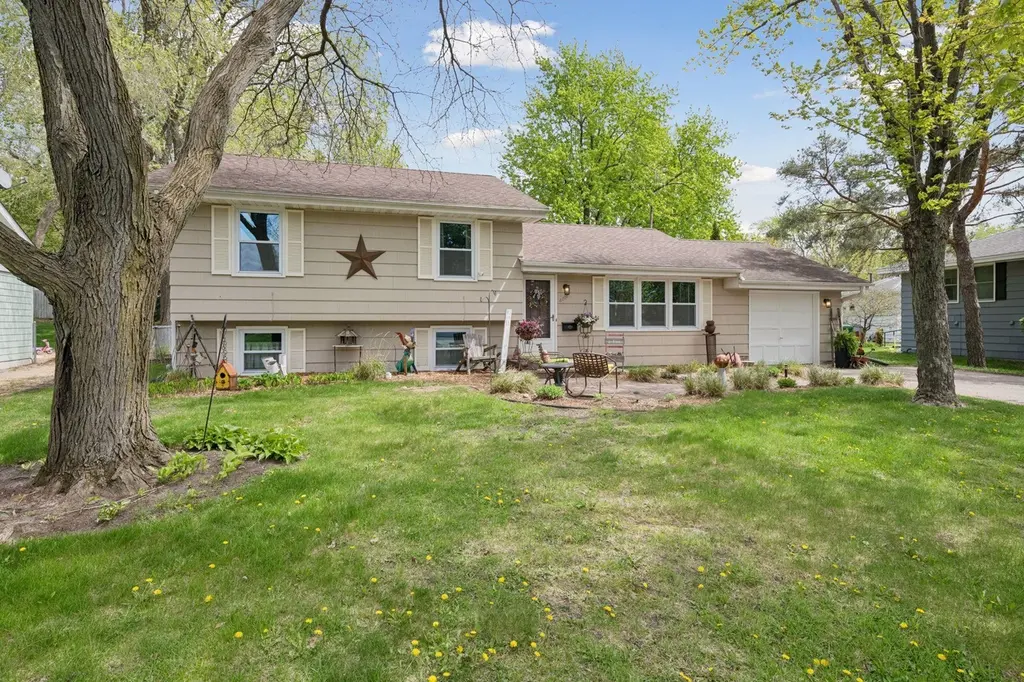
8717 Oxborough Ave S · Bloomington, MN
Flood risk 1/10 · Minimal
- FEMA flood zone
- X (unshaded)
- Chance of flooding over 30 yrs
- 0.0%
- Est. flood insurance / yr
- $473 – $860
Fire risk 1/10 · Minimal
- Est. fire insurance / yr
- $888 – $1,650
Heat risk 2/10 · Minimal
- Hot days now (above 98°F)
- 7 days/yr
- Hot days in 30 yrs
- 14 days/yr
Wind risk 2/10 · Minimal
- Chance of severe wind over 30 yrs
- —
Air-quality risk 2/10 · Minimal
- Unhealthy air days now
- 1 days/yr
- Unhealthy air days in 30 yrs
- 2 days/yr
Risk factors via First Street. Map © Google.
Why this score? — see what drove the D grade
The composite is a weighted blend of 9 inputs, each scored 0–100. Each bar is that input's sub-score; the figure is the points it added to the 100-point composite (weight × sub-score).
- ARV discount +12.3/15.0
- Cash flow +10.9/30.0
- Livability +3.8/5.0
- Schools +3.7/10.0
- DSCR +3.2/10.0
- Rent growth +3.0/5.0
- 1% rule +2.9/10.0
- Condition / age +2.5/5.0
- Appreciation +0.0/10.0
$350,000
🖨 Deal sheet 📄 Offer letter ✓ Due diligence
Listing remarks
This 3-bedroom, 2-bathroom gem hits that sweet spot between a "cozy retreat" and the "place where everyone wants to hang out. " It’s functional, spacious, and has just enough character to feel like home the second you pull into the driveway. The main living area is where the magic happens. An open-concept kitchen, dining, and living room that flows perfectly. Whether you’re meal-prepping at the kitchen island or lounging in the living room, you’re never cut off from the conversation. If you appreciate a good "indoor-outdoor" lifestyle, this backyard is going to be your favorite part of the house. The deck, sprawling and sturdy, featuring dedic
Key facts
- 0.26 acre lot
- Garage
- Built 1961
Property features AI
Exterior
- Parking: Attached garage with automatic door opener (1-car; approx. 14'x24"); Asphalt driveway
- Utilities: City water (connected); City sewer (connected); Electric service with circuit breakers; Fuel: electric and natural gas
- Home design: Residential property; Three-level split; Entry/main living on main level; Above-grade and below-grade finished living areas
- Construction: Constructed with block, concrete and frame materials; Block foundation; Roof older than 8 years
- Exterior features: Deck; Patio; Covered/other porch type; Chain link fencing; Storage shed; Medium tree coverage; City street frontage with curbs and street lights
Interior
- Kitchen: Cooktop; Range; Microwave; Dishwasher; Disposal; Refrigerator; ENERGY STAR qualified appliances
- Bedrooms: 3 bedrooms (all on upper/main levels as indicated: primary and two additional bedrooms on upper level)
- Flooring: Hardwood floors
- Bathrooms: 1 full bathroom (upper level); 1 half bathroom (basement)
- Heating & cooling: Forced air heating; Central air conditioning
- Interior features: Ceiling fans; Natural woodwork; Hardwood floors; Finished full daylight basement with storage and egress windows; Humidifier; Electronic air filter; Kitchen window; Kitchen center island; Breakfast bar / kitchen-dining area
- Laundry & utility: Laundry room with washer and dryer hookups and laundry sink (lower/basement level); Electric dryer hookup; Gas water heater
Neighborhood map
What this means for you Summary
Snapshot
- This is a 3-bed/1.5-bath single-family listed at $350k.
Deal economics
- At list price, monthly cash flow is $-155 ($-2k/yr) — negative.
- To cash-flow at today's rent, offer at most $323k (7.8% below list).
- To meet the 1% rule (rent ≥ 1% of price), the offer needs to be $276k (21.1% below list).
- Recommended offer: $276k (21.1% below list) — sets the bar for 1% rule.
- Cap rate 5.8% vs local median 3.5% in Bloomington — top-decile yield for the area; either an underpriced asset or a hidden risk that comps aren't pricing in. Stress-test before assuming the spread holds.
Location & tenants
- Location reads 76/100 on livability (#168 in MN, #3,640 nationally) — a middle-class / working-renter tenant base. Strengths: commute A+, employment A+, housing A+; Watch: crime D-, amenities F, health & safety F.
- Bloomington Public School District (urban): math 35% / reading 49% proficiency, ranked #192 of 301 in MN (top 64%) — families likely to look elsewhere, expect single-tenant / working-renter base with shorter leases.
- Market conditions: Rents rising (+2.0%/yr); 70 active listings in the ZIP; 6 comparable units currently listed for rent nearby; rentals leasing fast (median 2d on market — plan ~1-2 weeks tenant-placement turnaround); solid renter incomes; 4,651 units permitted in Hennepin County in 2024 (2,443 in 5+ unit buildings).
- This rent runs 35% of the median local income ($96k/yr) — at the standard rent-burdened threshold; future hikes will face affordability resistance.
Forward outlook
- Local home prices are declining (-3.0%/yr); year-one equity from $2k of loan paydown is wiped out by about $10k of value loss. Plan a longer hold.
- Hennepin County population projected at +30% by 2050 — long-run rental-demand tailwind backs the buy-and-hold thesis.
Negotiation context
- Only 8 days on market — expect competitive offers; lowballing is unlikely to land.
- 3 sale attempts since 34y ago with the ask held roughly flat each time — persistent listings suggest the price (not the market) is what's stuck; bring a comps-based counter.
- Current owner paid $192k; list at $350k implies a 82% gain — meaningful room to come down on a strong offer.
Questions for the listing agent
- What do current leases actually rent for vs. the listed asking? Can we see a recent rent roll and the last 12 months of T-12 income?
- Built in 1961 — when were the roof, HVAC, electrical panel, plumbing, and water heater last replaced?
- Is there a deadline driving the sale (1031 exchange, divorce, estate, relocation)? That informs how much negotiation room exists.
- Schools are B-rated — typically a magnet for longer-tenancy family renters. What's the average tenant stay here, and is there a school-zone premium baked into asking?
- Crime grade is D in this area — have there been break-ins, vandalism, or insurance claims at this property in the last 3 years? What carrier currently insures it and at what premium?
- The area grade is low — what's the realistic commute time and amenity access for the typical tenant pool here? Any planned neighborhood developments (good or bad) we should know about?
- What's the average days-on-market for RENTAL listings here right now (not sales)? A rising rental-DOM trend means longer vacancies and softer asking-rent achievability than the comps imply.
- What's the recent tenant-quality profile in this submarket — average credit score on applications, eviction rate, late-payment / NSF rate, and stable-employment percentage? A property-management company in the area should have these aggregated.
- How much new for-sale + rental construction is in the pipeline within 1–3 miles? Heavy new supply typically softens prices + rents 12–24 months out; constrained supply supports both.
Investment metrics
- 1% rule
- 0.79% ✗
- Cap rate
- 5.76%
- Cash-on-cash
- -1.90%
- DSCR
- 0.92
- GRM
- 10.6
CMA / ARV
- ARV (median comp)
- $391,527
- List price
- $350,000
- Delta
- -10.61%
- Verdict
- UNDERPRICED
- Comps
- 7 within 2.0 mi
Projected returns pro-forma
-3.0% appreciation · 2.02% rent growth · sell at horizon
- IRR
- -20.5%
- Equity multiple
- 0.29×
- Total profit
- $-69,315
- Equity at exit
- $52,186
- IRR
- -15.9%
- Equity multiple
- 0.14×
- Total profit
- $-83,982
- Equity at exit
- $30,262
Cash invested: $98,000 (down + closing). Projections, not guarantees.
Landlord ↔ Tenant lean methodology
- Overall (STATE)
- 46 Balanced
- State Minnesota
- 46 Balanced · D+2
- County
- — inherits STATE
- City
- — inherits STATE
ZIP-level market 55437
- Rents YoY
- 2.0%
- Active inventory
- 70
- Price-to-rent
- 10.6×
Monthly cashflow live
- Estimated rent
- $2,760 high interval (Pro) →
- Mortgage (P&I)
- −$1,835
- Tax from tax record
- −$354 /mo · $4,254/yr
- Insurance
- −$146
- HOA
- −$0
- Vacancy / Maint / Mgmt
- −$580
- Net cashflow
- $-155
Break-even live
UW: 25.0% down · 7.5% · 30yr · 1.5% tax · 5.0% vac · 8.0% maint · 8.0% mgmt
Financing live
Cash to close
- Down payment
- $87,500
- Closing costs
- $10,500
- Reserves months
- —
- Total cash needed
- —
Loan-product check · same deal, 3 products live
Conventional
25% down · 7.5% · 30yr
- Down + closing
- —
- Monthly P&I
- —
- Monthly cashflow
- —
- DSCR
- —
- Eligible?
- —
Personal DTI + credit; lowest rate.
DSCR
20% down · 8.5% · 30yr
- Down + closing
- —
- Monthly P&I
- —
- Monthly cashflow
- —
- DSCR
- —
- Eligible?
- —
No personal income docs; deal must DSCR.
Hard money
10% down · 12.0% · 12mo
- Down + closing
- —
- Monthly P&I
- —
- Monthly cashflow
- —
- DSCR
- —
- Eligible?
- —
Short-term bridge; refi at stabilization.
Rent comps 6 comps
| Address | Beds | Baths | Sqft | Rent | $/sqft | DOM | Units | Dist |
|---|---|---|---|---|---|---|---|---|
| 5100 W 82nd St Minneapolis, MN | 2.0 | 1.0–2.0 | 884 | $2,355 | $2.66 | 1d | 15 | 0.72mi |
| 8101 Normandale Lake Blvd Minneapolis, MN | 2.0 | 1.0–2.0 | 918 | $2,884 | $3.14 | 1d | 20 | 0.99mi |
| 5800 American Blvd W Minneapolis, MN | 1.0–2.0 | 1.5–2.5 | 1031 | $4,650 | $4.51 | 1d | 19 | 1.17mi |
| 4620 77th St W Minneapolis, MN | 1.0–2.0 | 1.0–2.0 | 856 | $3,199 | $3.74 | 1d | 33 | 1.21mi |
| 4660 77th St W Minneapolis, MN | 1.0–2.0 | 1.0–2.0 | 815 | $3,199 | $3.93 | 1d | 37 | 1.21mi |
| 4480 Parklawn Ave Minneapolis, MN | 1.0–3.0 | 1.0–2.0 | 950 | $2,130 | $2.24 | 2d | 4 | 1.38mi |
Listing history 11 events
-
2026-05-13status Pending 1283-char remark
-
2026-05-10historical Contingent - Inspection 1283-char remark
-
2026-05-06$350,000 Active 1283-char remark
-
2026-04-29historical $350,000 1283-char remark
-
2001-08-10soldstatus $192,500
-
2001-07-17historical
-
2001-06-29$194,900
-
1992-12-28soldstatus $97,400
-
1992-11-08soldstatus $97,400
-
1992-11-06$99,900
-
1978-12-01soldstatus $58,000
ⓘ Source: listings_history table (triggers on properties + properties_extension) + one-shot
backfill from property_details.listing_events for pre-trigger history.
Tax reassessment forecast MN · Partial reset (capped growth)
- Current annual tax
- $4,254 · $354/mo
- Projected year-2 tax
- $4,254 · $354/mo
- Expected delta
- $0/yr ($0/mo · 0.0%)
ⓘ Screening estimate from a state-policy table — verify with the county assessor before closing.
Climate risk First Street
- Flood 1/10 Low FEMA zone X (unshaded) · 0% chance over 30 yrs
- Wildfire 1/10 Low
- Heat 2/10 Low 7 d/yr ≥98°F today · 14 d/yr by 30 yrs out
- Wind 2/10 Low
- Air quality 2/10 Low 1 unhealthy d/yr today · 2 by 30 yrs out
Nearby sold comps map
Loading sold comps map…
Walkable amenities ~0.75 mi
Loading nearby amenities…
Taxation est. · year 1
- Rental income
- $33,120
- − Mortgage interest
- −$19,605
- − Property taxes
- −$4,254
- − Insurance
- −$1,750
- − Repairs & maintenance
- −$2,650
- − Management
- −$2,650
- − Depreciation
- −$10,182
- Taxable loss
- −$7,970
- Est. tax savings @ 24.0%
- +$1,913
- After-tax cash flow
- $49/yr
For passive investors: Depreciation is non-cash, so a rental often shows a tax loss while cash-flowing — sheltering income. Rental losses are passive: they offset passive income freely, and up to $25,000/yr can offset ordinary (W-2) income if you actively participate and your MAGI is under $100k (phasing out to $0 by $150k); unused losses carry forward. On sale, claimed depreciation is recaptured at up to 25%, and gains may owe capital-gains tax (a 1031 exchange can defer both). Figures are a year-1 estimate at your 24.0% rate — not tax advice; consult a CPA.
Schools (NCES district)
- District
- Bloomington Public School District
- NCES district ID
- 2705790
- Math proficiency
- 35% ▼ -12.00%
- Reading proficiency
- 49% ▼ -4.00%
- Median HH income
- $63,279
- Composite
- 37.37/100
- National rank
- #4431
- State rank
- #192 of 301 in MN
Livability — Bloomington
- Score
- 76/100
- State rank
- #168
- US rank
- #3640
Category grades
Schools grade is shown separately in the Schools card above.
Census & demographics
- Census place
- Bloomington, MN
- County
- Hennepin County · 1,150,272 people
- City population
- 88,605
- Metro
- Minneapolis-St. Paul-Bloomington, MN-WI
- Population (ZIP)
- 18,881
- Household income
- $95,718
- Rent vs Own
- Severe rent burden
- 512.0
Population outlook (Hennepin County) Hauer SSP2
- Today (2025)
- 1,405,227 people
- By 2030
- 1,492,650 · +6.2%
- By 2040
- 1,660,157 · +18.1%
- By 2050
- 1,823,498 · +29.8%
- By 2075
- 2,221,283 · +58.1%
- By 2100
- 2,509,976 · +78.6%
Race, ethnicity, and origin ACS 2023
- Neighborhood character
- Predominantly White (83%)
- Race & ethnicity
- White 83% Two or more races 6% Black 5% Asian 4% Hispanic / Latino 4%
- Common ancestry
- Portuguese 14% Romanian 3% Lithuanian 3%
- Foreign-born
- 12% · Canada, Vietnam, Jamaica
- Languages at home
- 87% English-only · Spanish 4% Other Asian/Pacific 2% Other Indo-European 2%
Political lean MEDSL · Hennepin
- 2024 margin
- Solid D (+42.6) · D 70.2% · R 27.5% · Other 2.3%
- 2008→2024 swing
- +14.0pp toward D · 2008: 28.6pp · 2024: 42.6pp
- All cycles
- 2024: D+42.6 2020: D+43.2 2016: D+35.3 2012: D+27.1 2008: D+28.6
Not yet ingested
- Civics
- —
Market trends
- HPI YoY
- ▼ -232.73%
- Current HPI
- 233.0461
- Rent YoY
- ▲ 2.02%
- Metro
- Minneapolis-St. Paul-Bloomington, MN-WI
- State GDP YoY
- ▲ 2.41%
- F500 in state
- 34
Industry mix (Fortune 500 HQ in MN)
| Industry | F500 HQs | Revenue |
|---|---|---|
| Healthcare | 2 | $407B |
|
||
| Retail | 2 | $150B |
|
||
| Consumer Goods | 2 | $32B |
|
||
| Industrial Machinery | 2 | $6B |
|
||
| Agriculture | 1 | $40B |
|
||
| Healthcare / Medical Devices | 1 | $32B |
|
||
Price history
+503.4% since first listed11 events — show timeline
- 2026-05-13 Pending — NORTHSTARMLS as Distributed by MLS Grid
- 2026-05-10 Contingent — NORTHSTARMLS as Distributed by MLS Grid
- 2026-05-06 Listed $350,000 NORTHSTARMLS as Distributed by MLS Grid
- 2026-04-29 Coming Soon $350,000 NORTHSTARMLS as Distributed by MLS Grid
- 2001-08-10 Sold (MLS) $192,500 NORTHSTARMLS as Distributed by MLS Grid
- 2001-07-17 Listing Removed — NORTHSTARMLS as Distributed by MLS Grid
- 2001-06-29 Listed $194,900 NORTHSTARMLS as Distributed by MLS Grid
- 1992-12-28 Sold (Public Records) $97,400 Public Records
- 1992-11-08 Sold (MLS) $97,400 NORTHSTARMLS as Distributed by MLS Grid
- 1992-11-06 Listed $99,900 NORTHSTARMLS as Distributed by MLS Grid
- 1978-12-01 Sold (Public Records) $58,000 Public Records
Property tax history
+4.0%/yrLatest (2025): $4,254 · +1.5% YoY. Source: county tax records.
Cash-flow waterfall
monthlySold comps — $/sqft
last 12 mo · ≤1 miLoading sold comps…