66 9th St E #1614 · St. Paul, MN
Flood risk No data
- FEMA flood zone
- —
- Chance of flooding over 30 yrs
- —
- Est. flood insurance / yr
- —
Fire risk No data
- Est. fire insurance / yr
- —
Heat risk No data
- Hot days now (above threshold)
- —
- Hot days in 30 yrs
- —
Wind risk No data
- Chance of severe wind over 30 yrs
- —
Air-quality risk No data
- Unhealthy air days now
- —
- Unhealthy air days in 30 yrs
- —
Risk factors via First Street. Map © Google.
Why this score? — see what drove the D grade
The composite is a weighted blend of 9 inputs, each scored 0–100. Each bar is that input's sub-score; the figure is the points it added to the 100-point composite (weight × sub-score).
- Cash flow +9.9/30.0
- 1% rule +9.9/10.0
- ARV discount +7.5/15.0
- DSCR +2.8/10.0
- Rent growth +2.6/5.0
- Livability +2.5/5.0
- Condition / age +2.5/5.0
- Appreciation +2.4/10.0
- Schools +2.4/10.0
$119,000
🖨 Deal sheet (PDF) 📄 Offer letter ✓ Due diligence
Listing remarks MLS
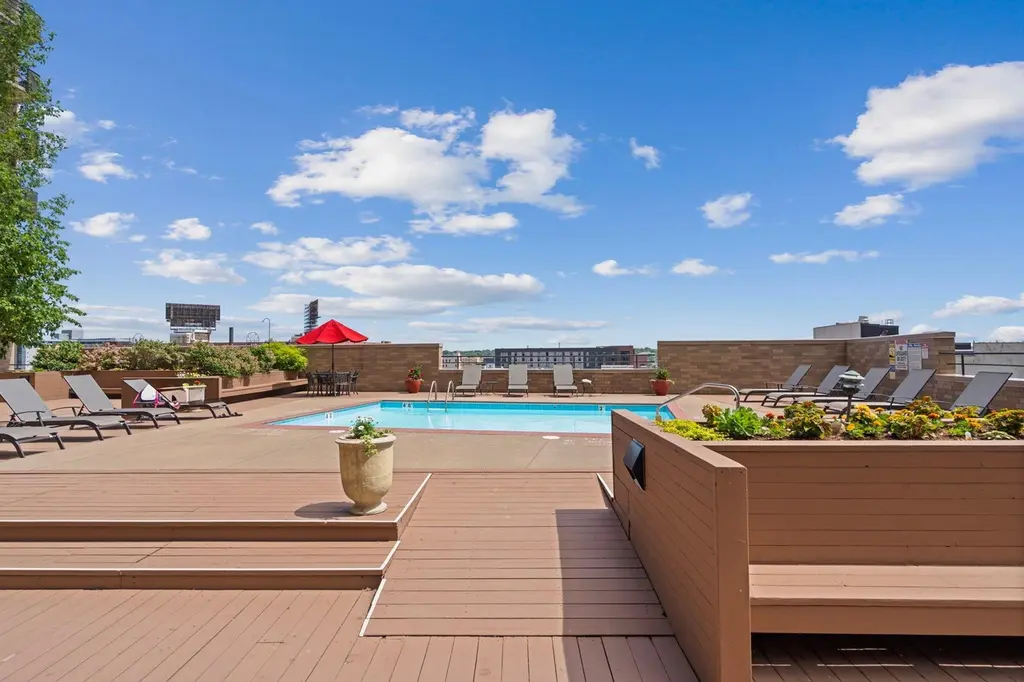
Welcome to the highly coveted City Walk Condos. This great DT St.Paul condo has it all. Close proximity to the Xcel Energy and many great restaurants. Updated flooring, counter tops, recently painted, newer SS appliances. Building amenities include a party room, exercise room, roof top pool, hot-tub, sauna, and skyway access. Party room, fitness room and pool are located on the 12th floor. Get party room key from the front desk. Fob provides access to most of the amenities. Fabulous views from the private balcony, great location with easy freeway access and easy skyway access leave nothing to want for an incredible price! Don’t miss this one!
Key facts
- $640 HOA
- Garage
- Community pool
Property features AI
Finance
- Other: Lot approximately 0.58 acres; Directions: SW Corner of 9th and Minnesota
- HOA & community: Association managed by Cedar Management; Monthly association fee; Association amenities include a sauna; Shared community rooms including amusement/party room, community room, and exercise room
Exterior
- Parking: Assigned covered secured parking; Attached garage (1 garage space)
- Security: Secured parking
- Utilities: City water (connected); City sewer (connected); Xcel Energy power; Natural gas
- Home design: Attached residential property; One story; 720 finished above-grade living area
- Construction: Flat roof; 720 foundation area
- Exterior features: Stone exterior; Shared below-ground pool; Located on a city street with public maintenance
Interior
- Kitchen: Equipped with range, microwave, dishwasher, refrigerator, and disposal
- Bedrooms: One bedroom on the main level (14 x 12)
- Bathrooms: One full bathroom
- Heating & cooling: Forced air heating; Central air conditioning
- Interior features: Dishwasher; Disposal; Microwave; Range; Refrigerator
Neighborhood map
What this means for you Summary
Snapshot
- This is a 1-bed/1.0-bath condo listed at $119k.
Deal economics
- At list price, monthly cash flow is $-73 ($-875/yr) — negative.
- To cash-flow at today's rent, offer at most $106k (10.8% below list).
- Meets the 1% rule at list price ($2k rent vs $119k).
- Recommended offer: $106k (10.8% below list) — sets the bar for cash-flow.
Location & tenants
- Location reads: area grade D — affects rentability + tenant quality, not the cash-flow math above.
- St. Paul Public School District (urban): math 21% / reading 33% proficiency, ranked #270 of 301 in MN (top 90%) — low school quality limits family demand, transient renter base, plan for 1-2y turnover; 64% free/reduced lunch — lower-income household profile, screen leases tightly.
- Zoned schools: Farnsworth Aerospace Lower (math 5% / reading 15%, grade F, #813 of 857 statewide, top 97%, 425 students, 83% FRL) — zoned schools average 83% FRL vs 64% district-wide (19 pts higher); higher-poverty schools than district average — tighter screening recommended.
- Zoned-school proficiency averages 10% at this address vs 27% district-wide (-17 pts) — the specific schools serving this property underperform the St. Paul Public School District average; the district grade overstates school quality for this exact location.
- Market conditions: Rents flat; 76 active listings in the ZIP; 11 comparable units currently listed for rent nearby; rentals leasing fast (median 4d on market — plan ~1-2 weeks tenant-placement turnaround); 1,202 units permitted in Ramsey County in 2024 (880 in 5+ unit buildings).
- This rent runs 33% of the median local income ($65k/yr) — at the standard rent-burdened threshold; future hikes will face affordability resistance.
Forward outlook
- Local home prices are declining (-3.0%/yr); year-one equity from $823 of loan paydown is wiped out by about $4k of value loss. Plan a longer hold.
- Ramsey County population projected at +27% by 2050 — long-run rental-demand tailwind backs the buy-and-hold thesis.
Negotiation context
- It's been on market 18 days — a 2% lower offer ($117k) is reasonable based on typical stale-listing flexibility.
- 6 sale attempts since 19y ago; this cycle's ask has dropped $16k (12%) from the opening price — seller is motivated, your offer sets the floor, not the list.
Risks & watch-outs
- Watch-outs: HOA is 36% of rent.
Questions for the listing agent
- What do current leases actually rent for vs. the listed asking? Can we see a recent rent roll and the last 12 months of T-12 income?
- What does the HOA fee cover, when was the last increase, and are there any pending special assessments or reserve-fund shortfalls?
- Any open or pending special assessments — roof, HVAC, plumbing, elevator, façade? What's the per-unit balance and payoff schedule, and is the seller paying it off at close or rolling it to the buyer?
- Is there a deadline driving the sale (1031 exchange, divorce, estate, relocation)? That informs how much negotiation room exists.
- The area grade is low — what's the realistic commute time and amenity access for the typical tenant pool here? Any planned neighborhood developments (good or bad) we should know about?
- What's the average days-on-market for RENTAL listings here right now (not sales)? A rising rental-DOM trend means longer vacancies and softer asking-rent achievability than the comps imply.
- What's the recent tenant-quality profile in this submarket — average credit score on applications, eviction rate, late-payment / NSF rate, and stable-employment percentage? A property-management company in the area should have these aggregated.
- How much new apartment / multifamily construction is in the pipeline within 1–3 miles? Heavy new supply (>2% of stock underway) typically softens rents 12–24 months out; light construction supports rent growth.
Investment metrics
- 1% rule
- 1.49% ✓
- Cap rate
- 5.56%
- Cash-on-cash
- -2.63%
- DSCR
- 0.88
- GRM
- 5.6
CMA / ARV
No comps found within radius.
Projected returns pro-forma
-3.0% appreciation · 0.2% rent growth · sell at horizon
- IRR
- -26.3%
- Equity multiple
- 0.15×
- Total profit
- $-28,367
- Equity at exit
- $17,743
- IRR
- -58.1%
- Equity multiple
- -0.44×
- Total profit
- $-47,823
- Equity at exit
- $10,289
Cash invested: $33,320 (down + closing). Projections, not guarantees.
Landlord ↔ Tenant lean methodology
- Overall (STATE)
- 46 Balanced
- State Minnesota
- 46 Balanced · D+2
- County
- — inherits STATE
- City
- — inherits STATE
ZIP-level market 55101
- Home prices YoY
- -2.1%
- Rents YoY
- 0.2%
- Active inventory
- 76
- Price-to-rent
- 5.6×
Monthly cashflow live
- Estimated rent
- $1,776 high interval (Pro) →
- Mortgage (P&I)
- −$624
- Tax from tax record
- −$162 /mo · $1,944/yr
- Insurance
- −$50
- HOA
- −$640
- Vacancy / Maint / Mgmt
- −$373
- Net cashflow
- $-73
Break-even live
Sensitivity live
| Price | -10% $-6 | -5% $-39 | +0% $-73 | +5% $-107 | +10% $-140 |
|---|---|---|---|---|---|
| Rent | -10% $-213 | -5% $-143 | +0% $-73 | +5% $-3 | +10% $67 |
| Rate | -1.0pp $-13 | -0.5pp $-43 | base $-73 | +0.5pp $-104 | +1.0pp $-135 |
UW: 25.0% down · 7.5% · 30yr · 1.5% tax · 5.0% vac · 8.0% maint · 8.0% mgmt
Financing live
Cash to close
- Down payment
- $29,750
- Closing costs
- $3,570
- Reserves months
- —
- Total cash needed
- —
Loan-product check · same deal, 3 products live
Conventional
25% down · 7.5% · 30yr
- Down + closing
- —
- Monthly P&I
- —
- Monthly cashflow
- —
- DSCR
- —
- Eligible?
- —
Personal DTI + credit; lowest rate.
DSCR
20% down · 8.5% · 30yr
- Down + closing
- —
- Monthly P&I
- —
- Monthly cashflow
- —
- DSCR
- —
- Eligible?
- —
No personal income docs; deal must DSCR.
Hard money
10% down · 12.0% · 12mo
- Down + closing
- —
- Monthly P&I
- —
- Monthly cashflow
- —
- DSCR
- —
- Eligible?
- —
Short-term bridge; refi at stabilization.
Rent comps 11 comps
| Address | Beds | Baths | Sqft | Rent | $/sqft | DOM | Units | Dist |
|---|---|---|---|---|---|---|---|---|
| 101 10th St E Saint Paul, MN | 2.0 | 1.0–2.0 | 853 | $1,924 | $2.25 | 1d | 20 | 0.17mi |
| 141 4th St E Saint Paul, MN | 2.0 | 1.0–2.0 | 811 | $1,776 | $2.19 | 21d | 20 | 0.30mi |
| 333 Sibley St Saint Paul, MN | 3.0 | 1.0–2.0 | 1358 | $1,884 | $1.39 | 12d | 10 | 0.33mi |
| 111 Kellogg Blvd E Saint Paul, MN | 3.0 | 1.0–2.0 | 1000 | $1,749 | $1.75 | 3d | 20 | 0.34mi |
| 240 5th St E St Paul, MN | 2.0 | 1.0–2.0 | 949 | $2,040 | $2.15 | 0d | 9 | 0.39mi |
| 250 6th St E St Paul, MN | 2.0 | 1.0–2.0 | 980 | $2,098 | $2.14 | 1d | 17 | 0.39mi |
| 180 E Kellogg Blvd St Paul, MN | 3.0 | 1.0–2.5 | 1436 | $2,338 | $1.63 | 0d | 21 | 0.42mi |
| 253 Kellogg Blvd W Saint Paul, MN | 2.0 | 1.0–2.0 | 1208 | $2,226 | $1.84 | 4d | 12 | 0.45mi |
| 330 9th St E St Paul, MN | 1.0–2.0 | 1.0 | 978 | $1,445 | $1.48 | 4d | 3 | 0.48mi |
| 400 Spring St Saint Paul, MN | 1.0–2.0 | 1.0–2.0 | 1205 | $1,500 | $1.24 | 1d | 32 | 1.00mi |
| 255 Western Ave N Saint Paul, MN | 3.0 | 1.0–2.0 | 1049 | $2,181 | $2.08 | 3d | 23 | 1.07mi |
HOA detail condo
- Monthly dues
- $640 · $7,680/yr
- Likely covers
- pool
- Assessments
- None detected in remarks — confirm with the listing agent.
Listing history 12 events
-
2026-06-21days on market $119,000 Active 18 DOM
-
2026-06-18days on market $119,000 Active 15 DOM
-
2026-06-17days on market $119,000 Active 14 DOM
-
2026-06-16days on market $119,000 Active 13 DOM
-
2026-06-15days on market $119,000 Active 12 DOM
-
2026-06-13days on market $119,000 Active 10 DOM
-
2026-06-09days on market $119,000 Active 6 DOM
-
2026-06-08days on market $119,000 Active 5 DOM
-
2026-06-07days on market $119,000 Active 4 DOM
-
2026-06-04statusdays on market $119,000 Active 1 DOM
-
2026-06-03days on market $119,000 Coming Soon 2 DOM
-
2026-06-02$119,000 Coming Soon 1 DOM
ⓘ Source: listings_history table (triggers on properties + properties_extension) + one-shot
backfill from property_details.listing_events for pre-trigger history.
Tax reassessment forecast MN · Partial reset (capped growth)
- Current annual tax
- $1,944 · $162/mo
- Projected year-2 tax
- $1,944 · $162/mo
- Expected delta
- $0/yr ($0/mo · 0.0%)
ⓘ Screening estimate from a state-policy table — verify with the county assessor before closing.
Nearby sold comps map
Loading sold comps map…
Walkable amenities ~0.75 mi
Loading nearby amenities…
Taxation est. · year 1
- Rental income
- $21,307
- − Mortgage interest
- −$6,666
- − Property taxes
- −$1,944
- − Insurance
- −$595
- − Repairs & maintenance
- −$1,705
- − Management
- −$1,705
- − HOA
- −$7,680
- − Depreciation
- −$3,462
- Taxable loss
- −$2,449
- Est. tax savings @ 24.0%
- +$588
- After-tax cash flow
- $-288/yr
For passive investors: Depreciation is non-cash, so a rental often shows a tax loss while cash-flowing — sheltering income. Rental losses are passive: they offset passive income freely, and up to $25,000/yr can offset ordinary (W-2) income if you actively participate and your MAGI is under $100k (phasing out to $0 by $150k); unused losses carry forward. On sale, claimed depreciation is recaptured at up to 25%, and gains may owe capital-gains tax (a 1031 exchange can defer both). Figures are a year-1 estimate at your 24.0% rate — not tax advice; consult a CPA.
Schools (NCES district)
- District
- St. Paul Public School District
- NCES district ID
- 2733840
- Math proficiency
- 21% ▼ -11.00%
- Reading proficiency
- 33% ▼ -7.00%
- Median HH income
- $48,316
- Composite
- 23.51/100
- National rank
- #7868
- State rank
- #270 of 301 in MN
Livability — St. Paul
No livability data for this city. (Only ~50 U.S. cities are tracked.)
Census & demographics
- Census place
- St. Paul, MN
- County
- Ramsey County · 542,837 people
- City population
- 280,599
- Metro
- Minneapolis-St. Paul-Bloomington, MN-WI
- Population (ZIP)
- 7,911
- Household income
- $64,863
- Rent vs Own
- Severe rent burden
- 1202.0
Population outlook (Ramsey County) Hauer SSP2
- Today (2025)
- 603,431 people
- By 2030
- 636,459 · +5.5%
- By 2040
- 700,596 · +16.1%
- By 2050
- 765,819 · +26.9%
- By 2075
- 929,297 · +54.0%
- By 2100
- 1,053,924 · +74.7%
Race, ethnicity, and origin ACS 2023
- Neighborhood character
- Predominantly White (67%)
- Race & ethnicity
- White 67% Asian 13% Black 10% Two or more races 6% Hispanic / Latino 3%
- Common ancestry
- Portuguese 8% Romanian 3% Italian 3%
- Foreign-born
- 11% · Canada, Vietnam, China
- Languages at home
- 86% English-only · Spanish 3% Other Asian/Pacific 3% Tagalog/Filipino 2%
Political lean MEDSL · Ramsey
- 2024 margin
- Solid D (+43.3) · D 70.5% · R 27.2% · Other 2.3%
- 2008→2024 swing
- +9.4pp toward D · 2008: 33.9pp · 2024: 43.3pp
- All cycles
- 2024: D+43.3 2020: D+45.4 2016: D+39.4 2012: D+35.3 2008: D+33.9
Not yet ingested
- Civics
- —
Market trends
- HPI YoY
- ▼ -5.29%
- Current HPI
- 248.1315
- Rent YoY
- ▲ 0.20%
- Metro
- Minneapolis-St. Paul-Bloomington, MN-WI
- State GDP YoY
- ▲ 2.41%
- F500 in state
- 34
Industry mix (Fortune 500 HQ in MN)
| Industry | F500 HQs | Revenue |
|---|---|---|
| Healthcare | 2 | $407B |
|
||
| Retail | 2 | $150B |
|
||
| Consumer Goods | 2 | $32B |
|
||
| Industrial Machinery | 2 | $6B |
|
||
| Agriculture | 1 | $40B |
|
||
| Healthcare / Medical Devices | 1 | $32B |
|
||
Price history
+8.3% since first listed26 events — show timeline
- 2026-06-01 Coming Soon $119,000 NORTHSTARMLS as Distributed by MLS Grid
- 2023-04-06 Pending — NORTHSTARMLS as Distributed by MLS Grid
- 2023-04-06 Sold (MLS) $134,900 NORTHSTARMLS as Distributed by MLS Grid
- 2023-04-05 Sold (Public Records) $134,900 Public Records
- 2023-02-20 Contingent — NORTHSTARMLS as Distributed by MLS Grid
- 2023-02-15 Listing Removed — NORTHSTARMLS as Distributed by MLS Grid
- 2023-02-15 Listed $134,900 NORTHSTARMLS as Distributed by MLS Grid
- 2023-02-03 Price Changed $134,900 NORTHSTARMLS as Distributed by MLS Grid
- 2022-11-28 Listed $144,900 NORTHSTARMLS as Distributed by MLS Grid
- 2022-11-16 Coming Soon — NORTHSTARMLS as Distributed by MLS Grid
- 2020-08-12 Sold (Public Records) $141,000 Public Records
- 2020-08-06 Sold (MLS) $141,000 NORTHSTARMLS as Distributed by MLS Grid
- 2020-07-06 Pending — NORTHSTARMLS as Distributed by MLS Grid
- 2020-06-24 Contingent — NORTHSTARMLS as Distributed by MLS Grid
- 2020-04-24 Listed $150,000 NORTHSTARMLS as Distributed by MLS Grid
- 2020-04-20 Coming Soon $150,000 NORTHSTARMLS as Distributed by MLS Grid
- 2018-12-21 Sold (Public Records) $139,900 Public Records
- 2018-11-02 Sold (MLS) $139,900 NORTHSTARMLS as Distributed by MLS Grid
- 2018-10-16 Pending — NORTHSTARMLS as Distributed by MLS Grid
- 2018-10-05 Contingent — NORTHSTARMLS as Distributed by MLS Grid
- 2018-10-03 Listed $139,900 NORTHSTARMLS as Distributed by MLS Grid
- 2008-09-30 Sold (MLS) $108,000 NORTHSTARMLS as Distributed by MLS Grid
- 2008-09-03 Listing Removed — NORTHSTARMLS as Distributed by MLS Grid
- 2008-08-24 Listed $109,900 NORTHSTARMLS as Distributed by MLS Grid
- 2008-02-14 Listing Removed — NORTHSTARMLS as Distributed by MLS Grid
- 2007-09-04 Listed $109,900 NORTHSTARMLS as Distributed by MLS Grid
Property tax history
+4.8%/yrLatest (2025): $1,944 · +7.6% YoY. Source: county tax records.
Cash-flow waterfall
monthlySold comps — $/sqft
last 12 mo · ≤1 miLoading sold comps…