 Duplex
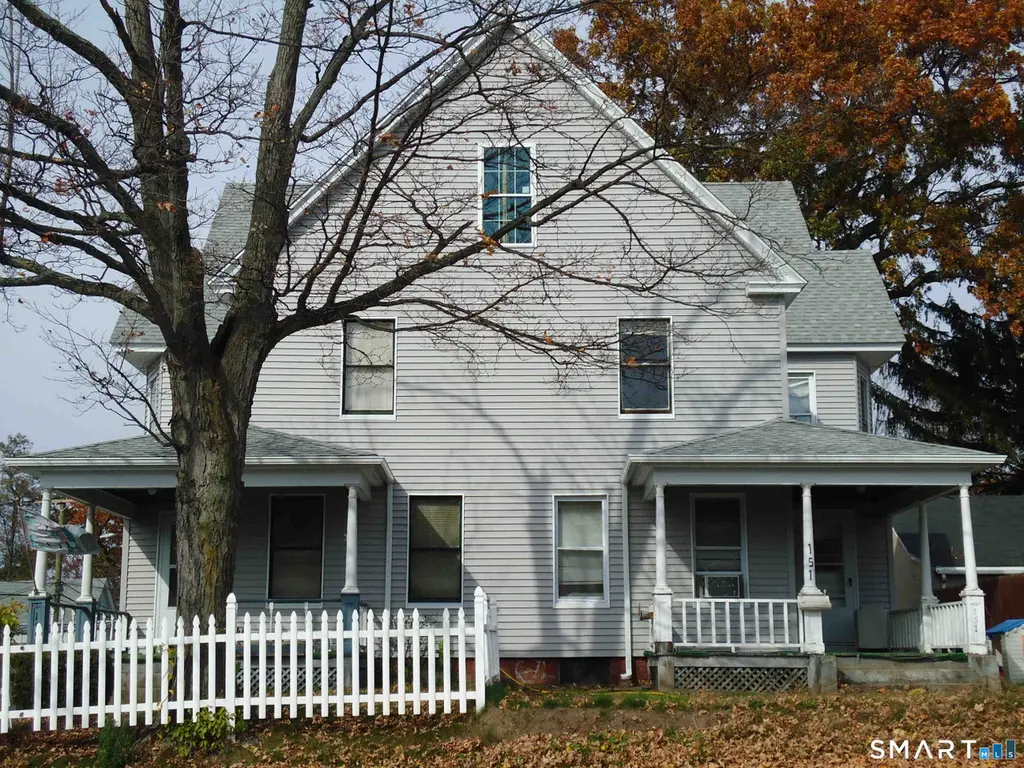
151 Center St · Manchester, CT
Flood risk 1/10 · Minimal
- FEMA flood zone
- X (unshaded)
- Chance of flooding over 30 yrs
- 0.0%
- Est. flood insurance / yr
- $507 – $1,088
Fire risk 1/10 · Minimal
- Est. fire insurance / yr
- $829 – $1,539
Heat risk 5/10 · Moderate
- Hot days now (above 95°F)
- 7 days/yr
- Hot days in 30 yrs
- 17 days/yr
Wind risk 6/10 · Moderate
- Chance of severe wind over 30 yrs
- 27.0%
Air-quality risk 3/10 · Minor
- Unhealthy air days now
- 3 days/yr
- Unhealthy air days in 30 yrs
- 4 days/yr
Risk factors via First Street. Map © Google.
Why this score? — see what drove the B grade
The composite is a weighted blend of 9 inputs, each scored 0–100. Each bar is that input's sub-score; the figure is the points it added to the 100-point composite (weight × sub-score).
- Cash flow +28.3/30.0
- ARV discount +15.0/15.0
- DSCR +10.0/10.0
- 1% rule +8.6/10.0
- Livability +3.8/5.0
- Rent growth +3.0/5.0
- Schools +2.5/10.0
- Condition / age +2.5/5.0
- Appreciation +0.0/10.0
$320,000
🖨 Deal sheet 📄 Offer letter ✓ Due diligence
Multi-family units
County records classify this as Multi-Family (2-4 Unit). Listing-text estimate: 2 units. confirmed
Listing remarks MLS
Property sold in As-Is and Where-Is condition.
Key facts
- Solid bones
- Front porches
- Spacious units
Tags
Property features AI
Exterior
- Utilities: Public water (connected/in street); Public sewer (connected/in street); Oil tank located in basement
- Home design: Multi-family (2-family) property
- Construction: Asphalt shingle roof; Vinyl siding; Frame construction; Masonry foundation; Light blue exterior
- Exterior features: Sidewalk; Gutters; Exterior lighting; Level lot
Interior
- Bedrooms: 6 bedrooms
- Bathrooms: 3 full bathrooms
- Heating & cooling: Hot air heating; Oil-fired heat; 50-gallon electric hot water tank
- Interior features: Total of 12 rooms; Full basement with hatchway; Wall unit cooling
Neighborhood map
What this means for you Summary
Snapshot
- This is a 2 × 3-bed/1.5-bath units multifamily listed at $320k.
Deal economics
- At list price, monthly cash flow is $1k ($12k/yr) — positive. Per door: $515/mo.
- The deal already cash-flows at list — no discount required.
- Meets the 1% rule at list price ($4k rent vs $320k).
- Recommended offer: $315k (1.5% below list) — sets the bar for market timing.
- Cap rate 10.2% vs local median 3.8% in Manchester — top-decile yield for the area; either an underpriced asset or a hidden risk that comps aren't pricing in. Stress-test before assuming the spread holds.
Location & tenants
- Location reads 76/100 on livability (#59 in CT, #3,580 nationally) — a middle-class / working-renter tenant base. Strengths: housing A+, health & safety A+, cost of living A-; Watch: amenities D, commute F.
- Manchester School District (suburban): math 21% / reading 32% proficiency, ranked #130 of 153 in CT (top 85%) — low school quality limits family demand, transient renter base, plan for 1-2y turnover.
- Market conditions: Rents rising (+2.0%/yr); 99 active listings in the ZIP; solid renter incomes; 1,867 units permitted in Capitol Planning Region in 2024 (1,399 in 5+ unit buildings).
- At $4,367/mo this rent would consume 63% of the median local household income ($83k/yr) (locally 1839% of renters already pay >50% of income on rent) — very limited rent-growth headroom before tenants either downsize or default.
Forward outlook
- Local home prices are declining (-3.0%/yr); year-one equity from $2k of loan paydown is wiped out by about $10k of value loss. Plan a longer hold.
- At projected returns (-3.0% appreciation + 2.0% rent growth), your $90k cash investment doubles in ~10 years — after that, you're playing with house money.
Negotiation context
- It's been on market 23 days — a 2% lower offer ($315k) is reasonable based on typical stale-listing flexibility.
- 2 sale attempts since 7y ago with the ask held roughly flat each time — persistent listings suggest the price (not the market) is what's stuck; bring a comps-based counter.
- Current owner paid $99k; list at $320k implies a 223% gain — meaningful room to come down on a strong offer.
Risks & watch-outs
- Watch-outs: built in 1906 — expect roof / HVAC / electrical / plumbing capex.
- Climate carrying-cost: major wind risk, 27% chance of damaging wind over 30y; extreme-heat days projected 7→17/yr by 2055 (HVAC capex compounding) — expect insurance premiums to compound above CPI over the hold.
Questions for the listing agent
- Can we see the unit-by-unit rent roll, current vacancy, and any below-market leases? What's the average tenancy length?
- What capital expenditures (roof, boiler, parking lot, exteriors) have been made in the last 5 years, and what's planned in the next 2?
- Built in 1906 — when were the roof, HVAC, electrical panel, plumbing, and water heater last replaced?
- Is there a deadline driving the sale (1031 exchange, divorce, estate, relocation)? That informs how much negotiation room exists.
- Schools are B-rated — typically a magnet for longer-tenancy family renters. What's the average tenant stay here, and is there a school-zone premium baked into asking?
- What's the average days-on-market for RENTAL listings here right now (not sales)? A rising rental-DOM trend means longer vacancies and softer asking-rent achievability than the comps imply.
- What's the recent tenant-quality profile in this submarket — average credit score on applications, eviction rate, late-payment / NSF rate, and stable-employment percentage? A property-management company in the area should have these aggregated.
- How much new apartment / multifamily construction is in the pipeline within 1–3 miles? Heavy new supply (>2% of stock underway) typically softens rents 12–24 months out; light construction supports rent growth.
Investment metrics
- 1% rule
- 1.36% ✓
- Cap rate
- 10.16%
- Cash-on-cash
- 13.79%
- DSCR
- 1.61
- GRM
- 6.1
CMA / ARV
- ARV (on-the-fly)
- $439,600
- Comps found
- 12
Show comp detail 12 sales within ~0.75 mi
| Address | Dist | Beds/Ba | Sqft | Sold | Price | $/sf | Match |
|---|---|---|---|---|---|---|---|
| 151 Center St | 0.00mi | 6/3.0 | 3,140 (0%) | 0mo | $320,000 | $102 | 98 |
| 12 Newman St | 0.19mi | 6/3.0 | 2,788 (-11%) | 1mo | $510,000 | $183 | 70 |
| 19 Russell St | 0.45mi | 6/2.0 | 2,952 (-6%) | 5mo | $410,000 | $139 | 62 |
| 46 Foster St | 0.39mi | 5/3.0 (-1) | 3,337 (+6%) | 5mo | $312,000 | $93 | 60 |
| 17 Lilac St | 0.50mi | 6/2.5 | 3,365 (+7%) | 7mo | $300,000 | $89 | 59 |
| 17 Holl St | 0.60mi | 6/2.0 | 3,062 (-2%) | 11mo | $410,000 | $134 | 57 |
| 69 Foster St | 0.42mi | 6/3.0 | 2,792 (-11%) | 6mo | $450,000 | $161 | 54 |
| 91 Foster St | 0.43mi | 6/3.0 | 2,774 (-12%) | 11mo | $435,000 | $157 | 49 |
| 73 Foster St | 0.42mi | 6/3.0 | 2,750 (-12%) | 12mo | $464,300 | $169 | 48 |
| 47 Holl St | 0.60mi | 6/2.5 | 2,847 (-9%) | 11mo | $400,000 | $140 | 47 |
| 45 Eldridge St | 0.61mi | 6/2.0 | 2,720 (-13%) | 4mo | $310,000 | $114 | 44 |
| 46 School St | 0.67mi | 5/4.0 (-1) | 3,534 (+12%) | 9mo | $528,000 | $149 | 29 |
Match score weights: distance 35% · size 25% · config 20% · recency 20%. Top-matched comps best support the ARV.
Projected returns pro-forma
-3.0% appreciation · 1.97% rent growth · sell at horizon
- IRR
- 2.8%
- Equity multiple
- 1.11×
- Total profit
- $9,455
- Equity at exit
- $47,713
- IRR
- 11.3%
- Equity multiple
- 1.84×
- Total profit
- $75,480
- Equity at exit
- $27,668
Cash invested: $89,600 (down + closing). Projections, not guarantees.
Landlord ↔ Tenant lean methodology
- Overall (STATE)
- 27 Tenant-Leaning
- State Connecticut
- 27 Tenant-Leaning · D+7
- County
- — inherits STATE
- City
- — inherits STATE
ZIP-level market 06040
- Rents YoY
- 2.0%
- Active inventory
- 99
- Price-to-rent
- 12.2×
Monthly cashflow live
- Estimated rent
- $4,367 high interval (Pro) →
- Mortgage (P&I)
- −$1,678
- Tax from tax record
- −$609 /mo · $7,303/yr
- Insurance
- −$133
- HOA
- −$0
- Vacancy / Maint / Mgmt
- −$917
- Net cashflow
- $1,030
Break-even live
2-unit breakdown (identical units grouped — click to expand)
| Units | Beds | Baths | Est. rent |
|---|---|---|---|
| 2× units | 3 | 1.5 | $4,368 |
| #1 | 3 | 1.5 | $2,184 |
| #2 | 3 | 1.5 | $2,184 |
| Total (2 units) | $4,367 | ||
UW: 25.0% down · 7.5% · 30yr · 1.5% tax · 5.0% vac · 8.0% maint · 8.0% mgmt
Financing live
Cash to close
- Down payment
- $80,000
- Closing costs
- $9,600
- Reserves months
- —
- Total cash needed
- —
Loan-product check · same deal, 3 products live
Conventional
25% down · 7.5% · 30yr
- Down + closing
- —
- Monthly P&I
- —
- Monthly cashflow
- —
- DSCR
- —
- Eligible?
- —
Personal DTI + credit; lowest rate.
DSCR
20% down · 8.5% · 30yr
- Down + closing
- —
- Monthly P&I
- —
- Monthly cashflow
- —
- DSCR
- —
- Eligible?
- —
No personal income docs; deal must DSCR.
Hard money
10% down · 12.0% · 12mo
- Down + closing
- —
- Monthly P&I
- —
- Monthly cashflow
- —
- DSCR
- —
- Eligible?
- —
Short-term bridge; refi at stabilization.
Listing history 13 events
-
2026-06-13statusdays on market $320,000 Under Contract 23 DOM
-
2026-06-10days on market $320,000 Active 22 DOM
-
2026-06-09days on market $320,000 Active 21 DOM
-
2026-06-08days on market $320,000 Active 20 DOM
-
2026-06-07days on market $320,000 Active 19 DOM
-
2026-06-03days on market $320,000 Active 15 DOM
-
2026-06-02days on market $320,000 Active 14 DOM
-
2026-06-01days on market $320,000 Active 13 DOM
-
2026-05-31days on market $320,000 Active 12 DOM
-
2026-05-20$320,000 Active
-
2020-02-13soldstatus $99,000 Closed 46-char remark
Show marketing remark (46 chars)
Property sold in As-Is and Where-Is condition.
-
2019-12-20status Under Contract 46-char remark
Show marketing remark (46 chars)
Property sold in As-Is and Where-Is condition.
-
2019-12-16$99,000 Active 46-char remark
Show marketing remark (46 chars)
Property sold in As-Is and Where-Is condition.
ⓘ Source: listings_history table (triggers on properties + properties_extension) + one-shot
backfill from property_details.listing_events for pre-trigger history.
Tax reassessment forecast CT · Partial reset (capped growth)
- Current annual tax
- $7,303 · $609/mo
- Projected year-2 tax
- $7,303 · $609/mo
- Expected delta
- $0/yr ($0/mo · 0.0%)
ⓘ Screening estimate from a state-policy table — verify with the county assessor before closing.
Climate risk First Street
- Flood 1/10 Low FEMA zone X (unshaded) · 0% chance over 30 yrs
- Wildfire 1/10 Low
- Heat 5/10 Major 7 d/yr ≥95°F today · 17 d/yr by 30 yrs out
- Wind 6/10 Major 27% chance of damaging wind over 30 yrs
- Air quality 3/10 Moderate 3 unhealthy d/yr today · 4 by 30 yrs out
Nearby sold comps map
Loading sold comps map…
Walkable amenities ~0.75 mi
Loading nearby amenities…
Taxation est. · year 1
- Rental income
- $52,404
- − Mortgage interest
- −$17,925
- − Property taxes
- −$7,303
- − Insurance
- −$1,600
- − Repairs & maintenance
- −$4,192
- − Management
- −$4,192
- − Depreciation
- −$9,309
- Taxable income
- $7,882
- Est. tax owed @ 24.0%
- −$1,892
- After-tax cash flow
- $10,467/yr
For passive investors: Depreciation is non-cash, so a rental often shows a tax loss while cash-flowing — sheltering income. Rental losses are passive: they offset passive income freely, and up to $25,000/yr can offset ordinary (W-2) income if you actively participate and your MAGI is under $100k (phasing out to $0 by $150k); unused losses carry forward. On sale, claimed depreciation is recaptured at up to 25%, and gains may owe capital-gains tax (a 1031 exchange can defer both). Figures are a year-1 estimate at your 24.0% rate — not tax advice; consult a CPA.
Schools (NCES district)
- District
- Manchester School District
- NCES district ID
- 0902310
- Math proficiency
- 21% ▼ -8.00%
- Reading proficiency
- 32% ▼ -5.00%
- Median HH income
- $63,391
- Composite
- 24.54/100
- National rank
- #7643
- State rank
- #130 of 153 in CT
Livability — Manchester
- Score
- 76/100
- State rank
- #59
- US rank
- #3580
Category grades
Schools grade is shown separately in the Schools card above.
Census & demographics
- Census place
- Manchester, CT
- County
- Hartford County · 754,208 people
- City population
- 59,635
- Metro
- Hartford-East Hartford-Middletown, CT
- Population (ZIP)
- 35,813
- Household income
- $83,422
- Rent vs Own
- Severe rent burden
- 1839.0
Population outlook (Capitol County) Hauer SSP2
- By 2040
- 1,063,519
Race, ethnicity, and origin ACS 2023
- Neighborhood character
- Diverse neighborhood (Simpson 0.65)
- Race & ethnicity
- White 53% Hispanic / Latino 18% Black 15% Asian 9% Two or more races 8%
- Hispanic origin (detail)
- Puerto Rican 14%
- Common ancestry
- Romanian 5% Lithuanian 4% Slovak 1%
- Foreign-born
- 15% · Canada, Jamaica, China
- Languages at home
- 81% English-only · Spanish 8% Other Indo-European 5% Other Asian/Pacific 2%
Political lean MEDSL · Capitol
- 2024 margin
- Strong D (+21.9) · D 60.1% · R 38.2% · Other 1.7%
- All cycles
- 2024: D+21.9
Not yet ingested
- Civics
- —
Market trends
- HPI YoY
- ▼ -197.69%
- Current HPI
- 190.4204
- Rent YoY
- ▲ 1.97%
- Metro
- Hartford-East Hartford-Middletown, CT
- State GDP YoY
- ▲ 1.06%
- F500 in state
- 38
Industry mix (Fortune 500 HQ in CT)
| Industry | F500 HQs | Revenue |
|---|---|---|
| Industrial Machinery | 4 | $38B |
|
||
| Insurance | 3 | $71B |
|
||
| Financial Services | 2 | $25B |
|
||
| Transportation / Logistics | 2 | $18B |
|
||
| Healthcare | 1 | $247B |
|
||
| Telecommunications | 1 | $55B |
|
||
Price history
+223.2% since first listed4 events — show timeline
- 2026-05-20 Listed $320,000 Smart MLS
- 2020-02-13 Sold (MLS) $99,000 Smart MLS
- 2019-12-20 Pending — Smart MLS
- 2019-12-16 Listed $99,000 Smart MLS
Property tax history
+2.7%/yrLatest (2025): $7,303 · +2.9% YoY. Source: county tax records.
Cash-flow waterfall
monthlySold comps — $/sqft
last 12 mo · ≤1 miLoading sold comps…