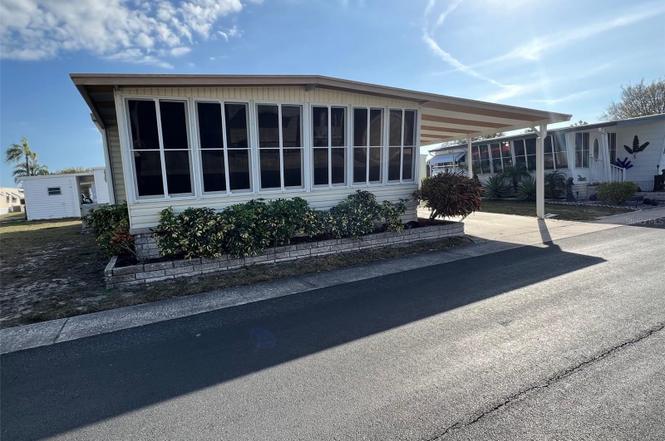
19 Pindo Palm St W · Largo, FL
Flood risk 1/10 · Minimal
- FEMA flood zone
- X (unshaded)
- Chance of flooding over 30 yrs
- 0.0%
- Est. flood insurance / yr
- $507 – $1,088
Fire risk 1/10 · Minimal
- Est. fire insurance / yr
- $947 – $1,759
Heat risk 10/10 · Severe
- Hot days now (above 108°F)
- 6 days/yr
- Hot days in 30 yrs
- 18 days/yr
Wind risk 10/10 · Severe
- Chance of severe wind over 30 yrs
- 99.0%
Air-quality risk 3/10 · Minor
- Unhealthy air days now
- 2 days/yr
- Unhealthy air days in 30 yrs
- 3 days/yr
Risk factors via First Street. Map © Google.
Why this score? — see what drove the B+ grade
The composite is a weighted blend of 9 inputs, each scored 0–100. Each bar is that input's sub-score; the figure is the points it added to the 100-point composite (weight × sub-score).
- Cash flow +30.0/30.0
- ARV discount +15.0/15.0
- 1% rule +10.0/10.0
- DSCR +10.0/10.0
- Schools +4.3/10.0
- Livability +4.1/5.0
- Condition / age +2.5/5.0
- Rent growth +1.6/5.0
- Appreciation +0.0/10.0
$49,900
🖨 Deal sheet 📄 Offer letter ✓ Due diligence
Listing remarks
Now available in the highly sought-after 55+ community of Palm Hill Country Club, this fixer-upper presents a wonderful opportunity to create the home you’ve always envisioned while enjoying an active and thriving lifestyle. The community is well known for its welcoming atmosphere and impressive selection of amenities designed for residents to stay social and engaged. A full calendar of planned activities keeps neighbors connected, while recreational options abound with three sparkling pools, shuffleboard courts, tennis courts, and the ever-popular pickleball and much, much more! Residents also appreciate the reasonable monthly maintenance fee of just $554, which conveniently includes
Key facts
- Shuffleboard courts
- Pickleball
- Tennis courts
Tags
Neighborhood map
What this means for you Summary
Snapshot
- This is a 2-bed/2.0-bath manufactured listed at $50k.
Deal economics
- At list price, monthly cash flow is $553 ($7k/yr) — positive.
- The deal already cash-flows at list — no discount required.
- Meets the 1% rule at list price ($2k rent vs $50k).
- Cap rate 19.6% vs local median 4.2% in Largo — top-decile yield for the area; either an underpriced asset or a hidden risk that comps aren't pricing in. Stress-test before assuming the spread holds.
Location & tenants
- Location reads 82/100 on livability (#82 in FL, #1,240 nationally) — a professional / high-income tenant draw. Strengths: commute A+, cost of living A+, housing A+; Watch: employment D+, amenities F.
- Pinellas (suburban): math 51% / reading 51% proficiency, ranked #31 of 73 in FL (top 42%) — acceptable for families but not a draw, mixed tenant base, ~2y average lease.
- Market conditions: Rents falling (-3.5%/yr); 217 active listings in the ZIP; 40 comparable units currently listed for rent nearby; rentals leasing fast (median 11d on market — plan ~1-2 weeks tenant-placement turnaround); 2,676 units permitted in Pinellas County in 2024 (1,422 in 5+ unit buildings).
- This rent runs 37% of the median local income ($60k/yr) — at the standard rent-burdened threshold; future hikes will face affordability resistance.
Forward outlook
- Local home prices are declining (-3.0%/yr); year-one equity from $345 of loan paydown is wiped out by about $1k of value loss. Plan a longer hold.
- Pinellas County population projected at +14% by 2050 — modest demand growth; plan on rents tracking national, not racing it.
- At projected returns (-3.0% appreciation + 0.0% rent growth), your $14k cash investment doubles in ~3 years — after that, you're playing with house money.
Negotiation context
- Only 3 days on market — expect competitive offers; lowballing is unlikely to land.
Risks & watch-outs
- Watch-outs: HOA is 30% of rent.
- Climate carrying-cost: severe wind risk, 99% chance of damaging wind over 30y; extreme-heat days projected 6→18/yr by 2055 (HVAC capex compounding) — expect insurance premiums to compound above CPI over the hold.
Questions for the listing agent
- Built in 1971 — when were the roof, HVAC, electrical panel, plumbing, and water heater last replaced?
- What does the HOA fee cover, when was the last increase, and are there any pending special assessments or reserve-fund shortfalls?
- Is there a deadline driving the sale (1031 exchange, divorce, estate, relocation)? That informs how much negotiation room exists.
- What's the average days-on-market for RENTAL listings here right now (not sales)? A rising rental-DOM trend means longer vacancies and softer asking-rent achievability than the comps imply.
- What's the recent tenant-quality profile in this submarket — average credit score on applications, eviction rate, late-payment / NSF rate, and stable-employment percentage? A property-management company in the area should have these aggregated.
- How much new for-sale + rental construction is in the pipeline within 1–3 miles? Heavy new supply typically softens prices + rents 12–24 months out; constrained supply supports both.
Investment metrics
- 1% rule
- 3.68% ✓
- Cap rate
- 19.59%
- Cash-on-cash
- 47.49%
- DSCR
- 3.11
- GRM
- 2.3
CMA / ARV
- ARV (on-the-fly)
- $73,872
- Comps found
- 12
Show comp detail 12 sales within ~0.75 mi
| Address | Dist | Beds/Ba | Sqft | Sold | Price | $/sf | Match |
|---|---|---|---|---|---|---|---|
| 19 Pindo Palm St W | 0.00mi | 2/1.5 | 912 (0%) | 1mo | $40,000 | $44 | 97 |
| 13 Frangipani Cir | 0.19mi | 2/2.0 | 864 (-5%) | 11mo | $75,000 | $87 | 73 |
| 71 Royal Palm Cir | 0.60mi | 2/2.0 | 912 (0%) | 0mo | $72,000 | $79 | 72 |
| 79 Thatch Palm St W | 0.38mi | 2/2.0 | 944 (+4%) | 12mo | $65,000 | $69 | 67 |
| 574 Queen Palm St | 0.63mi | 2/2.0 | 948 (+4%) | 1mo | $109,500 | $116 | 63 |
| 38 Pindo Palm St E | 0.31mi | 2/2.0 | 864 (-5%) | 19mo | $135,000 | $156 | 61 |
| 309 Sago Palm St | 0.60mi | 2/2.0 | 952 (+4%) | 6mo | $65,000 | $68 | 60 |
| 21 Frangipani Cir | 0.24mi | 2/2.0 | 785 (-14%) | 9mo | $49,000 | $62 | 58 |
| 724 Sugar Palm St | 0.67mi | 2/2.0 | 948 (+4%) | 9mo | $47,500 | $50 | 55 |
| 624 Queen Palm St | 0.64mi | 2/2.0 | 945 (+4%) | 12mo | $150,000 | $159 | 54 |
| 266 Sago Palm St | 0.56mi | 2/2.0 | 952 (+4%) | 19mo | $77,000 | $81 | 51 |
| 135 Royal Palm Cir | 0.64mi | 2/2.0 | 1,008 (+10%) | 14mo | $149,000 | $148 | 41 |
Match score weights: distance 35% · size 25% · config 20% · recency 20%. Top-matched comps best support the ARV.
Projected returns pro-forma
-3.0% appreciation · 0.0% rent growth · sell at horizon
- IRR
- 39.6%
- Equity multiple
- 2.58×
- Total profit
- $22,112
- Equity at exit
- $7,440
- IRR
- 43.6%
- Equity multiple
- 4.24×
- Total profit
- $45,282
- Equity at exit
- $4,314
Cash invested: $13,972 (down + closing). Projections, not guarantees.
Landlord ↔ Tenant lean methodology
- Overall (STATE)
- 87 Strongly Landlord-Friendly
- State Florida
- 87 Strongly Landlord-Friendly · R+3
- County
- — inherits STATE
- City
- — inherits STATE
ZIP-level market 33770
- Rents YoY
- -3.5%
- Active inventory
- 217
- Price-to-rent
- 2.3×
Monthly cashflow live
- Estimated rent
- $1,838 high interval (Pro) →
- Mortgage (P&I)
- −$262
- Tax est. 1.5%
- −$62 /mo · $748/yr
- Insurance
- −$21
- HOA
- −$554
- Vacancy / Maint / Mgmt
- −$386
- Net cashflow
- $553
Break-even live
UW: 25.0% down · 7.5% · 30yr · 1.5% tax · 5.0% vac · 8.0% maint · 8.0% mgmt
Financing live
Cash to close
- Down payment
- $12,475
- Closing costs
- $1,497
- Reserves months
- —
- Total cash needed
- —
Loan-product check · same deal, 3 products live
Conventional
25% down · 7.5% · 30yr
- Down + closing
- —
- Monthly P&I
- —
- Monthly cashflow
- —
- DSCR
- —
- Eligible?
- —
Personal DTI + credit; lowest rate.
DSCR
20% down · 8.5% · 30yr
- Down + closing
- —
- Monthly P&I
- —
- Monthly cashflow
- —
- DSCR
- —
- Eligible?
- —
No personal income docs; deal must DSCR.
Hard money
10% down · 12.0% · 12mo
- Down + closing
- —
- Monthly P&I
- —
- Monthly cashflow
- —
- DSCR
- —
- Eligible?
- —
Short-term bridge; refi at stabilization.
Rent comps 40 comps
| Address | Beds | Baths | Sqft | Rent | $/sqft | DOM | Units | Dist |
|---|---|---|---|---|---|---|---|---|
| 910 9th Ave SW Largo, FL | 3.0 | 2.0 | 1120 | $2,100 | $1.88 | 4d | 1 | 0.27mi |
| 911 Washington Ave #212 Largo, FL | 2.0 | 2.0 | 885 | $1,675 | $1.89 | 4d | 1 | 0.43mi |
| 157 2nd Ave SW Unit A Largo, FL | 2.0 | 1.0 | 678 | $1,600 | $2.36 | 24d | 1 | 0.45mi |
| 253 Sago Palm St Largo, FL | 2.0 | 2.0 | 1000 | $1,295 | $1.29 | 24d | 1 | 0.62mi |
| 417 Woodrow Ave Largo, FL | 1.0 | 1.0 | 650 | $1,175 | $1.81 | 18d | 1 | 0.69mi |
| 264 Ridge Rd N Largo, FL | 3.0 | 1.5 | 981 | $2,400 | $2.45 | 24d | 1 | 0.69mi |
| 1201 Seminole Blvd Largo, FL | 1.0–3.0 | 1.0–2.0 | 1067 | $1,870 | $1.75 | 2d | 1 | 0.69mi |
| 775 Royal Palm Cir Largo, FL | 2.0 | 2.0 | 1008 | $1,700 | $1.69 | 4d | 1 | 0.70mi |
| 605 4th Ave NW Largo, FL | 1.0–2.0 | 1.0–2.0 | 1032 | $2,350 | $2.28 | 3d | 6 | 0.77mi |
| 1320 1st Ave NW Largo, FL | 2.0 | 1.0 | 1100 | $2,100 | $1.91 | 24d | 1 | 0.78mi |
| 2131 Ridge Rd S #105 Largo, FL | 2.0 | 1.5 | 1035 | $1,850 | $1.79 | 24d | 1 | 0.79mi |
| 1500 West Bay Dr Largo, FL | 2.0 | 1.0 | 740 | $1,595 | $2.16 | 15d | 1 | 0.83mi |
| 428 4th St NW Largo, FL | 2.0 | 1.0 | 850 | $1,900 | $2.24 | 24d | 1 | 0.85mi |
| 423 4th St NW Largo, FL | 3.0 | 1.0 | 960 | $1,500 | $1.56 | 4d | 1 | 0.85mi |
| 2098 Seminole Blvd Largo, FL | 1.0–3.0 | 1.0–2.0 | 1018 | $2,395 | $2.35 | 3d | 23 | 0.86mi |
| 705 Redbud LN Largo, FL | 1.0–2.0 | 1.0–2.0 | 986 | $2,615 | $2.65 | 2d | 189 | 0.88mi |
| 556 Clearwater Largo Rd Unit 1 Largo, FL | 2.0 | 1.0 | 750 | $1,600 | $2.13 | 2d | 1 | 0.89mi |
| 558 Clearwater Largo Rd Unit 1 Largo, FL | 1.0 | 1.0 | 620 | $1,400 | $2.26 | 2d | 1 | 0.89mi |
| 13333 Ridge Rd Largo, FL | 1.0–2.0 | 1.0–1.5 | 860 | $1,765 | $2.05 | 8d | 1 | 1.05mi |
| 1448 Oak St Largo, FL | 2.0 | 2.0 | 1070 | $2,300 | $2.15 | 4d | 1 | 1.06mi |
| 705 3rd Ave NE Unit C Largo, FL | 3.0 | 2.0 | 1113 | $2,195 | $1.97 | 3d | 1 | 1.10mi |
| 1975 West Bay Dr #115 Largo, FL | 1.0 | 1.0 | 630 | $1,495 | $2.37 | 24d | 1 | 1.11mi |
| 2101 West Bay Dr Largo, FL | 2.0 | 1.0 | 1000 | $1,650 | $1.65 | 4d | 1 | 1.12mi |
| 2272 16th Ave SW Unit C Largo, FL | 2.0 | 1.0 | 1031 | $2,600 | $2.52 | 24d | 1 | 1.13mi |
| 516 5th Ave NE Largo, FL | 3.0 | 2.0 | 1057 | $2,250 | $2.13 | 24d | 1 | 1.13mi |
| 516 5th Ave NE Largo, FL | 3.0 | 2.0 | 1073 | $2,250 | $2.10 | 15d | 1 | 1.13mi |
| 2167 Dart Ave Unit 7 Largo, FL | 1.0 | 1.0 | 639 | $1,395 | $2.18 | 12d | 1 | 1.14mi |
| 2167 Dart Ave Unit 6 Largo, FL | 1.0 | 1.0 | 630 | $1,495 | $2.37 | 13d | 1 | 1.14mi |
| 447 6th Ave NE Unit B Largo, FL | 2.0 | 1.0 | 840 | $1,650 | $1.96 | 11d | 1 | 1.15mi |
| 1753 Belleair Forest Dr Unit D7 Belleair, FL | 2.0 | 2.0 | 1068 | $1,800 | $1.69 | 24d | 1 | 1.17mi |
| 1100 East Bay Dr #104 Largo, FL | 2.0 | 2.0 | 840 | $1,950 | $2.32 | 4d | 1 | 1.20mi |
| 1825 134th Ave Largo, FL | 3.0 | 2.0 | 1005 | $2,200 | $2.19 | 24d | 1 | 1.20mi |
| 2301 West Bay Dr Largo, FL | 1.0 | 1.0 | 600 | $1,375 | $2.29 | 24d | 1 | 1.21mi |
| 1741 Trotter Rd Unit A Largo, FL | 2.0 | 1.0 | 800 | $1,350 | $1.69 | 24d | 1 | 1.22mi |
| 1040 Clearwater Largo Rd Apt 411 Largo, FL | 1.0 | 1.0 | 696 | $1,650 | $2.37 | 4d | 1 | 1.22mi |
| 1030 Clearwater Largo Rd N Largo, FL | 2.0 | 1.0 | 849 | $1,875 | $2.21 | 24d | 1 | 1.22mi |
| 11960 133rd Ave Largo, FL | 3.0 | 1.0 | 936 | $2,150 | $2.30 | 8d | 1 | 1.23mi |
| 811 Rosery Rd NW Largo, FL | 1.0–3.0 | 1.0–3.0 | 1050 | $2,538 | $2.42 | 3d | 20 | 1.27mi |
| 641 Mehlenbacher Rd Unit 1/2 Belleair Bluffs, FL | 2.0 | 1.0 | 900 | $1,350 | $1.50 | 3d | 1 | 1.28mi |
| 1517 16th Cir SE Largo, FL | 1.0 | 1.0 | 625 | $1,250 | $2.00 | 4d | 1 | 1.30mi |
HOA detail
- Monthly dues
- $554 · $6,648/yr
- Likely covers
- pool
Listing history 3 events
-
2026-03-12status Pending
-
2026-03-08$49,900 Active
-
2006-07-01soldstatus $55,000
ⓘ Source: listings_history table (triggers on properties + properties_extension) + one-shot
backfill from property_details.listing_events for pre-trigger history.
Climate risk First Street
- Flood 1/10 Low FEMA zone X (unshaded) · 0% chance over 30 yrs
- Wildfire 1/10 Low
- Heat 10/10 Extreme 6 d/yr ≥108°F today · 18 d/yr by 30 yrs out
- Wind 10/10 Extreme 99% chance of damaging wind over 30 yrs
- Air quality 3/10 Moderate 2 unhealthy d/yr today · 3 by 30 yrs out
Nearby sold comps map
Loading sold comps map…
Walkable amenities ~0.75 mi
Loading nearby amenities…
Taxation est. · year 1
- Rental income
- $22,052
- − Mortgage interest
- −$2,795
- − Property taxes
- −$748
- − Insurance
- −$250
- − Repairs & maintenance
- −$1,764
- − Management
- −$1,764
- − HOA
- −$6,648
- − Depreciation
- −$1,452
- Taxable income
- $6,631
- Est. tax owed @ 24.0%
- −$1,591
- After-tax cash flow
- $5,043/yr
For passive investors: Depreciation is non-cash, so a rental often shows a tax loss while cash-flowing — sheltering income. Rental losses are passive: they offset passive income freely, and up to $25,000/yr can offset ordinary (W-2) income if you actively participate and your MAGI is under $100k (phasing out to $0 by $150k); unused losses carry forward. On sale, claimed depreciation is recaptured at up to 25%, and gains may owe capital-gains tax (a 1031 exchange can defer both). Figures are a year-1 estimate at your 24.0% rate — not tax advice; consult a CPA.
Schools (NCES district)
- District
- Pinellas
- NCES district ID
- 1201560
- Math proficiency
- 51% ▼ -5.00%
- Reading proficiency
- 51% ▼ -3.00%
- Median HH income
- $46,270
- Composite
- 43.27/100
- National rank
- #3046
- State rank
- #31 of 73 in FL
Livability — Largo
- Score
- 82/100
- State rank
- #82
- US rank
- #1240
Category grades
Schools grade is shown separately in the Schools card above.
Census & demographics
- Census place
- Largo, FL
- County
- Pinellas County · 939,478 people
- City population
- 106,311
- Metro
- Tampa-St. Petersburg-Clearwater, FL
- Population (ZIP)
- 25,368
- Household income
- $59,815
- Rent vs Own
- Severe rent burden
- 1404.0
Population outlook (Pinellas County) Hauer SSP2
- Today (2025)
- 1,027,532 people
- By 2030
- 1,063,586 · +3.5%
- By 2040
- 1,125,020 · +9.5%
- By 2050
- 1,168,637 · +13.7%
- By 2075
- 1,265,188 · +23.1%
- By 2100
- 1,260,357 · +22.7%
Race, ethnicity, and origin ACS 2023
- Neighborhood character
- Predominantly White (75%)
- Race & ethnicity
- White 75% Hispanic / Latino 11% Two or more races 9% Black 8% Asian 1%
- Hispanic origin (detail)
- Mexican 3% Puerto Rican 3% Cuban 2%
- Common ancestry
- Lithuanian 3% Romanian 2% Slovak 2%
- Foreign-born
- 9% · Canada, Jamaica
- Languages at home
- 89% English-only · Spanish 5% Other Indo-European 2% German/W. Germanic 1%
Political lean MEDSL · Pinellas
- 2024 margin
- Lean R (+5.2) · D 46.9% · R 52.1%
- 2008→2024 swing
- -13.5pp toward R · 2008: 8.3pp · 2024: -5.2pp
- All cycles
- 2024: R+5.2 2020: D+0.2 2016: R+1.1 2012: D+5.6 2008: D+8.3
Not yet ingested
- Civics
- —
Market trends
- HPI YoY
- ▼ -317.05%
- Current HPI
- 353.8484
- Rent YoY
- ▼ -3.47%
- Metro
- Tampa-St. Petersburg-Clearwater, FL
- State GDP YoY
- ▲ 3.28%
- F500 in state
- 36
Industry mix (Fortune 500 HQ in FL)
| Industry | F500 HQs | Revenue |
|---|---|---|
| Industrial Technology | 2 | $29B |
|
||
| Insurance | 2 | $17B |
|
||
| Retail | 1 | $60B |
|
||
| Technology Distribution | 1 | $58B |
|
||
| Homebuilding | 1 | $35B |
|
||
| Technology Manufacturing | 1 | $35B |
|
||
Price history
-9.3% since first listed3 events — show timeline
- 2026-03-12 Pending — Stellar MLS as Distributed by MLS Grid
- 2026-03-08 Listed $49,900 Stellar MLS as Distributed by MLS Grid
- 2006-07-01 Sold (Public Records) $55,000 Public Records
Property tax history
-14.6%/yrLatest (2025): $69 · +31.5% YoY. Source: county tax records.
Cash-flow waterfall
monthlySold comps — $/sqft
last 12 mo · ≤1 miLoading sold comps…