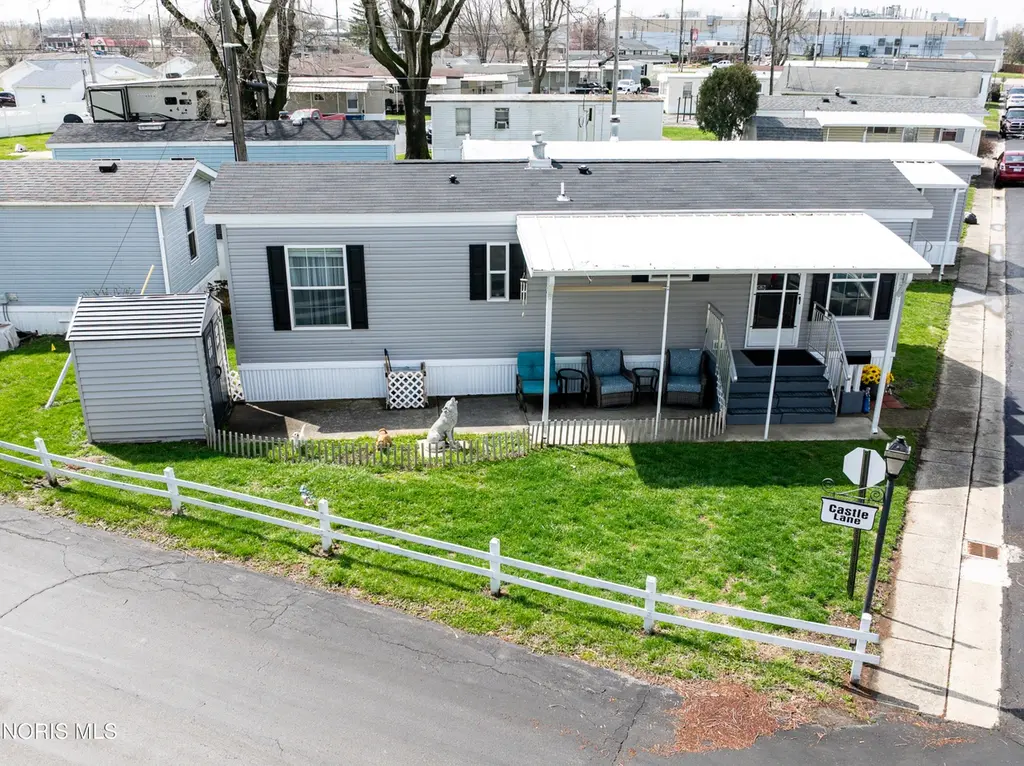
1451 Oak Harbor Rd Unit 32a · Fremont, OH
Flood risk 1/10 · Minimal
- FEMA flood zone
- X (unshaded)
- Chance of flooding over 30 yrs
- 0.0%
- Est. flood insurance / yr
- $507 – $1,088
Fire risk 1/10 · Minimal
- Est. fire insurance / yr
- $713 – $1,323
Heat risk 3/10 · Minor
- Hot days now (above 98°F)
- 7 days/yr
- Hot days in 30 yrs
- 17 days/yr
Wind risk 2/10 · Minimal
- Chance of severe wind over 30 yrs
- —
Air-quality risk 2/10 · Minimal
- Unhealthy air days now
- 1 days/yr
- Unhealthy air days in 30 yrs
- 1 days/yr
Risk factors via First Street. Map © Google.
Why this score? — see what drove the B grade
The composite is a weighted blend of 9 inputs, each scored 0–100. Each bar is that input's sub-score; the figure is the points it added to the 100-point composite (weight × sub-score).
- Cash flow +30.0/30.0
- 1% rule +10.0/10.0
- DSCR +10.0/10.0
- ARV discount +7.5/15.0
- Condition / age +4.0/5.0
- Livability +3.7/5.0
- Schools +3.3/10.0
- Rent growth +2.5/5.0
- Appreciation +0.0/10.0
$54,900
🖨 Deal sheet 📄 Offer letter ✓ Due diligence
Listing remarks MLS
Discover the perfect blend of comfort and style in this meticulously maintained 1-bedroom, 1 bath manufactured home. Located in the desirable Young's Colonial Acres, this home offers a bright, airy atmosphere with modern upgrades throughout. Chef's kitchen: The heart of the home features stunning white cabinetry and sleek laminate counter tops. Moving in is a breeze, as all kitchen appliances stay!Seamless Flooring: Enjoy the contemporary look and easy maintenance of laminate wood flowing that flows beautifully through every room. Move in ready: This home is truly turnkey. The washer and Dryer stay, along with all window curtains, saving time and expense. Shed Stays!
Key facts
- 10.21 acre lot
- 2 parking spots
- Built 2023
Neighborhood map
What this means for you Summary
Snapshot
- This is a 1-bed/1.0-bath manufactured listed at $55k. Condition is rated good.
Deal economics
- At list price, monthly cash flow is $279 ($3k/yr) — positive.
- The deal already cash-flows at list — no discount required.
- Meets the 1% rule at list price ($834 rent vs $55k).
- Recommended offer: $52k (6.0% below list) — sets the bar for market timing.
- Cap rate 12.4% vs local median 5.3% in Fremont — top-decile yield for the area; either an underpriced asset or a hidden risk that comps aren't pricing in. Stress-test before assuming the spread holds.
Location & tenants
- Location reads 74/100 on livability (#283 in OH, #4,637 nationally) — a middle-class / working-renter tenant base. Strengths: cost of living A+, housing A+, health & safety A+; Watch: amenities F, commute F, employment F.
- Fremont City (town): math 35% / reading 44% proficiency, ranked #543 of 656 in OH (top 83%) — families likely to look elsewhere, expect single-tenant / working-renter base with shorter leases.
- Market conditions: 88 active listings in the ZIP; 1 comparable units currently listed for rent nearby; 23 units permitted in Sandusky County in 2024 (0 in 5+ unit buildings).
- This rent is only 16% of the median local income ($63k/yr) — well below the 30% rent-burden line; pricing power to push rent on renewal without tenant pushback.
Forward outlook
- Local home prices are declining (-3.0%/yr); year-one equity from $380 of loan paydown is wiped out by about $2k of value loss. Plan a longer hold.
- Sandusky County population projected at -17% by 2050 — secular population decline; favor cash flow + early exit over multi-decade hold.
- At projected returns (-3.0% appreciation + 3.0% rent growth), your $15k cash investment doubles in ~6 years — after that, you're playing with house money.
Negotiation context
- It's been on market 76 days — a 6% lower offer ($52k) is reasonable based on typical stale-listing flexibility.
- 2 sale attempts with the ask held roughly flat each time — persistent listings suggest the price (not the market) is what's stuck; bring a comps-based counter.
Questions for the listing agent
- It's been on market 76 days. Have you received any prior offers? Is the seller open to a 6% concession, seller financing, or rate buy-down credit?
- Why hasn't it sold? Are there any deal-killer items the seller is aware of (foundation, flood, title, zoning, code violations)?
- Is there a deadline driving the sale (1031 exchange, divorce, estate, relocation)? That informs how much negotiation room exists.
- Schools are B-rated — typically a magnet for longer-tenancy family renters. What's the average tenant stay here, and is there a school-zone premium baked into asking?
- What's the average days-on-market for RENTAL listings here right now (not sales)? A rising rental-DOM trend means longer vacancies and softer asking-rent achievability than the comps imply.
- What's the recent tenant-quality profile in this submarket — average credit score on applications, eviction rate, late-payment / NSF rate, and stable-employment percentage? A property-management company in the area should have these aggregated.
- How much new for-sale + rental construction is in the pipeline within 1–3 miles? Heavy new supply typically softens prices + rents 12–24 months out; constrained supply supports both.
Investment metrics
- 1% rule
- 1.52% ✓
- Cap rate
- 12.40%
- Cash-on-cash
- 21.82%
- DSCR
- 1.97
- GRM
- 5.5
CMA / ARV
No comps found within radius.
Projected returns pro-forma
-3.0% appreciation · 3.0% rent growth · sell at horizon
- IRR
- 14.5%
- Equity multiple
- 1.58×
- Total profit
- $8,915
- Equity at exit
- $8,186
- IRR
- 23.2%
- Equity multiple
- 3.00×
- Total profit
- $30,733
- Equity at exit
- $4,747
Cash invested: $15,372 (down + closing). Projections, not guarantees.
Landlord ↔ Tenant lean methodology
- Overall (STATE)
- 73 Landlord-Friendly
- State Ohio
- 73 Landlord-Friendly · R+6
- County
- — inherits STATE
- City
- — inherits STATE
ZIP-level market 43420
- Home prices YoY
- -32.4%
- Active inventory
- 88
- Price-to-rent
- 5.5×
Monthly cashflow live
- Estimated rent
- $834 medium interval (Pro) →
- Mortgage (P&I)
- −$288
- Tax est. 1.5%
- −$69 /mo · $824/yr
- Insurance
- −$23
- HOA
- −$0
- Vacancy / Maint / Mgmt
- −$175
- Net cashflow
- $279
Break-even live
UW: 25.0% down · 7.5% · 30yr · 1.5% tax · 5.0% vac · 8.0% maint · 8.0% mgmt
Financing live
Cash to close
- Down payment
- $13,725
- Closing costs
- $1,647
- Reserves months
- —
- Total cash needed
- —
Loan-product check · same deal, 3 products live
Conventional
25% down · 7.5% · 30yr
- Down + closing
- —
- Monthly P&I
- —
- Monthly cashflow
- —
- DSCR
- —
- Eligible?
- —
Personal DTI + credit; lowest rate.
DSCR
20% down · 8.5% · 30yr
- Down + closing
- —
- Monthly P&I
- —
- Monthly cashflow
- —
- DSCR
- —
- Eligible?
- —
No personal income docs; deal must DSCR.
Hard money
10% down · 12.0% · 12mo
- Down + closing
- —
- Monthly P&I
- —
- Monthly cashflow
- —
- DSCR
- —
- Eligible?
- —
Short-term bridge; refi at stabilization.
Rent comps 1 comps
| Address | Beds | Baths | Sqft | Rent | $/sqft | DOM | Units | Dist |
|---|---|---|---|---|---|---|---|---|
| 1528 North St Fremont, OH | 2.0 | 1.0 | 750 | $834 | $1.11 | 43d | 1 | 0.21mi |
Listing history 17 events
-
2026-06-18days on market $54,900 Active 76 DOM
-
2026-06-17days on market $54,900 Active 75 DOM
-
2026-06-16days on market $54,900 Active 74 DOM
-
2026-06-15days on market $54,900 Active 73 DOM
-
2026-06-13days on market $54,900 Active 71 DOM
-
2026-06-12days on market $54,900 Active 70 DOM
-
2026-06-09days on market $54,900 Active 67 DOM
-
2026-06-08days on market $54,900 Active 66 DOM
-
2026-06-08days on market $54,900 Active 65 DOM
-
2026-06-07days on market $54,900 Active 64 DOM
-
2026-06-04days on market $54,900 Active 61 DOM
-
2026-06-02days on market $54,900 Active 60 DOM
-
2026-06-01days on market $54,900 Active 59 DOM
-
2026-05-31days on market $54,900 Active 58 DOM
-
2026-05-31price $54,900 Active 57 DOM
-
2026-04-02$57,500 Active 675-char remark
Show marketing remark (241 chars)
Discover the perfect blend of comfort and style in this meticulously maintained 1-bedroom, 1 bath manufactured home. Located in the desirable Young's Colonial Acres, this home offers a bright, airy atmosphere with modern upgrades throughout.
-
2026-04-02$57,500 Active 241-char remark
Show marketing remark (241 chars)
Discover the perfect blend of comfort and style in this meticulously maintained 1-bedroom, 1 bath manufactured home. Located in the desirable Young's Colonial Acres, this home offers a bright, airy atmosphere with modern upgrades throughout.
ⓘ Source: listings_history table (triggers on properties + properties_extension) + one-shot
backfill from property_details.listing_events for pre-trigger history.
Climate risk First Street
- Flood 1/10 Low FEMA zone X (unshaded) · 0% chance over 30 yrs
- Wildfire 1/10 Low
- Heat 3/10 Moderate 7 d/yr ≥98°F today · 17 d/yr by 30 yrs out
- Wind 2/10 Low
- Air quality 2/10 Low 1 unhealthy d/yr today · 1 by 30 yrs out
Nearby sold comps map
Loading sold comps map…
Walkable amenities ~0.75 mi
Loading nearby amenities…
Taxation est. · year 1
- Rental income
- $10,008
- − Mortgage interest
- −$3,075
- − Property taxes
- −$824
- − Insurance
- −$274
- − Repairs & maintenance
- −$801
- − Management
- −$801
- − Depreciation
- −$1,597
- Taxable income
- $2,636
- Est. tax owed @ 24.0%
- −$633
- After-tax cash flow
- $2,721/yr
For passive investors: Depreciation is non-cash, so a rental often shows a tax loss while cash-flowing — sheltering income. Rental losses are passive: they offset passive income freely, and up to $25,000/yr can offset ordinary (W-2) income if you actively participate and your MAGI is under $100k (phasing out to $0 by $150k); unused losses carry forward. On sale, claimed depreciation is recaptured at up to 25%, and gains may owe capital-gains tax (a 1031 exchange can defer both). Figures are a year-1 estimate at your 24.0% rate — not tax advice; consult a CPA.
Condition & rehab AI · 13 photos
This well-maintained, updated manufactured home in a desirable location offers a bright, modern living space with minimal repairs needed.
Value-add opportunities
- Resale paint exterior — enhances curb appeal
- Both update landscaping — improves curb appeal and adds value
- Both install smart home devices — increases home's marketability and convenience
Renovation cost estimate screening
Value-add ROI direction
- Resale paint exterior — enhances curb appeal ↑
- Both update landscaping — improves curb appeal and adds value ↑
- Both install smart home devices — increases home's marketability and convenience ↑
ⓘ Cost ranges are severity-bucket heuristics (US national rule-of-thumb). Get contractor quotes + a written scope before underwriting a rehab budget.
Schools (NCES district)
- District
- Fremont City
- NCES district ID
- 3904401
- Math proficiency
- 35% ▼ -27.00%
- Reading proficiency
- 44% ▼ -13.00%
- Median HH income
- $44,046
- Composite
- 33.48/100
- National rank
- #5449
- State rank
- #543 of 656 in OH
Livability — Fremont
- Score
- 74/100
- State rank
- #283
- US rank
- #4637
Category grades
Schools grade is shown separately in the Schools card above.
Census & demographics
- Census place
- Fremont, OH
- County
- Sandusky · 51,886 people
- City population
- 29,400
- Population (ZIP)
- 29,400
- Household income
- $62,802
- Rent vs Own
- Severe rent burden
- 10.4
Population outlook (Sandusky County) Hauer SSP2
- Today (2025)
- 57,409 people
- By 2030
- 55,791 · -2.8%
- By 2040
- 51,837 · -9.7%
- By 2050
- 47,712 · -16.9%
- By 2075
- 39,908 · -30.5%
- By 2100
- 33,171 · -42.2%
Race, ethnicity, and origin ACS 2023
- Neighborhood character
- Predominantly White (76%)
- Race & ethnicity
- White 76% Hispanic / Latino 14% Two or more races 9% Black 5%
- Hispanic origin (detail)
- Mexican 12%
- Common ancestry
- Romanian 3% Lithuanian 2% Slovak 1%
- Foreign-born
- 2% · Canada
- Languages at home
- 94% English-only · Spanish 5%
Political lean MEDSL · Sandusky
- 2024 margin
- Solid R (+30.9) · D 34.1% · R 65.0%
- 2008→2024 swing
- -35.5pp toward R · 2008: 4.6pp · 2024: -30.9pp
- All cycles
- 2024: R+30.9 2020: R+27.6 2016: R+23.0 2012: D+1.9 2008: D+4.6
Not yet ingested
- Civics
- —
Market trends
- HPI YoY
- ▼ -90.51%
- Current HPI
- 188.5274
- Rent YoY
- —
- Metro
- —
- State GDP YoY
- ▲ 1.98%
- F500 in state
- 48
Industry mix (Fortune 500 HQ in OH)
| Industry | F500 HQs | Revenue |
|---|---|---|
| Insurance | 3 | $145B |
|
||
| Industrial Machinery | 3 | $49B |
|
||
| Financial Services | 3 | $24B |
|
||
| Consumer Goods | 2 | $93B |
|
||
| Aerospace / Defense | 2 | $47B |
|
||
| Utilities | 2 | $33B |
|
||
Price history
+0.0% since first listed2 events — show timeline
- 2026-04-02 Listed $57,500 NORIS
- 2026-04-02 Listed $57,500 FAOR
Cash-flow waterfall
monthlySold comps — $/sqft
last 12 mo · ≤1 miLoading sold comps…