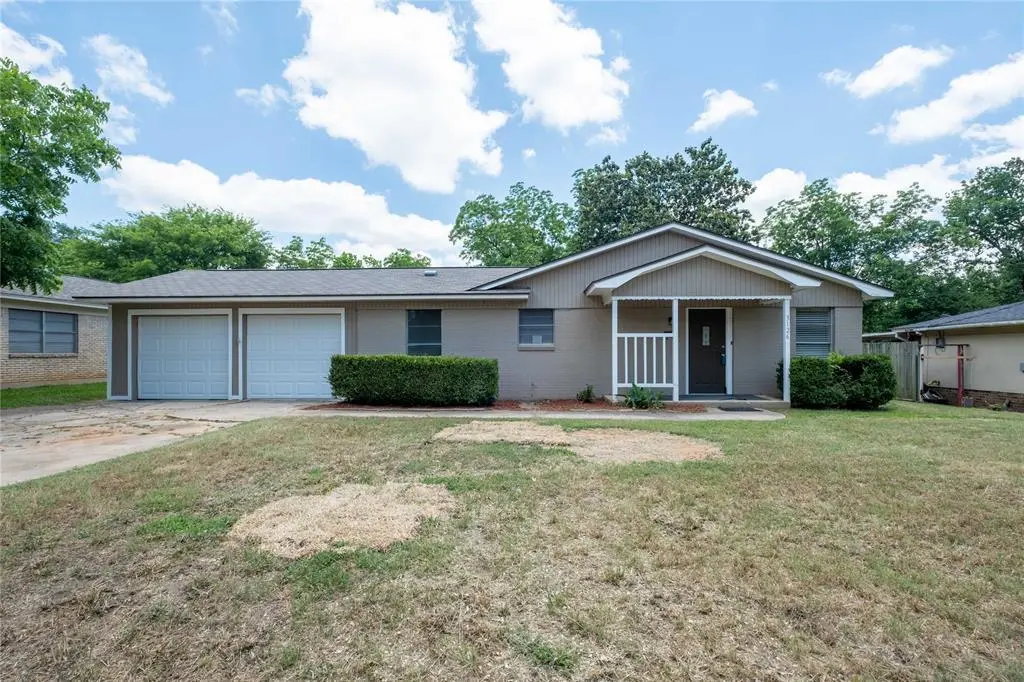
3126 Colgate Ave · Tyler, TX
Flood risk 1/10 · Minimal
- FEMA flood zone
- X (unshaded)
- Chance of flooding over 30 yrs
- 0.0%
- Est. flood insurance / yr
- $507 – $1,088
Fire risk 1/10 · Minimal
- Est. fire insurance / yr
- $1,222 – $2,270
Heat risk 6/10 · Moderate
- Hot days now (above 109°F)
- 7 days/yr
- Hot days in 30 yrs
- 26 days/yr
Wind risk 6/10 · Moderate
- Chance of severe wind over 30 yrs
- 61.0%
Air-quality risk 2/10 · Minimal
- Unhealthy air days now
- 0 days/yr
- Unhealthy air days in 30 yrs
- 1 days/yr
Risk factors via First Street. Map © Google.
Why this score? — see what drove the D+ grade
The composite is a weighted blend of 9 inputs, each scored 0–100. Each bar is that input's sub-score; the figure is the points it added to the 100-point composite (weight × sub-score).
- ARV discount +15.0/15.0
- Cash flow +13.4/30.0
- DSCR +4.0/10.0
- Livability +3.8/5.0
- 1% rule +3.7/10.0
- Rent growth +3.4/5.0
- Schools +3.3/10.0
- Condition / age +2.5/5.0
- Appreciation +0.0/10.0
$239,900
🖨 Deal sheet 📄 Offer letter ✓ Due diligence
Listing remarks MLS
3126 Colgate Avenue in Tyler offers the kind of flexible layout that is hard to find, with 4 bedrooms, including a private mother-in-law suite with its own exterior entrance. The main side of the home features the primary living areas and three bedrooms. At the same time, the separate suite provides an ideal setup for guests, extended family, a home office, or additional privacy. Recent updates add even more appeal, including brand new garage doors, epoxy flooring in the garage, and new flooring and paint in the mother-in-law suite. The suite and garage layout has also been reconfigured, giving the space a fresh, more functional feel. The home offers a classic kitchen, comfortable living spaces, ample parking, and a fully fenced backyard. Tucked into a quiet Tyler neighborhood, this property blends practical updates, privacy, and versatility in a way that works for a variety of needs. Schedule your showing today and come see the possibilities!
Key facts
- New flooring
- New paint
- Exterior entrance
Tags
Property features AI
Finance
- Other: Possession available 30–60 days or at closing/funding; Standard listing conditions; Exclusive right to sell
- Financial info: Listing accepts cash and conventional financing; No second mortgage indicated
- HOA & community: No HOA / association
Exterior
- Parking: Attached 2-car garage; 2 covered parking spaces
- Security: Audio and video recording consent for visitors / surveillance devices present
- Utilities: City water; City sewer; Not in a municipal utility district
- Home design: Single-family residence; Residential property; Attached property; Built in 1958
- Construction: Wood construction; Composition roof; Slab foundation
- Exterior features: Patio; Storage; Chain link fencing; Lot smaller than 0.5 acre
Interior
- Kitchen: Electric range
- Bedrooms: 4 bedrooms (primary bedroom on main level)
- Bathrooms: 3 full bathrooms
- Heating & cooling: Heat pump; Central air; Ceiling fans; Electric cooling components
- Interior features: One-level layout; One living area; One dining area; Other interior features
Neighborhood map
What this means for you Summary
Snapshot
- This is a 4-bed/2.0-bath single-family listed at $240k.
Deal economics
- At list price, monthly cash flow is $5 ($57/yr) — positive.
- The deal already cash-flows at list — no discount required.
- To meet the 1% rule (rent ≥ 1% of price), the offer needs to be $210k (12.5% below list).
- Recommended offer: $210k (12.5% below list) — sets the bar for 1% rule.
- Cap rate 6.3% vs local median 3.6% in Tyler — top-decile yield for the area; either an underpriced asset or a hidden risk that comps aren't pricing in. Stress-test before assuming the spread holds.
Location & tenants
- Location reads 75/100 on livability (#147 in TX, #4,181 nationally) — a middle-class / working-renter tenant base. Strengths: cost of living A+, housing A+, health & safety A+; Watch: employment C-, crime D+, commute F.
- Tyler ISD (urban): math 39% / reading 38% proficiency, ranked #449 of 826 in TX (top 54%) — families likely to look elsewhere, expect single-tenant / working-renter base with shorter leases; 66% free/reduced lunch — lower-income household profile, screen leases tightly.
- Zoned schools: Woods El (math 54% / reading 51%, grade C-, #720 of 4,322 statewide, top 17%, 756 students, 48% FRL) — zoned schools average 48% FRL vs 66% district-wide (18 pts lower); this property's tenant base skews higher-income than the district average.
- Zoned-school proficiency averages 52% at this address vs 38% district-wide (+14 pts) — the actual schools serving this property are materially stronger than the Tyler ISD average implies; a family-tenant draw the district grade alone would hide.
- Market conditions: Rents rising (+3.7%/yr); 327 active listings in the ZIP; 19 comparable units currently listed for rent nearby; rentals at typical pace (median 21d on market — plan ~3-4 weeks tenant-placement turnaround); 47% of comp listings sitting > 30 days — soft ceiling on asking rent; 595 units permitted in Smith County in 2024 (45 in 5+ unit buildings).
- This rent runs 38% of the median local income ($66k/yr) — at the standard rent-burdened threshold; future hikes will face affordability resistance.
Forward outlook
- Local home prices are declining (-3.0%/yr); year-one equity from $2k of loan paydown is wiped out by about $7k of value loss. Plan a longer hold.
- Smith County population projected at +24% by 2050 — long-run rental-demand tailwind backs the buy-and-hold thesis.
Negotiation context
- It's been on market 31 days — a 3% lower offer ($233k) is reasonable based on typical stale-listing flexibility.
- 6 sale attempts since 5y ago with the ask held roughly flat each time — persistent listings suggest the price (not the market) is what's stuck; bring a comps-based counter.
Risks & watch-outs
- Watch-outs: built in 1958 — expect roof / HVAC / electrical / plumbing capex.
- Climate carrying-cost: major wind risk, 61% chance of damaging wind over 30y; extreme-heat days projected 7→26/yr by 2055 (HVAC capex compounding) — expect insurance premiums to compound above CPI over the hold.
Questions for the listing agent
- It's been on market 31 days. Have you received any prior offers? Is the seller open to a 13% concession, seller financing, or rate buy-down credit?
- Built in 1958 — when were the roof, HVAC, electrical panel, plumbing, and water heater last replaced?
- Is there a deadline driving the sale (1031 exchange, divorce, estate, relocation)? That informs how much negotiation room exists.
- Schools are D-rated, which usually means shorter tenancies and higher turnover. Who's the typical renter profile here, and what's been the actual vacancy rate?
- Crime grade is D in this area — have there been break-ins, vandalism, or insurance claims at this property in the last 3 years? What carrier currently insures it and at what premium?
- The area grade is low — what's the realistic commute time and amenity access for the typical tenant pool here? Any planned neighborhood developments (good or bad) we should know about?
- What's the average days-on-market for RENTAL listings here right now (not sales)? A rising rental-DOM trend means longer vacancies and softer asking-rent achievability than the comps imply.
- What's the recent tenant-quality profile in this submarket — average credit score on applications, eviction rate, late-payment / NSF rate, and stable-employment percentage? A property-management company in the area should have these aggregated.
- How much new for-sale + rental construction is in the pipeline within 1–3 miles? Heavy new supply typically softens prices + rents 12–24 months out; constrained supply supports both.
Investment metrics
- 1% rule
- 0.87% ✗
- Cap rate
- 6.32%
- Cash-on-cash
- 0.08%
- DSCR
- 1.00
- GRM
- 9.5
CMA / ARV
- ARV (on-the-fly)
- $328,755
- Comps found
- 5
Show comp detail 5 sales within ~0.75 mi
| Address | Dist | Beds/Ba | Sqft | Sold | Price | $/sf | Match |
|---|---|---|---|---|---|---|---|
| 110 Samuel St | 0.12mi | 3/2.0 (-1) | 1,870 (-12%) | 14mo | $305,000 | $163 | 58 |
| 3313 S Cameron Ave | 0.68mi | 4/2.0 | 1,954 (-8%) | 1mo | $374,900 | $192 | 54 |
| 708 E Loftin St | 0.60mi | 3/2.0 (-1) | 1,924 (-9%) | 11mo | $215,000 | $112 | 42 |
| 3001 Jan Ave | 0.73mi | 3/3.0 (-1) | 2,183 (+3%) | 17mo | $220,000 | $101 | 38 |
| 3107 Brookside Dr | 0.66mi | 3/2.0 (-1) | 2,259 (+6%) | 19mo | $350,000 | $155 | 38 |
Match score weights: distance 35% · size 25% · config 20% · recency 20%. Top-matched comps best support the ARV.
Projected returns pro-forma
-3.0% appreciation · 3.66% rent growth · sell at horizon
- IRR
- -15.4%
- Equity multiple
- 0.45×
- Total profit
- $-37,143
- Equity at exit
- $35,770
- IRR
- -5.8%
- Equity multiple
- 0.61×
- Total profit
- $-26,007
- Equity at exit
- $20,742
Cash invested: $67,172 (down + closing). Projections, not guarantees.
Landlord ↔ Tenant lean methodology
- Overall (STATE)
- 87 Strongly Landlord-Friendly
- State Texas
- 87 Strongly Landlord-Friendly · R+5
- County
- — inherits STATE
- City
- — inherits STATE
ZIP-level market 75701
- Rents YoY
- 3.7%
- Active inventory
- 327
- Price-to-rent
- 9.5×
Monthly cashflow live
- Estimated rent
- $2,098 high interval (Pro) →
- Mortgage (P&I)
- −$1,258
- Tax from tax record
- −$295 /mo · $3,539/yr
- Insurance
- −$100
- HOA
- −$0
- Vacancy / Maint / Mgmt
- −$441
- Net cashflow
- $5
Break-even live
UW: 25.0% down · 7.5% · 30yr · 1.5% tax · 5.0% vac · 8.0% maint · 8.0% mgmt
Financing live
Cash to close
- Down payment
- $59,975
- Closing costs
- $7,197
- Reserves months
- —
- Total cash needed
- —
Loan-product check · same deal, 3 products live
Conventional
25% down · 7.5% · 30yr
- Down + closing
- —
- Monthly P&I
- —
- Monthly cashflow
- —
- DSCR
- —
- Eligible?
- —
Personal DTI + credit; lowest rate.
DSCR
20% down · 8.5% · 30yr
- Down + closing
- —
- Monthly P&I
- —
- Monthly cashflow
- —
- DSCR
- —
- Eligible?
- —
No personal income docs; deal must DSCR.
Hard money
10% down · 12.0% · 12mo
- Down + closing
- —
- Monthly P&I
- —
- Monthly cashflow
- —
- DSCR
- —
- Eligible?
- —
Short-term bridge; refi at stabilization.
Rent comps 19 comps
| Address | Beds | Baths | Sqft | Rent | $/sqft | DOM | Units | Dist |
|---|---|---|---|---|---|---|---|---|
| 3210 S Donnybrook Ave Tyler, TX | 3.0 | 2.0 | 1584 | $1,945 | $1.23 | 21d | 1 | 0.08mi |
| 117 Ridgecrest Dr Tyler, TX | 3.0 | 2.0 | 1571 | $2,150 | $1.37 | 43d | 1 | 0.18mi |
| 3206 Bain Pl Tyler, TX | 3.0 | 2.5 | 1840 | $1,895 | $1.03 | 43d | 1 | 0.35mi |
| 2720 S Broadway Ave Tyler, TX | 1.0–3.0 | 1.0–2.0 | 1064 | $1,330 | $1.25 | 13d | 14 | 0.42mi |
| 3712 Colony Park Dr Tyler, TX | 3.0 | 2.0 | 1802 | $1,850 | $1.03 | 13d | 1 | 0.49mi |
| 509 Winchester Dr Tyler, TX | 4.0 | 2.0 | 1960 | $2,400 | $1.22 | 13d | 1 | 0.50mi |
| 401 Woodland Hills Dr Tyler, TX | 3.0 | 2.5 | 2612 | $3,200 | $1.23 | 43d | 1 | 0.54mi |
| 328 Brookwood Dr Tyler, TX | 4.0 | 2.0 | 1985 | $2,300 | $1.16 | 43d | 1 | 0.56mi |
| 3200 Decharles St Tyler, TX | 3.0 | 2.0 | 2584 | $2,750 | $1.06 | 43d | 1 | 0.65mi |
| 3301 Brookside Dr Tyler, TX | 4.0 | 2.0 | 2328 | $2,250 | $0.97 | 13d | 1 | 0.67mi |
| 1107 Dogwood St Tyler, TX | 3.0 | 1.5 | 1620 | $1,475 | $0.91 | 21d | 1 | 1.10mi |
| 2002 S Robertson Ave Tyler, TX | 3.0 | 2.5 | 1992 | $1,800 | $0.90 | 43d | 1 | 1.10mi |
| 1225 San Antonio St Tyler, TX | 3.0 | 2.0 | 1754 | $1,695 | $0.97 | 13d | 1 | 1.23mi |
| 711 W 6th St Tyler, TX | 3.0 | 2.0 | 1854 | $1,850 | $1.00 | 13d | 1 | 1.26mi |
| 1101 Balmoral Dr Tyler, TX | 3.0 | 2.0 | 1930 | $1,950 | $1.01 | 43d | 1 | 1.27mi |
| 1403 S Donnybrook Ave Tyler, TX | 3.0 | 3.0 | 1834 | $2,150 | $1.17 | 43d | 1 | 1.37mi |
| 1692 Alamo Xing Tyler, TX | 4.0 | 2.0 | 1610 | $2,300 | $1.43 | 13d | 1 | 1.43mi |
| 4118 Southpark Dr Tyler, TX | 3.0 | 2.0 | 1552 | $1,450 | $0.93 | 43d | 1 | 1.44mi |
| 1712 Redbud Ave Tyler, TX | 3.0 | 1.5 | 1561 | $1,475 | $0.94 | 13d | 1 | 1.47mi |
Listing history 29 events
-
2026-06-19days on market $239,900 Active 31 DOM
-
2026-06-18days on market $239,900 Active 30 DOM
-
2026-06-17days on market $239,900 Active 29 DOM
-
2026-06-16days on market $239,900 Active 28 DOM
-
2026-06-15days on market $239,900 Active 27 DOM
-
2026-06-14days on market $239,900 Active 25 DOM
-
2026-06-13days on market $239,900 Active 24 DOM
-
2026-06-10days on market $239,900 Active 22 DOM
-
2026-06-09days on market $239,900 Active 21 DOM
-
2026-06-08days on market $239,900 Active 20 DOM
-
2026-06-07days on market $239,900 Active 19 DOM
-
2026-06-05days on market $239,900 Active 16 DOM
-
2026-06-02days on market $239,900 Active 14 DOM
-
2026-06-01days on market $239,900 Active 13 DOM
-
2026-05-31days on market $239,900 Active 12 DOM
-
2026-05-30days on market $239,900 Active 11 DOM
-
2026-05-19$239,900 Active 957-char remark
Show marketing remark (957 chars)
3126 Colgate Avenue in Tyler offers the kind of flexible layout that is hard to find, with 4 bedrooms, including a private mother-in-law suite with its own exterior entrance. The main side of the home features the primary living areas and three bedrooms. At the same time, the separate suite provides an ideal setup for guests, extended family, a home office, or additional privacy. Recent updates add even more appeal, including brand new garage doors, epoxy flooring in the garage, and new flooring and paint in the mother-in-law suite. The suite and garage layout has also been reconfigured, giving the space a fresh, more functional feel. The home offers a classic kitchen, comfortable living spaces, ample parking, and a fully fenced backyard. Tucked into a quiet Tyler neighborhood, this property blends practical updates, privacy, and versatility in a way that works for a variety of needs. Schedule your showing today and come see the possibilities!
-
2026-05-19$239,900 Active
Show marketing remark (957 chars)
3126 Colgate Avenue in Tyler offers the kind of flexible layout that is hard to find, with 4 bedrooms, including a private mother-in-law suite with its own exterior entrance. The main side of the home features the primary living areas and three bedrooms. At the same time, the separate suite provides an ideal setup for guests, extended family, a home office, or additional privacy. Recent updates add even more appeal, including brand new garage doors, epoxy flooring in the garage, and new flooring and paint in the mother-in-law suite. The suite and garage layout has also been reconfigured, giving the space a fresh, more functional feel. The home offers a classic kitchen, comfortable living spaces, ample parking, and a fully fenced backyard. Tucked into a quiet Tyler neighborhood, this property blends practical updates, privacy, and versatility in a way that works for a variety of needs. Schedule your showing today and come see the possibilities!
-
2026-05-18$239,900 Active 957-char remark
Show marketing remark (957 chars)
3126 Colgate Avenue in Tyler offers the kind of flexible layout that is hard to find, with 4 bedrooms, including a private mother-in-law suite with its own exterior entrance. The main side of the home features the primary living areas and three bedrooms. At the same time, the separate suite provides an ideal setup for guests, extended family, a home office, or additional privacy. Recent updates add even more appeal, including brand new garage doors, epoxy flooring in the garage, and new flooring and paint in the mother-in-law suite. The suite and garage layout has also been reconfigured, giving the space a fresh, more functional feel. The home offers a classic kitchen, comfortable living spaces, ample parking, and a fully fenced backyard. Tucked into a quiet Tyler neighborhood, this property blends practical updates, privacy, and versatility in a way that works for a variety of needs. Schedule your showing today and come see the possibilities!
-
2026-04-01historical
-
2026-02-27price $224,900
-
2026-02-27price $224,900
-
2026-02-27price $224,900
-
2026-01-29$239,900 Active
-
2026-01-29$239,900 Active
-
2022-02-10soldstatus
-
2022-02-09soldstatus
-
2021-12-09$210,000
-
1998-01-09soldstatus
ⓘ Source: listings_history table (triggers on properties + properties_extension) + one-shot
backfill from property_details.listing_events for pre-trigger history.
Tax reassessment forecast TX · Resets to sale price
- Current annual tax
- $3,539 · $295/mo
- Projected year-2 tax
- $4,390 · $366/mo
- Expected delta
- +$852/yr (+$71/mo · 24.1%)
ⓘ Screening estimate from a state-policy table — verify with the county assessor before closing.
Climate risk First Street
- Flood 1/10 Low FEMA zone X (unshaded) · 0% chance over 30 yrs
- Wildfire 1/10 Low
- Heat 6/10 Major 7 d/yr ≥109°F today · 26 d/yr by 30 yrs out
- Wind 6/10 Major 61% chance of damaging wind over 30 yrs
- Air quality 2/10 Low 0 unhealthy d/yr today · 1 by 30 yrs out
Nearby sold comps map
Loading sold comps map…
Walkable amenities ~0.75 mi
Loading nearby amenities…
Taxation est. · year 1
- Rental income
- $25,179
- − Mortgage interest
- −$13,438
- − Property taxes
- −$3,539
- − Insurance
- −$1,200
- − Repairs & maintenance
- −$2,014
- − Management
- −$2,014
- − Depreciation
- −$6,979
- Taxable loss
- −$4,005
- Est. tax savings @ 24.0%
- +$961
- After-tax cash flow
- $1,018/yr
For passive investors: Depreciation is non-cash, so a rental often shows a tax loss while cash-flowing — sheltering income. Rental losses are passive: they offset passive income freely, and up to $25,000/yr can offset ordinary (W-2) income if you actively participate and your MAGI is under $100k (phasing out to $0 by $150k); unused losses carry forward. On sale, claimed depreciation is recaptured at up to 25%, and gains may owe capital-gains tax (a 1031 exchange can defer both). Figures are a year-1 estimate at your 24.0% rate — not tax advice; consult a CPA.
Schools (NCES district)
- District
- Tyler ISD
- NCES district ID
- 4843470
- Math proficiency
- 39% ▼ -4.00%
- Reading proficiency
- 38% ▼ -1.00%
- Median HH income
- $44,090
- Composite
- 32.69/100
- National rank
- #5650
- State rank
- #449 of 826 in TX
Livability — Tyler
- Score
- 75/100
- State rank
- #147
- US rank
- #4181
Category grades
Schools grade is shown separately in the Schools card above.
Census & demographics
- Census place
- Tyler, TX
- County
- Smith County · 180,570 people
- City population
- 127,842
- Metro
- Tyler, TX
- Population (ZIP)
- 36,344
- Household income
- $66,401
- Rent vs Own
- Severe rent burden
- 1116.0
Population outlook (Smith County) Hauer SSP2
- Today (2025)
- 248,890 people
- By 2030
- 261,665 · +5.1%
- By 2040
- 286,114 · +15.0%
- By 2050
- 308,006 · +23.8%
- By 2075
- 354,171 · +42.3%
- By 2100
- 372,828 · +49.8%
Race, ethnicity, and origin ACS 2023
- Neighborhood character
- Diverse neighborhood (Simpson 0.64)
- Race & ethnicity
- White 53% Black 21% Hispanic / Latino 19% Two or more races 8% Asian 2%
- Hispanic origin (detail)
- Mexican 17%
- Common ancestry
- Slovak 2% Italian 1% Lithuanian 1%
- Foreign-born
- 8% · Canada
- Languages at home
- 84% English-only · Spanish 14% Other Indo-European 1%
Political lean MEDSL · Smith
- 2024 margin
- Solid R (+45.1) · D 27.0% · R 72.1%
- 2008→2024 swing
- -5.6pp toward R · 2008: -39.5pp · 2024: -45.1pp
- All cycles
- 2024: R+45.1 2020: R+39.4 2016: R+43.9 2012: R+46.9 2008: R+39.5
Not yet ingested
- Civics
- —
Market trends
- HPI YoY
- ▼ -299.78%
- Current HPI
- 207.238
- Rent YoY
- ▲ 3.66%
- Metro
- Tyler, TX
- State GDP YoY
- ▲ 3.95%
- F500 in state
- 110
Industry mix (Fortune 500 HQ in TX)
| Industry | F500 HQs | Revenue |
|---|---|---|
| Energy | 16 | $1,198B |
|
||
| Technology | 5 | $198B |
|
||
| Engineering / Construction | 4 | $72B |
|
||
| Energy Services | 3 | $60B |
|
||
| Utilities | 3 | $41B |
|
||
| Healthcare | 2 | $330B |
|
||
Price history
+14.2% since first listed13 events — show timeline
- 2026-05-19 Listed $239,900 NTREIS
- 2026-05-19 Listed $239,900 LAAR
- 2026-05-18 Listed $239,900 GTAR
- 2026-04-01 Listing Removed — NTREIS
- 2026-02-27 Price Changed $224,900 NTREIS
- 2026-02-27 Price Changed $224,900 GTAR
- 2026-02-27 Price Changed $224,900 LAAR
- 2026-01-29 Listed $239,900 NTREIS
- 2026-01-29 Listed $239,900 LAAR
- 2022-02-10 Sold (Public Records) — Public Records
- 2022-02-09 Sold (MLS) — GTAR
- 2021-12-09 Listed $210,000 GTAR
- 1998-01-09 Sold (Public Records) — Public Records
Property tax history
+2.4%/yrLatest (2024): $3,539 · +0.9% YoY. Source: county tax records.
Cash-flow waterfall
monthlySold comps — $/sqft
last 12 mo · ≤1 miLoading sold comps…