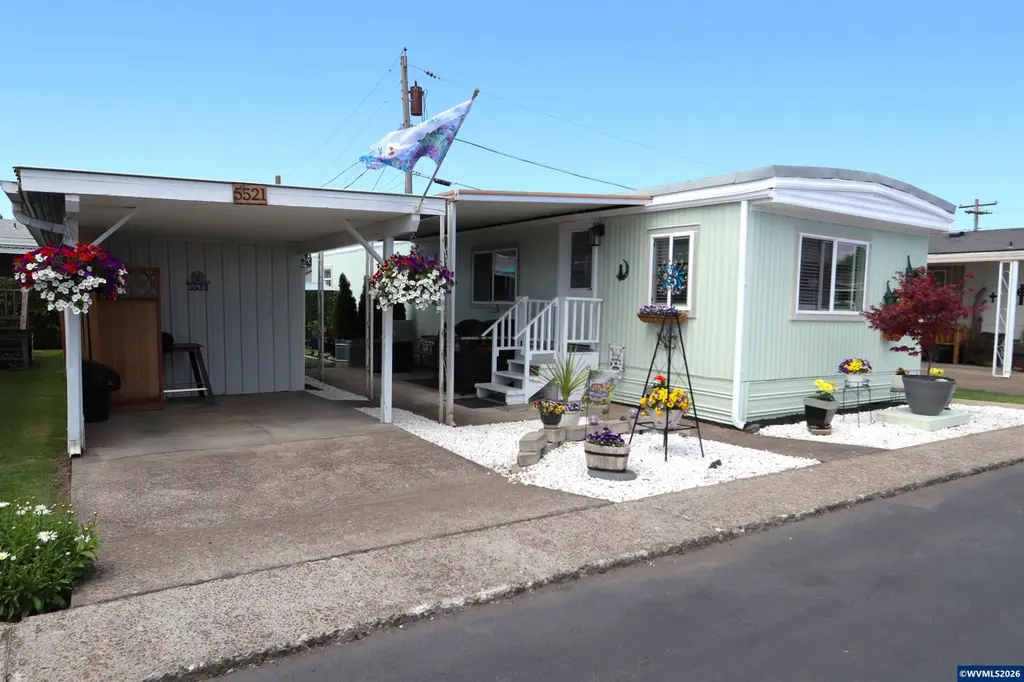
5521 43rd Ave NE · Salem, OR
Flood risk 1/10 · Minimal
- FEMA flood zone
- X (unshaded)
- Chance of flooding over 30 yrs
- 0.0%
- Est. flood insurance / yr
- $507 – $1,088
Fire risk 3/10 · Minor
- Est. fire insurance / yr
- $498 – $926
Heat risk 3/10 · Minor
- Hot days now (above 92°F)
- 7 days/yr
- Hot days in 30 yrs
- 14 days/yr
Wind risk 1/10 · Minimal
- Chance of severe wind over 30 yrs
- —
Air-quality risk 10/10 · Severe
- Unhealthy air days now
- 13 days/yr
- Unhealthy air days in 30 yrs
- 14 days/yr
Risk factors via First Street. Map © Google.
Why this score? — see what drove the B grade
The composite is a weighted blend of 9 inputs, each scored 0–100. Each bar is that input's sub-score; the figure is the points it added to the 100-point composite (weight × sub-score).
- Cash flow +30.0/30.0
- 1% rule +10.0/10.0
- DSCR +10.0/10.0
- ARV discount +7.5/15.0
- Livability +4.0/5.0
- Schools +3.7/10.0
- Rent growth +2.5/5.0
- Condition / age +2.5/5.0
- Appreciation +0.0/10.0
$59,000
🖨 Deal sheet 📄 Offer letter ✓ Due diligence
Listing remarks
Don't miss out on this beautifully updated home located in Shady Acres 55+ Community. New kitchen cabinets, new bathroom vanity, new windows, doors, exterior paint, interior paint, all new appliances including range, dishwasher, washer, dryer, and refrigerator. Spectacular side yard for quite time or entertaining guests. Small shop with power and garden shed, plenty of storage space.
Key facts
- Exterior paint
- New doors
- New bathroom vanity
Tags
Property features AI
Finance
- Other: Mobile home make: Moduline, model: Corinthian; Serial #: 14602BRFK918
- HOA & community: Located in Shady Acres mobile home park (55+ community); park rent covers water, sewer, and garbage
Exterior
- Parking: One covered carport; One garage space
- Utilities: City sewer; Private/community district water; Electric water heater; Electric power
- Home design: Single wide mobile home; Located in a 55+ (adult) park; Park rent includes water, sewer, and garbage
- Construction: Built in 1975; Aluminum siding; Pier foundation; Roof described as 'Other' (see remarks)
- Exterior features: Partially fenced yard; Deck; Landscaped yard; Small powered shop and garden shed (outbuildings)
Interior
- Kitchen: Electric range; Dishwasher; Refrigerator included
- Bedrooms: Master bedroom on the main level; Second bedroom on the main level
- Flooring: Vinyl
- Bathrooms: One bathroom on the main level
- Heating & cooling: Electric heating; Central air conditioning; Heat pump; Floor furnace
- Interior features: Vinyl flooring; Disposal
- Laundry & utility: Washer and dryer included; Electric water heater
Neighborhood map
What this means for you Summary
Snapshot
- This is a 2-bed/1.0-bath manufactured listed at $59k.
Deal economics
- At list price, monthly cash flow is $842 ($10k/yr) — positive.
- The deal already cash-flows at list — no discount required.
- Meets the 1% rule at list price ($2k rent vs $59k).
- Recommended offer: $58k (1.5% below list) — sets the bar for market timing.
- Cap rate 23.4% vs local median 2.9% in Salem — top-decile yield for the area; either an underpriced asset or a hidden risk that comps aren't pricing in. Stress-test before assuming the spread holds.
Location & tenants
- Location reads 79/100 on livability (#59 in OR, #2,084 nationally) — a middle-class / working-renter tenant base. Strengths: amenities A+, commute A+, housing A+; Watch: schools D, crime F.
- Salem-Keizer SD 24J (urban): math 34% / reading 47% proficiency, ranked #103 of 183 in OR (top 56%) — families likely to look elsewhere, expect single-tenant / working-renter base with shorter leases.
- Market conditions: 175 active listings in the ZIP; 7 comparable units currently listed for rent nearby; rentals at typical pace (median 14d on market — plan ~3-4 weeks tenant-placement turnaround); 43% of comp listings sitting > 30 days — soft ceiling on asking rent; 1,591 units permitted in Marion County in 2024 (716 in 5+ unit buildings).
Forward outlook
- Local home prices are declining (-3.0%/yr); year-one equity from $408 of loan paydown is wiped out by about $2k of value loss. Plan a longer hold.
- Marion County population projected at +17% by 2050 — long-run rental-demand tailwind backs the buy-and-hold thesis.
- At projected returns (-3.0% appreciation + 3.0% rent growth), your $17k cash investment doubles in ~2 years — after that, you're playing with house money.
Negotiation context
- It's been on market 19 days — a 2% lower offer ($58k) is reasonable based on typical stale-listing flexibility.
Questions for the listing agent
- Built in 1975 — when were the roof, HVAC, electrical panel, plumbing, and water heater last replaced?
- Is there a deadline driving the sale (1031 exchange, divorce, estate, relocation)? That informs how much negotiation room exists.
- Schools are D-rated, which usually means shorter tenancies and higher turnover. Who's the typical renter profile here, and what's been the actual vacancy rate?
- Crime grade is F in this area — have there been break-ins, vandalism, or insurance claims at this property in the last 3 years? What carrier currently insures it and at what premium?
- What's the average days-on-market for RENTAL listings here right now (not sales)? A rising rental-DOM trend means longer vacancies and softer asking-rent achievability than the comps imply.
- What's the recent tenant-quality profile in this submarket — average credit score on applications, eviction rate, late-payment / NSF rate, and stable-employment percentage? A property-management company in the area should have these aggregated.
- How much new for-sale + rental construction is in the pipeline within 1–3 miles? Heavy new supply typically softens prices + rents 12–24 months out; constrained supply supports both.
Investment metrics
- 1% rule
- 2.68% ✓
- Cap rate
- 23.42%
- Cash-on-cash
- 61.16%
- DSCR
- 3.72
- GRM
- 3.1
CMA / ARV
- ARV (on-the-fly)
- $25,872
- Comps found
- 4
Show comp detail 4 sales within ~0.75 mi
| Address | Dist | Beds/Ba | Sqft | Sold | Price | $/sf | Match |
|---|---|---|---|---|---|---|---|
| 5512 43rd Ave NE | 0.02mi | 2/1.0 | 784 (0%) | 22mo | $26,000 | $33 | 80 |
| 5422 Portland Rd NE #19 | 0.10mi | 2/2.0 | 828 (+6%) | 17mo | $22,500 | $27 | 68 |
| 5534 NE 43rd Pl | 0.05mi | 2/1.0 | 700 (-11%) | 21mo | $15,000 | $21 | 62 |
| 4882 Lancaster Dr NE #71 | 0.61mi | 2/1.0 | 784 (0%) | 13mo | $30,000 | $38 | 61 |
Match score weights: distance 35% · size 25% · config 20% · recency 20%. Top-matched comps best support the ARV.
Projected returns pro-forma
-3.0% appreciation · 3.0% rent growth · sell at horizon
- IRR
- 60.0%
- Equity multiple
- 3.67×
- Total profit
- $44,092
- Equity at exit
- $8,797
- IRR
- 64.7%
- Equity multiple
- 7.51×
- Total profit
- $107,546
- Equity at exit
- $5,101
Cash invested: $16,520 (down + closing). Projections, not guarantees.
Landlord ↔ Tenant lean methodology
- Overall (STATE)
- 28 Tenant-Leaning
- State Oregon
- 28 Tenant-Leaning · D+6
- County
- — inherits STATE
- City
- — inherits STATE
ZIP-level market 97305
- Active inventory
- 175
- Price-to-rent
- 3.1×
Monthly cashflow live
- Estimated rent
- $1,582 high interval (Pro) →
- Mortgage (P&I)
- −$309
- Tax est. 1.5%
- −$74 /mo · $885/yr
- Insurance
- −$25
- HOA
- −$0
- Vacancy / Maint / Mgmt
- −$332
- Net cashflow
- $842
Break-even live
UW: 25.0% down · 7.5% · 30yr · 1.5% tax · 5.0% vac · 8.0% maint · 8.0% mgmt
Financing live
Cash to close
- Down payment
- $14,750
- Closing costs
- $1,770
- Reserves months
- —
- Total cash needed
- —
Loan-product check · same deal, 3 products live
Conventional
25% down · 7.5% · 30yr
- Down + closing
- —
- Monthly P&I
- —
- Monthly cashflow
- —
- DSCR
- —
- Eligible?
- —
Personal DTI + credit; lowest rate.
DSCR
20% down · 8.5% · 30yr
- Down + closing
- —
- Monthly P&I
- —
- Monthly cashflow
- —
- DSCR
- —
- Eligible?
- —
No personal income docs; deal must DSCR.
Hard money
10% down · 12.0% · 12mo
- Down + closing
- —
- Monthly P&I
- —
- Monthly cashflow
- —
- DSCR
- —
- Eligible?
- —
Short-term bridge; refi at stabilization.
Rent comps 7 comps
| Address | Beds | Baths | Sqft | Rent | $/sqft | DOM | Units | Dist |
|---|---|---|---|---|---|---|---|---|
| 5115 Countryside St NE Salem, OR | 3.0 | 1.0–2.0 | 876 | $1,958 | $2.23 | 14d | 20 | 0.43mi |
| 4828 Lancaster Dr NE Salem, OR | 2.0 | 1.0 | 832 | $1,435 | $1.72 | 14d | 5 | 0.76mi |
| 4040 Hayesville Dr NE Salem, OR | 1.0–3.0 | 1.0–2.0 | 927 | $1,695 | $1.83 | 14d | 25 | 0.96mi |
| 4624 Lancaster Dr NE Salem, OR | 2.0–3.0 | 2.0–2.5 | 963 | $1,495 | $1.55 | 14d | 10 | 1.10mi |
| 4553 Lancaster Dr NE Unit 4553-B Salem, OR | 1.0 | 1.0 | 575 | $995 | $1.73 | 43d | 1 | 1.18mi |
| 4007 Iberis St NE Unit 4007 Salem, OR | 2.0 | 1.0 | 850 | $1,195 | $1.41 | 43d | 1 | 1.47mi |
| 3942 Ward Dr NE Salem, OR | 1.0–2.0 | 1.0–2.0 | 775 | $1,550 | $2.00 | 43d | 3 | 1.49mi |
Listing history 14 events
-
2026-06-18days on market $59,000 Active 19 DOM
-
2026-06-17days on market $59,000 Active 18 DOM
-
2026-06-16days on market $59,000 Active 17 DOM
-
2026-06-15days on market $59,000 Active 16 DOM
-
2026-06-14days on market $59,000 Active 14 DOM
-
2026-06-10days on market $59,000 Active 11 DOM
-
2026-06-09days on market $59,000 Active 10 DOM
-
2026-06-08days on market $59,000 Active 9 DOM
-
2026-06-07days on market $59,000 Active 8 DOM
-
2026-06-03days on market $59,000 Active 4 DOM
-
2026-06-02days on market $59,000 Active 3 DOM
-
2026-06-01days on market $59,000 Active 2 DOM
-
2026-05-31remarks 386-char remark
-
2026-05-31$59,000 Active 1 DOM
ⓘ Source: listings_history table (triggers on properties + properties_extension) + one-shot
backfill from property_details.listing_events for pre-trigger history.
Climate risk First Street
- Flood 1/10 Low FEMA zone X (unshaded) · 0% chance over 30 yrs
- Wildfire 3/10 Moderate
- Heat 3/10 Moderate 7 d/yr ≥92°F today · 14 d/yr by 30 yrs out
- Wind 1/10 Low
- Air quality 10/10 Extreme 13 unhealthy d/yr today · 14 by 30 yrs out
Nearby sold comps map
Loading sold comps map…
Walkable amenities ~0.75 mi
Loading nearby amenities…
Taxation est. · year 1
- Rental income
- $18,984
- − Mortgage interest
- −$3,305
- − Property taxes
- −$885
- − Insurance
- −$295
- − Repairs & maintenance
- −$1,519
- − Management
- −$1,519
- − Depreciation
- −$1,716
- Taxable income
- $9,745
- Est. tax owed @ 24.0%
- −$2,339
- After-tax cash flow
- $7,765/yr
For passive investors: Depreciation is non-cash, so a rental often shows a tax loss while cash-flowing — sheltering income. Rental losses are passive: they offset passive income freely, and up to $25,000/yr can offset ordinary (W-2) income if you actively participate and your MAGI is under $100k (phasing out to $0 by $150k); unused losses carry forward. On sale, claimed depreciation is recaptured at up to 25%, and gains may owe capital-gains tax (a 1031 exchange can defer both). Figures are a year-1 estimate at your 24.0% rate — not tax advice; consult a CPA.
Schools (NCES district)
- District
- Salem-Keizer SD 24J
- NCES district ID
- 4110820
- Math proficiency
- 34% ▼ -1.00%
- Reading proficiency
- 47% ▼ -2.00%
- Median HH income
- $48,632
- Composite
- 37.16/100
- National rank
- #9017
- State rank
- #103 of 183 in OR
Livability — Salem
- Score
- 79/100
- State rank
- #59
- US rank
- #2084
Category grades
Schools grade is shown separately in the Schools card above.
Census & demographics
- Census place
- Salem, OR
- Population (ZIP)
- 45,044
Population outlook (Marion County) Hauer SSP2
- Today (2025)
- 360,940 people
- By 2030
- 375,178 · +3.9%
- By 2040
- 400,914 · +11.1%
- By 2050
- 422,187 · +17.0%
- By 2075
- 460,305 · +27.5%
- By 2100
- 464,025 · +28.6%
Race, ethnicity, and origin ACS 2023
- Neighborhood character
- Diverse neighborhood (Simpson 0.61)
- Race & ethnicity
- Hispanic / Latino 44% White 44% Two or more races 16% Asian 3% Pacific Islander 3% Native American 3% Black 1%
- Hispanic origin (detail)
- Mexican 41%
- Common ancestry
- Italian 2% Slovak 2% Scotch-Irish 2%
- Foreign-born
- 23% · Canada, China
- Languages at home
- 57% English-only · Spanish 35% Other Asian/Pacific 3% Russian/Polish/Slavic 2%
Political lean MEDSL · Marion
- 2024 margin
- Toss-up / Even · D 47.5% · R 49.5% · Other 3.0%
- 2008→2024 swing
- -4.2pp toward R · 2008: 2.2pp · 2024: -2.0pp
- All cycles
- 2024: R+2.0 2020: D+1.1 2016: R+5.0 2012: R+3.5 2008: D+2.2
Not yet ingested
- Civics
- —
Market trends
- HPI YoY
- ▼ -328.50%
- Current HPI
- 296.3428
- Rent YoY
- —
- Metro
- —
- State GDP YoY
- ▲ 2.05%
- F500 in state
- 2
Industry mix (Fortune 500 HQ in OR)
| Industry | F500 HQs | Revenue |
|---|---|---|
| Consumer Goods | 1 | $51B |
|
||
Price history
+18.2% since first listed2 events — show timeline
- 2026-05-31 Price Changed $59,000 WVMLS
- 2026-05-31 Listed $49,900 WVMLS
Property tax history
-14.1%/yrLatest (2010): $83 · -14.1% YoY. Source: county tax records.
Cash-flow waterfall
monthlySold comps — $/sqft
last 12 mo · ≤1 miLoading sold comps…