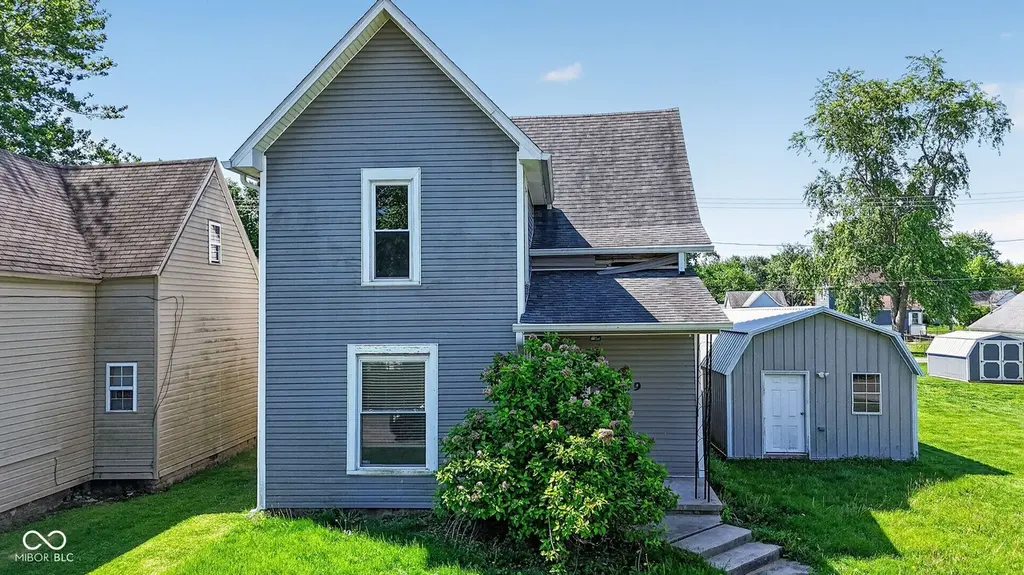
1909 S J St · Elwood, IN
Flood risk 1/10 · Minimal
- FEMA flood zone
- X (unshaded)
- Chance of flooding over 30 yrs
- 0.0%
- Est. flood insurance / yr
- $507 – $1,088
Fire risk 1/10 · Minimal
- Est. fire insurance / yr
- $717 – $1,331
Heat risk 3/10 · Minor
- Hot days now (above 102°F)
- 7 days/yr
- Hot days in 30 yrs
- 18 days/yr
Wind risk 2/10 · Minimal
- Chance of severe wind over 30 yrs
- —
Air-quality risk 4/10 · Minor
- Unhealthy air days now
- 3 days/yr
- Unhealthy air days in 30 yrs
- 5 days/yr
Risk factors via First Street. Map © Google.
Why this score? — see what drove the C- grade
The composite is a weighted blend of 9 inputs, each scored 0–100. Each bar is that input's sub-score; the figure is the points it added to the 100-point composite (weight × sub-score).
- Cash flow +18.3/30.0
- ARV discount +15.0/15.0
- DSCR +5.8/10.0
- 1% rule +4.6/10.0
- Livability +3.1/5.0
- Rent growth +2.5/5.0
- Condition / age +2.5/5.0
- Schools +1.6/10.0
- Appreciation +0.0/10.0
$169,900
🖨 Deal sheet 📄 Offer letter ✓ Due diligence
Listing remarks MLS
LARGE 2 STORY HOME WITH NICE KITCHEN, LARGE LIVING ROOM AND DR. 3 BEDROOMS UPSTAIRS WITH FULL BATH.
Key facts
- Huge shed
- 7,492 sq ft lot
- Built 1898
Tags
Property features AI
Exterior
- Parking: Detached parking (no attached garage listed)
- Utilities: Public water; Municipal sewer connected; Regular solid waste service
- Home design: Single-family residence; Two levels; Property type: Residential; Less than 1/4 acre lot (approx. 0.17 acre)
- Construction: Vinyl siding; Crawl space foundation
- Exterior features: Covered patio/porch
Interior
- Kitchen: Electric oven; Refrigerator
- Bedrooms: Four bedrooms total — one on the main level and three on the upper level; Upper bedrooms include rooms sized 13x13, 13x10 and 11x10; Main-level bedroom sized 11x9
- Bathrooms: Two full bathrooms — one on the main level and one on the upper level
- Heating & cooling: Forced-air heating (natural gas); Central air conditioning
- Interior features: Woodwork stained or painted
- Laundry & utility: Main-level laundry room (6x5)
Neighborhood map
What this means for you Summary
Snapshot
- This is a 4-bed/1.0-bath single-family listed at $170k.
Deal economics
- At list price, monthly cash flow is $156 ($2k/yr) — positive.
- The deal already cash-flows at list — no discount required.
- To meet the 1% rule (rent ≥ 1% of price), the offer needs to be $163k (4.2% below list).
- Recommended offer: $163k (4.2% below list) — sets the bar for 1% rule.
- Cap rate 7.4% vs local median 5.3% in Elwood — top-decile yield for the area; either an underpriced asset or a hidden risk that comps aren't pricing in. Stress-test before assuming the spread holds.
Location & tenants
- Location reads 62/100 on livability (#482 in IN) — a middle-class / working-renter tenant base. Strengths: crime A+, cost of living A+, housing A+; Watch: schools F, amenities F, commute F.
- Elwood Community School Corporation (town): math 18% / reading 19% proficiency, ranked #283 of 301 in IN (top 94%) — low school quality limits family demand, transient renter base, plan for 1-2y turnover.
- Market conditions: 100 active listings in the ZIP; 4 comparable units currently listed for rent nearby; rentals leasing fast (median 2d on market — plan ~1-2 weeks tenant-placement turnaround); 184 units permitted in Madison County in 2024 (0 in 5+ unit buildings).
- This rent runs 31% of the median local income ($62k/yr) — at the standard rent-burdened threshold; future hikes will face affordability resistance.
Forward outlook
- Local home prices are declining (-3.0%/yr); year-one equity from $1k of loan paydown is wiped out by about $5k of value loss. Plan a longer hold.
- Madison County population projected at -14% by 2050 — secular population decline; favor cash flow + early exit over multi-decade hold.
Negotiation context
- It's been on market 35 days — a 3% lower offer ($165k) is reasonable based on typical stale-listing flexibility.
- 7 sale attempts since 20y ago; this cycle's ask has dropped $30k (15%) from the opening price — seller is motivated, your offer sets the floor, not the list.
- Current owner paid $56k; list at $170k implies a 206% gain — meaningful room to come down on a strong offer.
Risks & watch-outs
- Watch-outs: built in 1898 — expect roof / HVAC / electrical / plumbing capex.
Questions for the listing agent
- It's been on market 35 days. Have you received any prior offers? Is the seller open to a 4% concession, seller financing, or rate buy-down credit?
- Built in 1898 — when were the roof, HVAC, electrical panel, plumbing, and water heater last replaced?
- Is there a deadline driving the sale (1031 exchange, divorce, estate, relocation)? That informs how much negotiation room exists.
- Schools are F-rated, which usually means shorter tenancies and higher turnover. Who's the typical renter profile here, and what's been the actual vacancy rate?
- What's the average days-on-market for RENTAL listings here right now (not sales)? A rising rental-DOM trend means longer vacancies and softer asking-rent achievability than the comps imply.
- What's the recent tenant-quality profile in this submarket — average credit score on applications, eviction rate, late-payment / NSF rate, and stable-employment percentage? A property-management company in the area should have these aggregated.
- How much new for-sale + rental construction is in the pipeline within 1–3 miles? Heavy new supply typically softens prices + rents 12–24 months out; constrained supply supports both.
Investment metrics
- 1% rule
- 0.96% ✗
- Cap rate
- 7.40%
- Cash-on-cash
- 3.94%
- DSCR
- 1.18
- GRM
- 8.7
CMA / ARV
- ARV (median comp)
- $231,192
- List price
- $169,900
- Delta
- -26.51%
- Verdict
- UNDERPRICED
- Comps
- 20 within 1.0 mi
Show comp detail 10 sales within ~0.75 mi
| Address | Dist | Beds/Ba | Sqft | Sold | Price | $/sf | Match |
|---|---|---|---|---|---|---|---|
| 1800 S R St | 0.47mi | 3/1.0 (-1) | 2,475 (+1%) | 6mo | $38,500 | $16 | 66 |
| 2208 S F St | 0.40mi | 4/2.0 | 2,400 (-2%) | 11mo | $135,000 | $56 | 65 |
| 1500 S Anderson St | 0.41mi | 3/2.0 (-1) | 2,268 (-7%) | 4mo | $190,000 | $84 | 56 |
| 1708 S E St | 0.38mi | 3/2.0 (-1) | 2,380 (-2%) | 19mo | $92,000 | $39 | 53 |
| 1809 S H St | 0.16mi | 4/3.5 | 2,092 (-14%) | 10mo | $229,900 | $110 | 50 |
| 708 S Anderson St | 0.39mi | 4/3.0 | 2,723 (+12%) | 5mo | $260,000 | $95 | 50 |
| 1417 S H St | 0.37mi | 3/1.0 (-1) | 2,167 (-11%) | 19mo | $176,000 | $81 | 43 |
| 2101 S A St | 0.61mi | 4/1.5 | 2,084 (-15%) | 13mo | $100,000 | $48 | 34 |
| 1330 S F St | 0.50mi | 3/2.0 (-1) | 2,160 (-12%) | 18mo | $168,900 | $78 | 33 |
| 1325 S B St | 0.64mi | 4/2.0 | 2,120 (-13%) | 14mo | $190,000 | $90 | 33 |
Match score weights: distance 35% · size 25% · config 20% · recency 20%. Top-matched comps best support the ARV.
Projected returns pro-forma
-3.0% appreciation · 3.0% rent growth · sell at horizon
- IRR
- -10.1%
- Equity multiple
- 0.63×
- Total profit
- $-17,575
- Equity at exit
- $25,333
- IRR
- -0.8%
- Equity multiple
- 0.95×
- Total profit
- $-2,492
- Equity at exit
- $14,690
Cash invested: $47,572 (down + closing). Projections, not guarantees.
Landlord ↔ Tenant lean methodology
- Overall (STATE)
- 90 Strongly Landlord-Friendly
- State Indiana
- 90 Strongly Landlord-Friendly · R+11
- County
- — inherits STATE
- City
- — inherits STATE
ZIP-level market 46036
- Home prices YoY
- -18.3%
- Active inventory
- 100
- Price-to-rent
- 8.7×
Monthly cashflow live
- Estimated rent
- $1,628 medium interval (Pro) →
- Mortgage (P&I)
- −$891
- Tax from tax record
- −$168 /mo · $2,014/yr
- Insurance
- −$71
- HOA
- −$0
- Vacancy / Maint / Mgmt
- −$342
- Net cashflow
- $156
Break-even live
UW: 25.0% down · 7.5% · 30yr · 1.5% tax · 5.0% vac · 8.0% maint · 8.0% mgmt
Financing live
Cash to close
- Down payment
- $42,475
- Closing costs
- $5,097
- Reserves months
- —
- Total cash needed
- —
Loan-product check · same deal, 3 products live
Conventional
25% down · 7.5% · 30yr
- Down + closing
- —
- Monthly P&I
- —
- Monthly cashflow
- —
- DSCR
- —
- Eligible?
- —
Personal DTI + credit; lowest rate.
DSCR
20% down · 8.5% · 30yr
- Down + closing
- —
- Monthly P&I
- —
- Monthly cashflow
- —
- DSCR
- —
- Eligible?
- —
No personal income docs; deal must DSCR.
Hard money
10% down · 12.0% · 12mo
- Down + closing
- —
- Monthly P&I
- —
- Monthly cashflow
- —
- DSCR
- —
- Eligible?
- —
Short-term bridge; refi at stabilization.
Rent comps 4 comps
| Address | Beds | Baths | Sqft | Rent | $/sqft | DOM | Units | Dist |
|---|---|---|---|---|---|---|---|---|
| 1019 N 9th St Elwood, IN | 3.0 | 2.5 | 1762 | $1,750 | $0.99 | 1d | 1 | 1.49mi |
| 1021 N 9th St Elwood, IN | 3.0 | 2.5 | 1725 | $1,750 | $1.01 | 1d | 1 | 1.50mi |
| 1023 N 9th St Elwood, IN | 3.0 | 2.5 | 1762 | $1,750 | $0.99 | 14d | 1 | 1.50mi |
| 1025 N 9th St Elwood, IN | 3.0 | 2.5 | 1762 | $1,750 | $0.99 | 1d | 1 | 1.50mi |
Listing history 31 events
-
2026-06-18days on market $169,900 Active 35 DOM
-
2026-06-17days on market $169,900 Active 34 DOM
-
2026-06-16days on market $169,900 Active 33 DOM
-
2026-06-15days on market $169,900 Active 32 DOM
-
2026-06-13pricedays on market $169,900 Active 30 DOM
-
2026-06-09days on market $179,900 Active 26 DOM
-
2026-06-08pricedays on market $179,900 Active 25 DOM
-
2026-06-07days on market $189,900 Active 24 DOM
-
2026-06-03days on market $189,900 Active 20 DOM
-
2026-06-02days on market $189,900 Active 19 DOM
-
2026-06-01days on market $189,900 Active 18 DOM
-
2026-05-31days on market $189,900 Active 17 DOM
-
2026-05-14$199,900 Active 426-char remark
-
2016-11-18soldstatus $55,500 Sold 99-char remark
Show marketing remark (189 chars)
LARGE 2 STORY HOME WITH NICE KITCHEN CABINETS, LARGE ROOMS, SMALL ENTRY AT FRONT DOOR, FULL BATH AND BONUS ROOM FOR OFFICE/DEN. INCLUDES DR DOWN. UPSTAIRS OFFERS 3 BEDROOMS AND 1 FULL BATH.
-
2016-11-18soldstatus $55,500
Show marketing remark (189 chars)
LARGE 2 STORY HOME WITH NICE KITCHEN CABINETS, LARGE ROOMS, SMALL ENTRY AT FRONT DOOR, FULL BATH AND BONUS ROOM FOR OFFICE/DEN. INCLUDES DR DOWN. UPSTAIRS OFFERS 3 BEDROOMS AND 1 FULL BATH.
-
2016-11-05status Pending 99-char remark
Show marketing remark (99 chars)
LARGE 2 STORY HOME WITH NICE KITCHEN, LARGE LIVING ROOM AND DR. 3 BEDROOMS UPSTAIRS WITH FULL BATH.
-
2016-10-16historical Active with Contingency 99-char remark
Show marketing remark (99 chars)
LARGE 2 STORY HOME WITH NICE KITCHEN, LARGE LIVING ROOM AND DR. 3 BEDROOMS UPSTAIRS WITH FULL BATH.
-
2016-09-26price $57,000 99-char remark
Show marketing remark (99 chars)
LARGE 2 STORY HOME WITH NICE KITCHEN, LARGE LIVING ROOM AND DR. 3 BEDROOMS UPSTAIRS WITH FULL BATH.
-
2016-08-26$60,800 Active 99-char remark
Show marketing remark (99 chars)
LARGE 2 STORY HOME WITH NICE KITCHEN, LARGE LIVING ROOM AND DR. 3 BEDROOMS UPSTAIRS WITH FULL BATH.
-
2016-08-24$57,000
Show marketing remark (189 chars)
LARGE 2 STORY HOME WITH NICE KITCHEN CABINETS, LARGE ROOMS, SMALL ENTRY AT FRONT DOOR, FULL BATH AND BONUS ROOM FOR OFFICE/DEN. INCLUDES DR DOWN. UPSTAIRS OFFERS 3 BEDROOMS AND 1 FULL BATH.
-
2011-07-30historical
-
2011-07-29soldstatus $104,000
-
2011-05-02$104,500
-
2011-03-27historical
-
2010-09-22$110,000
-
2010-01-25historical
-
2010-01-21soldstatus $12,000
-
2009-12-23soldstatus $18,413
-
2009-11-24$14,999
-
2006-07-06soldstatus $34,954
-
2006-01-12$30,000
ⓘ Source: listings_history table (triggers on properties + properties_extension) + one-shot
backfill from property_details.listing_events for pre-trigger history.
Tax reassessment forecast IN · Partial reset (capped growth)
- Current annual tax
- $2,014 · $168/mo
- Projected year-2 tax
- $2,014 · $168/mo
- Expected delta
- $0/yr ($0/mo · 0.0%)
ⓘ Screening estimate from a state-policy table — verify with the county assessor before closing.
Climate risk First Street
- Flood 1/10 Low FEMA zone X (unshaded) · 0% chance over 30 yrs
- Wildfire 1/10 Low
- Heat 3/10 Moderate 7 d/yr ≥102°F today · 18 d/yr by 30 yrs out
- Wind 2/10 Low
- Air quality 4/10 Moderate 3 unhealthy d/yr today · 5 by 30 yrs out
Nearby sold comps map
Loading sold comps map…
Walkable amenities ~0.75 mi
Loading nearby amenities…
Taxation est. · year 1
- Rental income
- $19,534
- − Mortgage interest
- −$9,517
- − Property taxes
- −$2,014
- − Insurance
- −$850
- − Repairs & maintenance
- −$1,563
- − Management
- −$1,563
- − Depreciation
- −$4,943
- Taxable loss
- −$915
- Est. tax savings @ 24.0%
- +$220
- After-tax cash flow
- $2,096/yr
For passive investors: Depreciation is non-cash, so a rental often shows a tax loss while cash-flowing — sheltering income. Rental losses are passive: they offset passive income freely, and up to $25,000/yr can offset ordinary (W-2) income if you actively participate and your MAGI is under $100k (phasing out to $0 by $150k); unused losses carry forward. On sale, claimed depreciation is recaptured at up to 25%, and gains may owe capital-gains tax (a 1031 exchange can defer both). Figures are a year-1 estimate at your 24.0% rate — not tax advice; consult a CPA.
Schools (NCES district)
- District
- Elwood Community School Corporation
- NCES district ID
- 1803300
- Math proficiency
- 18% ▼ -9.00%
- Reading proficiency
- 19% ▼ -9.00%
- Median HH income
- $38,757
- Composite
- 15.6/100
- National rank
- #9292
- State rank
- #283 of 301 in IN
Livability — Elwood
- Score
- 62/100
- State rank
- #482
- US rank
- #17050
Category grades
Schools grade is shown separately in the Schools card above.
Census & demographics
- Census place
- Elwood, IN
- County
- Madison County · 69,445 people
- City population
- 11,683
- Metro
- Indianapolis-Carmel-Anderson, IN
- Population (ZIP)
- 11,683
- Household income
- $62,074
- Rent vs Own
- Severe rent burden
- 225.0
Population outlook (Madison County) Hauer SSP2
- Today (2025)
- 125,800 people
- By 2030
- 122,640 · -2.5%
- By 2040
- 115,420 · -8.3%
- By 2050
- 108,148 · -14.0%
- By 2075
- 91,838 · -27.0%
- By 2100
- 75,670 · -39.8%
Race, ethnicity, and origin ACS 2023
- Neighborhood character
- Predominantly White (94%)
- Race & ethnicity
- White 94% Hispanic / Latino 3% Two or more races 3%
- Common ancestry
- Iranian 2% Italian 2% Slovak 1%
- Foreign-born
- 1% · Canada
- Languages at home
- 97% English-only · Spanish 2%
Political lean MEDSL · Madison
- 2024 margin
- Strong R (+26.9) · D 35.6% · R 62.5% · Other 1.9%
- 2008→2024 swing
- -33.5pp toward R · 2008: 6.5pp · 2024: -26.9pp
- All cycles
- 2024: R+26.9 2020: R+22.6 2016: R+25.7 2012: R+4.5 2008: D+6.5
Not yet ingested
- Civics
- —
Market trends
- HPI YoY
- ▼ -70.59%
- Current HPI
- 314.8526
- Rent YoY
- —
- Metro
- Indianapolis-Carmel-Anderson, IN
- State GDP YoY
- ▲ 2.90%
- F500 in state
- 18
Industry mix (Fortune 500 HQ in IN)
| Industry | F500 HQs | Revenue |
|---|---|---|
| Industrial Machinery | 2 | $37B |
|
||
| Healthcare | 1 | $177B |
|
||
| Pharmaceuticals | 1 | $45B |
|
||
| Metals / Steel | 1 | $18B |
|
||
| Agriculture | 1 | $17B |
|
||
| Packaging | 1 | $12B |
|
||
Price history
+466.3% since first listed22 events — show timeline
- 2026-06-12 Price Changed $169,900 MIBOR as Distributed by MLS Grid
- 2026-06-08 Price Changed $179,900 MIBOR as Distributed by MLS Grid
- 2026-05-26 Price Changed $189,900 MIBOR as Distributed by MLS Grid
- 2026-05-14 Listed $199,900 MIBOR as Distributed by MLS Grid
- 2016-11-18 Sold (MLS) $55,500 IRMLS
- 2016-11-18 Sold (MLS) $55,500 MIBOR as Distributed by MLS Grid
- 2016-11-05 Pending — MIBOR as Distributed by MLS Grid
- 2016-10-16 Contingent — MIBOR as Distributed by MLS Grid
- 2016-09-26 Price Changed $57,000 MIBOR as Distributed by MLS Grid
- 2016-08-26 Listed $60,800 MIBOR as Distributed by MLS Grid
- 2016-08-24 Listed $57,000 IRMLS
- 2011-07-30 Listing Removed — MIBOR as Distributed by MLS Grid
- 2011-07-29 Sold (MLS) $104,000 MIBOR as Distributed by MLS Grid
- 2011-05-02 Listed $104,500 MIBOR as Distributed by MLS Grid
- 2011-03-27 Listing Removed — MIBOR as Distributed by MLS Grid
- 2010-09-22 Listed $110,000 MIBOR as Distributed by MLS Grid
- 2010-01-25 Listing Removed — MIBOR as Distributed by MLS Grid
- 2010-01-21 Sold (MLS) $12,000 MIBOR as Distributed by MLS Grid
- 2009-12-23 Sold (Public Records) $18,413 Public Records
- 2009-11-24 Listed $14,999 MIBOR as Distributed by MLS Grid
- 2006-07-06 Sold (MLS) $34,954 MIBOR as Distributed by MLS Grid
- 2006-01-12 Listed $30,000 MIBOR as Distributed by MLS Grid
Property tax history
+12.2%/yrLatest (2024): $2,014 · +6.1% YoY. Source: county tax records.
Cash-flow waterfall
monthlySold comps — $/sqft
last 12 mo · ≤1 miLoading sold comps…