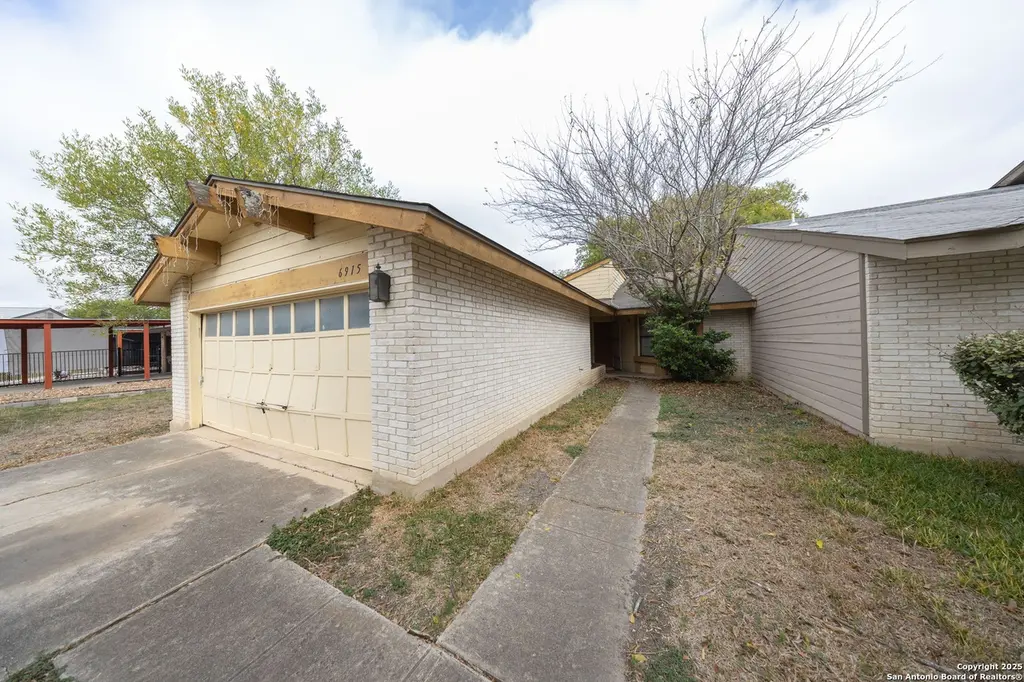
6915 Brecon · San Antonio, TX
Flood risk 1/10 · Minimal
- FEMA flood zone
- X (unshaded)
- Chance of flooding over 30 yrs
- 0.0%
- Est. flood insurance / yr
- $507 – $1,088
Fire risk 1/10 · Minimal
- Est. fire insurance / yr
- $1,222 – $2,270
Heat risk 8/10 · Major
- Hot days now (above 108°F)
- 7 days/yr
- Hot days in 30 yrs
- 22 days/yr
Wind risk 8/10 · Major
- Chance of severe wind over 30 yrs
- 80.0%
Air-quality risk 2/10 · Minimal
- Unhealthy air days now
- 0 days/yr
- Unhealthy air days in 30 yrs
- 1 days/yr
Risk factors via First Street. Map © Google.
Why this score? — see what drove the C grade
The composite is a weighted blend of 9 inputs, each scored 0–100. Each bar is that input's sub-score; the figure is the points it added to the 100-point composite (weight × sub-score).
- Cash flow +22.3/30.0
- ARV discount +10.1/15.0
- DSCR +7.1/10.0
- 1% rule +6.7/10.0
- Livability +4.0/5.0
- Schools +3.8/10.0
- Condition / age +2.5/5.0
- Rent growth +2.2/5.0
- Appreciation +0.0/10.0
$129,900
🖨 Deal sheet 📄 Offer letter ✓ Due diligence
Listing remarks MLS
Welcome to a great opportunity in the desirable Bulverde Village area! This home sits on a quiet street and offers fantastic potential for investors or buyers looking to put their personal touch on a property. Featuring a spacious layout with an open-concept main living area, this home is ready for renovation and customization. The backyard offers room to create an outdoor retreat, while the community's convenient location places you minutes from shopping, dining, and top-rated schools. With a bit of TLC, this property can truly shine. Don't miss your chance to add value in an established, sought-after neighborhood!
Key facts
- Backyard
- Convenient location
- Outdoor retreat
Tags
Neighborhood map
What this means for you Summary
Snapshot
- This is a 3-bed/2.0-bath townhouse listed at $130k.
Deal economics
- At list price, monthly cash flow is $214 ($3k/yr) — positive.
- The deal already cash-flows at list — no discount required.
- Meets the 1% rule at list price ($2k rent vs $130k).
- Recommended offer: $114k (12.0% below list) — sets the bar for market timing.
- Cap rate 8.3% vs local median 3.8% in San Antonio — top-decile yield for the area; either an underpriced asset or a hidden risk that comps aren't pricing in. Stress-test before assuming the spread holds.
Location & tenants
- Location reads 80/100 on livability (#31 in TX, #1,616 nationally) — a professional / high-income tenant draw. Strengths: amenities A+, commute A+, cost of living A+; Watch: schools C-, crime F.
- North East ISD (urban): math 38% / reading 49% proficiency, ranked #276 of 826 in TX (top 33%) — families likely to look elsewhere, expect single-tenant / working-renter base with shorter leases.
- Market conditions: Rents soft (-1.1%/yr); 202 active listings in the ZIP; 40 comparable units currently listed for rent nearby; rentals at typical pace (median 24d on market — plan ~3-4 weeks tenant-placement turnaround); 8,308 units permitted in Bexar County in 2024 (2,506 in 5+ unit buildings).
Forward outlook
- Local home prices are declining (-3.0%/yr); year-one equity from $898 of loan paydown is wiped out by about $4k of value loss. Plan a longer hold.
- Bexar County population projected at +50% by 2050 — long-run rental-demand tailwind backs the buy-and-hold thesis.
Negotiation context
- It's been on market 212 days — a 12% lower offer ($114k) is reasonable based on typical stale-listing flexibility.
- 2 sale attempts since 22y ago; this cycle's ask has dropped $30k (19%) from the opening price — seller is motivated, your offer sets the floor, not the list.
Risks & watch-outs
- Climate carrying-cost: severe wind risk, 80% chance of damaging wind over 30y; extreme-heat days projected 7→22/yr by 2055 (HVAC capex compounding) — expect insurance premiums to compound above CPI over the hold.
Questions for the listing agent
- It's been on market 212 days. Have you received any prior offers? Is the seller open to a 12% concession, seller financing, or rate buy-down credit?
- Why hasn't it sold? Are there any deal-killer items the seller is aware of (foundation, flood, title, zoning, code violations)?
- Is there a deadline driving the sale (1031 exchange, divorce, estate, relocation)? That informs how much negotiation room exists.
- Crime grade is F in this area — have there been break-ins, vandalism, or insurance claims at this property in the last 3 years? What carrier currently insures it and at what premium?
- What's the average days-on-market for RENTAL listings here right now (not sales)? A rising rental-DOM trend means longer vacancies and softer asking-rent achievability than the comps imply.
- What's the recent tenant-quality profile in this submarket — average credit score on applications, eviction rate, late-payment / NSF rate, and stable-employment percentage? A property-management company in the area should have these aggregated.
- How much new for-sale + rental construction is in the pipeline within 1–3 miles? Heavy new supply typically softens prices + rents 12–24 months out; constrained supply supports both.
Investment metrics
- 1% rule
- 1.17% ✓
- Cap rate
- 8.27%
- Cash-on-cash
- 7.07%
- DSCR
- 1.31
- GRM
- 7.1
CMA / ARV
- ARV (median comp)
- $137,746
- List price
- $129,900
- Delta
- -5.70%
- Verdict
- FAIR
- Comps
- 20 within 1.0 mi
Show comp detail 7 sales within ~0.75 mi
| Address | Dist | Beds/Ba | Sqft | Sold | Price | $/sf | Match |
|---|---|---|---|---|---|---|---|
| 7122 Brecon | 0.09mi | 3/2.5 | 1,584 (+2%) | 9mo | $140,000 | $88 | 83 |
| 6828 Stockport | 0.20mi | 3/2.0 | 1,664 (+7%) | 3mo | $89,000 | $53 | 76 |
| 6803 Oldham | 0.27mi | 3/2.0 | 1,500 (-3%) | 14mo | $164,700 | $110 | 70 |
| 6810 Stockport | 0.23mi | 3/2.0 | 1,562 (+1%) | 22mo | $120,000 | $77 | 69 |
| 6907 Neston #1 | 0.12mi | 3/1.0 | 1,393 (-10%) | 7mo | $95,000 | $68 | 68 |
| 6814 Neston Dr | 0.21mi | 3/2.5 | 1,764 (+14%) | 2mo | $139,900 | $79 | 63 |
| 7716 Glen Mdws | 0.65mi | 3/2.5 | 1,584 (+2%) | 23mo | $139,000 | $88 | 45 |
Match score weights: distance 35% · size 25% · config 20% · recency 20%. Top-matched comps best support the ARV.
Projected returns pro-forma
-3.0% appreciation · 0.0% rent growth · sell at horizon
- IRR
- -9.1%
- Equity multiple
- 0.68×
- Total profit
- $-11,760
- Equity at exit
- $19,369
- IRR
- -4.7%
- Equity multiple
- 0.74×
- Total profit
- $-9,518
- Equity at exit
- $11,231
Cash invested: $36,372 (down + closing). Projections, not guarantees.
Landlord ↔ Tenant lean methodology
- Overall (STATE)
- 87 Strongly Landlord-Friendly
- State Texas
- 87 Strongly Landlord-Friendly · R+5
- County
- — inherits STATE
- City
- — inherits STATE
ZIP-level market 78239
- Home prices YoY
- -5.9%
- Rents YoY
- -1.1%
- Active inventory
- 202
- Price-to-rent
- 7.1×
Monthly cashflow live
- Estimated rent
- $1,516 high interval (Pro) →
- Mortgage (P&I)
- −$681
- Tax from tax record
- −$248 /mo · $2,975/yr
- Insurance
- −$54
- HOA
- −$0
- Vacancy / Maint / Mgmt
- −$318
- Net cashflow
- $214
Break-even live
UW: 25.0% down · 7.5% · 30yr · 1.5% tax · 5.0% vac · 8.0% maint · 8.0% mgmt
Financing live
Cash to close
- Down payment
- $32,475
- Closing costs
- $3,897
- Reserves months
- —
- Total cash needed
- —
Loan-product check · same deal, 3 products live
Conventional
25% down · 7.5% · 30yr
- Down + closing
- —
- Monthly P&I
- —
- Monthly cashflow
- —
- DSCR
- —
- Eligible?
- —
Personal DTI + credit; lowest rate.
DSCR
20% down · 8.5% · 30yr
- Down + closing
- —
- Monthly P&I
- —
- Monthly cashflow
- —
- DSCR
- —
- Eligible?
- —
No personal income docs; deal must DSCR.
Hard money
10% down · 12.0% · 12mo
- Down + closing
- —
- Monthly P&I
- —
- Monthly cashflow
- —
- DSCR
- —
- Eligible?
- —
Short-term bridge; refi at stabilization.
Rent comps 40 comps
| Address | Beds | Baths | Sqft | Rent | $/sqft | DOM | Units | Dist |
|---|---|---|---|---|---|---|---|---|
| 7923 Langport San Antonio, TX | 3.0 | 2.0 | 1095 | $1,800 | $1.64 | 43d | 1 | 0.12mi |
| 7138 Brecon San Antonio, TX | 3.0 | 2.5 | 1276 | $1,065 | $0.83 | 43d | 1 | 0.13mi |
| 6918 Stockport San Antonio, TX | 3.0 | 2.0 | 1390 | $1,050 | $0.76 | 43d | 1 | 0.15mi |
| 8318 Tuxford San Antonio, TX | 4.0 | 2.0 | 1452 | $1,700 | $1.17 | 4d | 1 | 0.19mi |
| 7904 Mallow San Antonio, TX | 3.0 | 2.0 | 1135 | $1,145 | $1.01 | 14d | 1 | 0.22mi |
| 7210 John Palmer Dr Unit 101 San Antonio, TX | 3.0 | 2.5 | 1426 | $1,700 | $1.19 | 23d | 1 | 0.25mi |
| 7210 John Palmer Dr Unit 101 San Antonio, TX | 3.0 | 2.5 | 1426 | $1,650 | $1.16 | 16d | 1 | 0.25mi |
| 6814 Oldham San Antonio, TX | 3.0 | 2.0 | 1238 | $1,300 | $1.05 | 23d | 1 | 0.26mi |
| 6733 Montgomery Dr San Antonio, TX | 3.0 | 2.0 | 1150 | $860 | $0.75 | 43d | 2 | 0.32mi |
| 7809 Sarepto San Antonio, TX | 2.0 | 2.0 | 1152 | $950 | $0.82 | 23d | 1 | 0.35mi |
| 8259 Montgomery Oak San Antonio, TX | 3.0 | 2.0 | 1152 | $1,250 | $1.09 | 43d | 5 | 0.36mi |
| 6831 De Palma San Antonio, TX | 3.0 | 2.0 | 1504 | $1,539 | $1.02 | 3d | 1 | 0.40mi |
| 6831 De Palma San Antonio, TX | 3.0 | 2.0 | 1504 | $1,569 | $1.04 | 16d | 1 | 0.40mi |
| 6811 Avila San Antonio, TX | 3.0 | 2.0 | 1260 | $1,555 | $1.23 | 20d | 1 | 0.43mi |
| 6607 Benhill San Antonio, TX | 3.0 | 2.0 | 1318 | $2,000 | $1.52 | 21d | 1 | 0.49mi |
| 8310 Hastings San Antonio, TX | 2.0 | 1.0 | 1315 | $1,450 | $1.10 | 23d | 1 | 0.50mi |
| 7222 Glen Hvn San Antonio, TX | 4.0 | 2.0 | 1320 | $1,350 | $1.02 | 23d | 1 | 0.51mi |
| 9034 (15/16) Glen Shadow Dr San Antonio, TX | 3.0 | 2.5 | 1225 | $1,550 | $1.27 | 2d | 1 | 0.55mi |
| 9034 (15/16) Glen Shadow Dr San Antonio, TX | 3.0 | 2.5 | 1225 | $1,400 | $1.14 | 43d | 1 | 0.55mi |
| 8215 Littleport San Antonio, TX | 3.0 | 2.0 | 1344 | $1,600 | $1.19 | 17d | 1 | 0.55mi |
| 7318 Glen Trl San Antonio, TX | 3.0 | 2.0 | 1226 | $1,900 | $1.55 | 43d | 1 | 0.55mi |
| 6923 Glen Fair San Antonio, TX | 4.0 | 2.5 | 1632 | $1,725 | $1.06 | 7d | 1 | 0.55mi |
| 8219 Glen Lark San Antonio, TX | 4.0 | 2.0 | 1260 | $1,250 | $0.99 | 21d | 1 | 0.56mi |
| 7326 Glen Trl San Antonio, TX | 4.0 | 2.0 | 1370 | $1,549 | $1.13 | 3d | 1 | 0.57mi |
| 8350 Hastings San Antonio, TX | 3.0 | 2.0 | 1247 | $2,000 | $1.60 | 43d | 1 | 0.58mi |
| 7614 Glen Hurst San Antonio, TX | 3.0 | 1.0 | 1100 | $1,400 | $1.27 | 2d | 1 | 0.60mi |
| 7331 Glen Hts San Antonio, TX | 3.0 | 2.0 | 1184 | $1,390 | $1.17 | 23d | 1 | 0.60mi |
| 7210 Glen Cross San Antonio, TX | 4.0 | 2.0 | 2014 | $2,300 | $1.14 | 23d | 1 | 0.62mi |
| 7347 Montgomery Dr San Antonio, TX | 3.0 | 2.0 | 1579 | $1,950 | $1.23 | 23d | 1 | 0.66mi |
| 7662 Oak Chase San Antonio, TX | 3.0 | 2.0 | 1250 | $1,200 | $0.96 | 10d | 1 | 0.68mi |
| 7664 Oak Chase San Antonio, TX | 3.0 | 2.0 | 1250 | $1,350 | $1.08 | 7d | 1 | 0.68mi |
| 7042 Glen Mist San Antonio, TX | 3.0 | 2.0 | 1284 | $950 | $0.74 | 43d | 1 | 0.68mi |
| 7658 Oak Chase San Antonio, TX | 3.0 | 2.0 | 1250 | $1,350 | $1.08 | 7d | 1 | 0.69mi |
| 7660 Oak Chase San Antonio, TX | 3.0 | 2.0 | 1250 | $1,200 | $0.96 | 10d | 1 | 0.69mi |
| 7650 Oak Chase Unit 7650 San Antonio, TX | 4.0 | 2.0 | 1250 | $1,650 | $1.32 | 43d | 1 | 0.69mi |
| 7237 Glen Bay San Antonio, TX | 3.0 | 2.0 | 1400 | $1,050 | $0.75 | 43d | 1 | 0.69mi |
| 6721 Brothers Ln Unit 6721 San Antonio, TX | 4.0 | 2.0 | 1250 | $1,300 | $1.04 | 16d | 1 | 0.70mi |
| 6721 Brothers Ln San Antonio, TX | 4.0 | 2.0 | 1250 | $1,300 | $1.04 | 7d | 1 | 0.70mi |
| 7636 Oak Chase Unit 1 San Antonio, TX | 3.0 | 2.0 | 1200 | $1,255 | $1.05 | 43d | 1 | 0.71mi |
| 7648 Windsor Oaks San Antonio, TX | 4.0 | 2.0 | 1500 | $1,295 | $0.86 | 23d | 1 | 0.72mi |
Listing history 23 events
-
2026-06-18days on market $129,900 Active 212 DOM
-
2026-06-17days on market $129,900 Active 211 DOM
-
2026-06-16days on market $129,900 Active 210 DOM
-
2026-06-13days on market $129,900 Active 207 DOM
-
2026-06-13days on market $129,900 Active 206 DOM
-
2026-06-09days on market $129,900 Active 203 DOM
-
2026-06-08days on market $129,900 Active 202 DOM
-
2026-06-07days on market $129,900 Active 201 DOM
-
2026-06-04days on market $129,900 Active 198 DOM
-
2026-06-03days on market $129,900 Active 197 DOM
-
2026-06-02days on market $129,900 Active 196 DOM
-
2026-06-01days on market $129,900 Active 195 DOM
-
2026-05-31days on market $129,900 Active 194 DOM
-
2026-05-19price $129,900 623-char remark
Show marketing remark (623 chars)
Welcome to a great opportunity in the desirable Bulverde Village area! This home sits on a quiet street and offers fantastic potential for investors or buyers looking to put their personal touch on a property. Featuring a spacious layout with an open-concept main living area, this home is ready for renovation and customization. The backyard offers room to create an outdoor retreat, while the community's convenient location places you minutes from shopping, dining, and top-rated schools. With a bit of TLC, this property can truly shine. Don't miss your chance to add value in an established, sought-after neighborhood!
-
2026-03-12price $139,000 623-char remark
Show marketing remark (623 chars)
Welcome to a great opportunity in the desirable Bulverde Village area! This home sits on a quiet street and offers fantastic potential for investors or buyers looking to put their personal touch on a property. Featuring a spacious layout with an open-concept main living area, this home is ready for renovation and customization. The backyard offers room to create an outdoor retreat, while the community's convenient location places you minutes from shopping, dining, and top-rated schools. With a bit of TLC, this property can truly shine. Don't miss your chance to add value in an established, sought-after neighborhood!
-
2026-02-10price $149,900 623-char remark
Show marketing remark (623 chars)
Welcome to a great opportunity in the desirable Bulverde Village area! This home sits on a quiet street and offers fantastic potential for investors or buyers looking to put their personal touch on a property. Featuring a spacious layout with an open-concept main living area, this home is ready for renovation and customization. The backyard offers room to create an outdoor retreat, while the community's convenient location places you minutes from shopping, dining, and top-rated schools. With a bit of TLC, this property can truly shine. Don't miss your chance to add value in an established, sought-after neighborhood!
-
2025-11-17$160,000 New 623-char remark
Show marketing remark (623 chars)
Welcome to a great opportunity in the desirable Bulverde Village area! This home sits on a quiet street and offers fantastic potential for investors or buyers looking to put their personal touch on a property. Featuring a spacious layout with an open-concept main living area, this home is ready for renovation and customization. The backyard offers room to create an outdoor retreat, while the community's convenient location places you minutes from shopping, dining, and top-rated schools. With a bit of TLC, this property can truly shine. Don't miss your chance to add value in an established, sought-after neighborhood!
-
2005-10-24soldstatus
-
2005-02-11soldstatus
-
2005-02-11soldstatus
-
2005-02-10soldstatus 261-char remark
Show marketing remark (261 chars)
Now is the time to buy! submit all reasonable OFFERS. CLOSE TO MIDDLE SCHOOL, SHOPPING NEAR BY. CLOSE TO FT. SAM AND RANDOLPH AFB, HANDYMAN SPECIAL. PRICED FOR QUICK SALE. owner is flexible with cash offer! Ideal investment area. This home will rent in hours!!
-
2004-08-25$51,900 261-char remark
Show marketing remark (261 chars)
Now is the time to buy! submit all reasonable OFFERS. CLOSE TO MIDDLE SCHOOL, SHOPPING NEAR BY. CLOSE TO FT. SAM AND RANDOLPH AFB, HANDYMAN SPECIAL. PRICED FOR QUICK SALE. owner is flexible with cash offer! Ideal investment area. This home will rent in hours!!
-
1989-08-01soldstatus
ⓘ Source: listings_history table (triggers on properties + properties_extension) + one-shot
backfill from property_details.listing_events for pre-trigger history.
Tax reassessment forecast TX · Resets to sale price
- Current annual tax
- $2,975 · $248/mo
- Projected year-2 tax
- $2,975 · $248/mo
- Expected delta
- $0/yr ($0/mo · 0.0%)
ⓘ Screening estimate from a state-policy table — verify with the county assessor before closing.
Climate risk First Street
- Flood 1/10 Low FEMA zone X (unshaded) · 0% chance over 30 yrs
- Wildfire 1/10 Low
- Heat 8/10 Severe 7 d/yr ≥108°F today · 22 d/yr by 30 yrs out
- Wind 8/10 Severe 80% chance of damaging wind over 30 yrs
- Air quality 2/10 Low 0 unhealthy d/yr today · 1 by 30 yrs out
Nearby sold comps map
Loading sold comps map…
Walkable amenities ~0.75 mi
Loading nearby amenities…
Taxation est. · year 1
- Rental income
- $18,192
- − Mortgage interest
- −$7,276
- − Property taxes
- −$2,975
- − Insurance
- −$650
- − Repairs & maintenance
- −$1,455
- − Management
- −$1,455
- − Depreciation
- −$3,779
- Taxable income
- $602
- Est. tax owed @ 24.0%
- −$144
- After-tax cash flow
- $2,429/yr
For passive investors: Depreciation is non-cash, so a rental often shows a tax loss while cash-flowing — sheltering income. Rental losses are passive: they offset passive income freely, and up to $25,000/yr can offset ordinary (W-2) income if you actively participate and your MAGI is under $100k (phasing out to $0 by $150k); unused losses carry forward. On sale, claimed depreciation is recaptured at up to 25%, and gains may owe capital-gains tax (a 1031 exchange can defer both). Figures are a year-1 estimate at your 24.0% rate — not tax advice; consult a CPA.
Schools (NCES district)
- District
- North East ISD
- NCES district ID
- 4832940
- Math proficiency
- 38% ▼ -14.00%
- Reading proficiency
- 49% ▼ -4.00%
- Median HH income
- $57,715
- Composite
- 38.1/100
- National rank
- #4276
- State rank
- #276 of 826 in TX
Livability — San Antonio
- Score
- 80/100
- State rank
- #31
- US rank
- #1616
Category grades
Schools grade is shown separately in the Schools card above.
Census & demographics
- County
- Bexar County · 1,990,555 people
- City population
- 1,806,925
- Metro
- San Antonio-New Braunfels, TX
- Population (ZIP)
- 28,609
- Household income
- $70,098
- Rent vs Own
- Severe rent burden
- 488.0
Population outlook (Bexar County) Hauer SSP2
- Today (2025)
- 2,336,851 people
- By 2030
- 2,560,728 · +9.6%
- By 2040
- 3,020,569 · +29.3%
- By 2050
- 3,493,522 · +49.5%
- By 2075
- 4,668,459 · +99.8%
- By 2100
- 5,533,242 · +136.8%
Race, ethnicity, and origin ACS 2023
- Neighborhood character
- Diverse neighborhood (Simpson 0.66)
- Race & ethnicity
- Hispanic / Latino 47% White 30% Two or more races 20% Black 16% Asian 4% Pacific Islander 2%
- Hispanic origin (detail)
- Mexican 38% Puerto Rican 4%
- Common ancestry
- Lithuanian 2% Romanian 1% Slovak 1%
- Foreign-born
- 13% · Canada, Vietnam, Jamaica
- Languages at home
- 72% English-only · Spanish 24% Vietnamese 1% Chinese 1%
Political lean MEDSL · Bexar
- 2024 margin
- Lean D (+9.8) · D 54.3% · R 44.6% · Other 1.1%
- 2008→2024 swing
- +4.2pp toward D · 2008: 5.6pp · 2024: 9.8pp
- All cycles
- 2024: D+9.8 2020: D+18.2 2016: D+13.5 2012: D+4.6 2008: D+5.6
Not yet ingested
- Civics
- —
Market trends
- HPI YoY
- ▼ -15.13%
- Current HPI
- 242.1272
- Rent YoY
- ▼ -1.05%
- Metro
- San Antonio-New Braunfels, TX
- State GDP YoY
- ▲ 3.95%
- F500 in state
- 110
Industry mix (Fortune 500 HQ in TX)
| Industry | F500 HQs | Revenue |
|---|---|---|
| Energy | 16 | $1,198B |
|
||
| Technology | 5 | $198B |
|
||
| Engineering / Construction | 4 | $72B |
|
||
| Energy Services | 3 | $60B |
|
||
| Utilities | 3 | $41B |
|
||
| Healthcare | 2 | $330B |
|
||
Price history
+150.3% since first listed10 events — show timeline
- 2026-05-19 Price Changed $129,900 LERA
- 2026-03-12 Price Changed $139,000 LERA
- 2026-02-10 Price Changed $149,900 LERA
- 2025-11-17 Listed $160,000 LERA
- 2005-10-24 Sold (Public Records) — Public Records
- 2005-02-11 Sold (Public Records) — Public Records
- 2005-02-11 Sold (Public Records) — Public Records
- 2005-02-10 Sold (MLS) — LERA
- 2004-08-25 Listed $51,900 LERA
- 1989-08-01 Sold (Public Records) — Public Records
Property tax history
+12.1%/yrLatest (2025): $2,975 · -1.0% YoY. Source: county tax records.
Cash-flow waterfall
monthlySold comps — $/sqft
last 12 mo · ≤1 miLoading sold comps…