2013 37th St SE · Washington, DC
Flood risk 1/10 · Minimal
- FEMA flood zone
- X (unshaded)
- Chance of flooding over 30 yrs
- 0.0%
- Est. flood insurance / yr
- $507 – $1,088
Fire risk 1/10 · Minimal
- Est. fire insurance / yr
- $631 – $1,173
Heat risk 7/10 · Major
- Hot days now (above 104°F)
- 7 days/yr
- Hot days in 30 yrs
- 16 days/yr
Wind risk 5/10 · Moderate
- Chance of severe wind over 30 yrs
- 22.0%
Air-quality risk 4/10 · Minor
- Unhealthy air days now
- 4 days/yr
- Unhealthy air days in 30 yrs
- 5 days/yr
Risk factors via First Street. Map © Google.
Why this score? — see what drove the D+ grade
The composite is a weighted blend of 9 inputs, each scored 0–100. Each bar is that input's sub-score; the figure is the points it added to the 100-point composite (weight × sub-score).
- Cash flow +16.9/30.0
- ARV discount +7.5/15.0
- 1% rule +7.0/10.0
- DSCR +5.3/10.0
- Livability +3.7/5.0
- Schools +3.6/10.0
- Rent growth +3.5/5.0
- Condition / age +2.2/5.0
- Appreciation +0.0/10.0
$148,000
🖨 Deal sheet (PDF) 📄 Offer letter ✓ Due diligence
Listing remarks
Discover the charm of this traditional 1st floor condo unit in the heart of historic Fairfax Village. Built in 1940, this inviting 2-bedroom, 1-bath apartment offers a cozy retreat with modern conveniences, including in-unit laundry. Enjoy the benefits of a well-established community with no costly association amenities, allowing for a low-maintenance lifestyle. Fairfax Village is known for its friendly atmosphere and convenient access to local parks, perfect for outdoor activities and leisurely strolls. The neighborhood boasts excellent public services and is in proximity to highly regarded schools, making it an ideal location for those seeking a vibrant community. With on-street parking a
Key facts
- In unit laundry
- Public services
- Penthouse unit
Tags
Property features AI
Finance
- Other: Estimated year built; Estimated finished above-grade area: 644
- HOA & community: Monthly condo fee of $287.63 covering water, taxes, and trash; Pets allowed with size/weight restrictions
Exterior
- Parking: On-street parking
- Utilities: Public water; Public sewer; Electric cooling fuel; Central heating fuel
- Home design: Condominium; Penthouse unit; Garden-style building (1–4 stories)
- Construction: Brick construction; Above-grade structure
- Exterior features: Not in a federal flood zone; In city limits
Interior
- Bedrooms: Two bedrooms on main level
- Bathrooms: One full bathroom on main level; One full bathroom total
- Heating & cooling: Central heat; Central air conditioning; Electric hot water
- Interior features: Not furnished; No basement; Entry floor is on level 1
- Laundry & utility: Washer and dryer in unit; Washer/dryer hookup in unit
Neighborhood map
What this means for you Summary
Snapshot
- This is a 2-bed/1.0-bath condo listed at $148k. Condition is rated fair.
Deal economics
- At list price, monthly cash flow is $99 ($1k/yr) — positive.
- The deal already cash-flows at list — no discount required.
- Meets the 1% rule at list price ($2k rent vs $148k).
- Recommended offer: $139k (6.0% below list) — sets the bar for market timing.
- Cap rate 7.1% vs local median 2.5% in Washington — top-decile yield for the area; either an underpriced asset or a hidden risk that comps aren't pricing in. Stress-test before assuming the spread holds.
Location & tenants
- Location reads 73/100 on livability (#1 in DC) — a middle-class / working-renter tenant base. Strengths: amenities A+, commute A+, employment A+; Watch: crime F, cost of living F.
- District Of Columbia Public Schools (urban): math 33% / reading 40% proficiency, ranked #8 of 32 in DC (top 25%) — families likely to look elsewhere, expect single-tenant / working-renter base with shorter leases; 65% free/reduced lunch — lower-income household profile, screen leases tightly.
- Zoned schools: Beers Es (372 students, 0% FRL); Sousa Ms (215 students, 0% FRL); Anacostia Hs (287 students, 0% FRL) — zoned schools average 0% FRL vs 65% district-wide (65 pts lower); this property's tenant base skews higher-income than the district average.
- Market conditions: Rents rising (+3.9%/yr); 298 active listings in the ZIP; 40 comparable units currently listed for rent nearby; rentals at typical pace (median 21d on market — plan ~3-4 weeks tenant-placement turnaround); 1,737 units permitted in District of Columbia in 2024 (1,506 in 5+ unit buildings).
- This rent runs 40% of the median local income ($54k/yr) — at the standard rent-burdened threshold; future hikes will face affordability resistance.
Forward outlook
- Local home prices are declining (-3.0%/yr); year-one equity from $1k of loan paydown is wiped out by about $4k of value loss. Plan a longer hold.
- District of Columbia County population projected at +50% by 2050 — long-run rental-demand tailwind backs the buy-and-hold thesis.
Negotiation context
- It's been on market 62 days — a 6% lower offer ($139k) is reasonable based on typical stale-listing flexibility.
Risks & watch-outs
- Watch-outs: built in 1940 — expect roof / HVAC / electrical / plumbing capex.
- Climate carrying-cost: moderate wind risk, 22% chance of damaging wind over 30y; extreme-heat days projected 7→16/yr by 2055 (HVAC capex compounding) — expect insurance premiums to compound above CPI over the hold.
Questions for the listing agent
- It's been on market 62 days. Have you received any prior offers? Is the seller open to a 6% concession, seller financing, or rate buy-down credit?
- Have any recent inspections been done? Can we get a copy of the seller's disclosures and any deferred-maintenance estimates?
- Built in 1940 — when were the roof, HVAC, electrical panel, plumbing, and water heater last replaced?
- What does the HOA fee cover, when was the last increase, and are there any pending special assessments or reserve-fund shortfalls?
- Any open or pending special assessments — roof, HVAC, plumbing, elevator, façade? What's the per-unit balance and payoff schedule, and is the seller paying it off at close or rolling it to the buyer?
- Why hasn't it sold? Are there any deal-killer items the seller is aware of (foundation, flood, title, zoning, code violations)?
- Is there a deadline driving the sale (1031 exchange, divorce, estate, relocation)? That informs how much negotiation room exists.
- Crime grade is F in this area — have there been break-ins, vandalism, or insurance claims at this property in the last 3 years? What carrier currently insures it and at what premium?
- The area grade is low — what's the realistic commute time and amenity access for the typical tenant pool here? Any planned neighborhood developments (good or bad) we should know about?
- What's the average days-on-market for RENTAL listings here right now (not sales)? A rising rental-DOM trend means longer vacancies and softer asking-rent achievability than the comps imply.
- What's the recent tenant-quality profile in this submarket — average credit score on applications, eviction rate, late-payment / NSF rate, and stable-employment percentage? A property-management company in the area should have these aggregated.
- How much new apartment / multifamily construction is in the pipeline within 1–3 miles? Heavy new supply (>2% of stock underway) typically softens rents 12–24 months out; light construction supports rent growth.
Investment metrics
- 1% rule
- 1.20% ✓
- Cap rate
- 7.09%
- Cash-on-cash
- 2.86%
- DSCR
- 1.13
- GRM
- 6.9
CMA / ARV
No comps found within radius.
Projected returns pro-forma
-3.0% appreciation · 3.86% rent growth · sell at horizon
- IRR
- -10.4%
- Equity multiple
- 0.62×
- Total profit
- $-15,926
- Equity at exit
- $22,067
- IRR
- 0.5%
- Equity multiple
- 1.04×
- Total profit
- $1,564
- Equity at exit
- $12,796
Cash invested: $41,440 (down + closing). Projections, not guarantees.
Landlord ↔ Tenant lean methodology
- Overall (CITY)
- 0 Strongly Tenant-Friendly
- State District of Columbia
- 12 Strongly Tenant-Friendly · D+43
- County
- — inherits STATE
- City Washington
- 0 Strongly Tenant-Friendly · D+43
ZIP-level market 20020
- Rents YoY
- 3.9%
- Active inventory
- 298
- Price-to-rent
- 6.9×
Monthly cashflow live
- Estimated rent
- $1,783 high interval (Pro) →
- Mortgage (P&I)
- −$776
- Tax est. 1.5%
- −$185 /mo · $2,220/yr
- Insurance
- −$62
- HOA
- −$287
- Vacancy / Maint / Mgmt
- −$374
- Net cashflow
- $99
Break-even live
Sensitivity live
| Price | -10% $201 | -5% $150 | +0% $99 | +5% $48 | +10% $-3 |
|---|---|---|---|---|---|
| Rent | -10% $-42 | -5% $28 | +0% $99 | +5% $169 | +10% $240 |
| Rate | -1.0pp $173 | -0.5pp $137 | base $99 | +0.5pp $61 | +1.0pp $22 |
UW: 25.0% down · 7.5% · 30yr · 1.5% tax · 5.0% vac · 8.0% maint · 8.0% mgmt
Financing live
Cash to close
- Down payment
- $37,000
- Closing costs
- $4,440
- Reserves months
- —
- Total cash needed
- —
Loan-product check · same deal, 3 products live
Conventional
25% down · 7.5% · 30yr
- Down + closing
- —
- Monthly P&I
- —
- Monthly cashflow
- —
- DSCR
- —
- Eligible?
- —
Personal DTI + credit; lowest rate.
DSCR
20% down · 8.5% · 30yr
- Down + closing
- —
- Monthly P&I
- —
- Monthly cashflow
- —
- DSCR
- —
- Eligible?
- —
No personal income docs; deal must DSCR.
Hard money
10% down · 12.0% · 12mo
- Down + closing
- —
- Monthly P&I
- —
- Monthly cashflow
- —
- DSCR
- —
- Eligible?
- —
Short-term bridge; refi at stabilization.
Rent comps 40 comps
| Address | Beds | Baths | Sqft | Rent | $/sqft | DOM | Units | Dist |
|---|---|---|---|---|---|---|---|---|
| 2017 37th St SE #301 Washington, DC | 2.0 | 1.0 | 644 | $1,895 | $2.94 | 26d | 1 | 0.03mi |
| 2057 38th St SE #301 Washington, DC | 2.0 | 1.0 | 625 | $1,700 | $2.72 | 20d | 1 | 0.09mi |
| 3808 W St SE #101 Washington, DC | 2.0 | 1.0 | 623 | $2,200 | $3.53 | 26d | 1 | 0.14mi |
| 3811 V St SE Washington, DC | 2.0 | 1.0 | 629 | $1,595 | $2.54 | 4d | 1 | 0.14mi |
| 3812 W St SE #101 Washington, DC | 2.0 | 1.0 | 629 | $1,800 | $2.86 | 26d | 1 | 0.16mi |
| 2107 Fort Davis St SE #301 Washington, DC | 2.0 | 1.0 | 620 | $1,700 | $2.74 | 20d | 1 | 0.17mi |
| 2001 Fort Davis St SE #202 Washington, DC | 2.0 | 1.0 | 614 | $1,650 | $2.69 | 26d | 1 | 0.21mi |
| 2115 Suitland Ter SE Washington, DC | 2.0 | 1.0 | 637 | $1,595 | $2.50 | 1d | 1 | 0.27mi |
| 3923 Pennsylvania Ave SE #301 Washington, DC | 2.0 | 1.0 | 652 | $1,850 | $2.84 | 26d | 1 | 0.27mi |
| 2114 Suitland Ter SE Washington, DC | 2.0 | 1.0 | 650 | $1,800 | $2.77 | 26d | 1 | 0.28mi |
| 3956 Pennsylvania Ave SE #203 Washington, DC | 2.0 | 1.0 | 636 | $1,600 | $2.52 | 9d | 1 | 0.29mi |
| 3935 S St SE #304 Washington, DC | 2.0 | 1.0 | 735 | $2,500 | $3.40 | 26d | 1 | 0.31mi |
| 2103 Suitland Ter SE Washington, DC | 3.0 | 1.0 | 652 | $2,100 | $3.22 | 26d | 1 | 0.32mi |
| 3901 Suitland Rd Suitland, MD | 1.0–2.0 | 1.0 | 816 | $1,555 | $1.90 | 1d | 9 | 0.36mi |
| 3930 Suitland Rd Suitland, MD | 1.0–2.0 | 1.0 | 772 | $1,650 | $2.14 | 0d | 27 | 0.42mi |
| 4113 Southern Ave SE Capitol Heights, MD | 3.0 | 1.0–1.5 | 816 | $1,719 | $2.11 | 1d | 49 | 0.55mi |
| 3101 Pennsylvania Ave SE Washington, DC | 1.0 | 1.0 | 665 | $1,195 | $1.80 | 4d | 1 | 0.63mi |
| 1721 29th St SE Unit 1 Washington, DC | 1.0 | 1.0 | 725 | $1,395 | $1.92 | 22d | 1 | 0.73mi |
| 2219 Town Center Dr SE Washington, DC | 1.0 | 1.0 | 668 | $2,060 | $3.08 | 0d | 4 | 0.77mi |
| 3001 Branch Ave Temple Hills, MD | 2.0 | 1.0 | 769 | $2,043 | $2.66 | 1d | 40 | 0.80mi |
| 2801 R St SE Unit 2 Washington, DC | 2.0 | 1.0 | 700 | $1,569 | $2.24 | 26d | 1 | 0.82mi |
| 2562 Naylor Rd SE Washington, DC | 1.0–2.0 | 1.0 | 790 | $2,075 | $2.63 | 4d | 21 | 0.83mi |
| 4110 Suitland Rd Suitland, MD | 1.0–3.0 | 1.0–2.0 | 955 | $1,812 | $1.90 | 0d | 15 | 0.85mi |
| 1527 28th St SE Washington, DC | 1.0 | 1.0 | 700 | $1,150 | $1.64 | 26d | 1 | 0.90mi |
| 2607 Naylor Rd SE Washington, DC | 1.0 | 1.0 | 665 | $1,275 | $1.92 | 9d | 4 | 0.92mi |
| 2515 R St SE Washington, DC | 1.0–2.0 | 1.0 | 812 | $1,755 | $2.16 | 7d | 2 | 0.93mi |
| 1560 27th St SE Washington, DC | 1.0 | 1.0 | 660 | $1,100 | $1.67 | 26d | 1 | 0.93mi |
| 2847 Gainesville St SE Unit B2 Washington, DC | 2.0 | 1.0 | 710 | $1,700 | $2.39 | 26d | 1 | 0.93mi |
| 1550 27th St SE Washington, DC | 2.0 | 1.0 | 660 | $1,250 | $1.89 | 6d | 1 | 0.94mi |
| 1550 27th St SE Washington, DC | 1.0 | 1.0 | 550 | $1,100 | $2.00 | 26d | 1 | 0.94mi |
| 3105 Naylor Rd SE Washington, DC | 1.0 | 1.0 | 750 | $1,350 | $1.80 | 14d | 1 | 0.94mi |
| 3105 Naylor Rd SE #104 Washington, DC | 1.0 | 1.0 | 715 | $1,350 | $1.89 | 26d | 1 | 0.95mi |
| 3107 Naylor Rd SE #301 Washington, DC | 1.0 | 1.0 | 700 | $1,250 | $1.79 | 26d | 1 | 0.95mi |
| 3109 Naylor Rd SE Washington, DC | 2.0 | 1.0 | 655 | $1,904 | $2.91 | 9d | 1 | 0.95mi |
| 2439 25th St SE Washington, DC | 1.0 | 1.0 | 679 | $1,293 | $1.90 | 18d | 1 | 0.96mi |
| 2400 Good Hope Ct SE #204 Washington, DC | 1.0 | 1.0 | 610 | $1,550 | $2.54 | 1d | 1 | 1.00mi |
| 1501 27th St SE #406 Washington, DC | 1.0 | 1.0 | 598 | $1,350 | $2.26 | 16d | 1 | 1.00mi |
| 2843 Minnesota Ave SE Unit 1 Washington, DC | 1.0 | 1.0 | 631 | $1,285 | $2.04 | 26d | 1 | 1.03mi |
| 3035 30th St SE Washington, DC | 2.0 | 1.0 | 750 | $1,350 | $1.80 | 1d | 1 | 1.04mi |
| 4348 Southern Ave SE Washington, DC | 2.0 | 1.0 | 650 | $2,300 | $3.54 | 26d | 1 | 1.07mi |
HOA detail condo
- Monthly dues
- $287 · $3,444/yr
- Assessments
- None detected in remarks — confirm with the listing agent.
Listing history 15 events
-
2026-06-21days on market $148,000 Active 62 DOM
-
2026-06-18days on market $148,000 Active 59 DOM
-
2026-06-17days on market $148,000 Active 58 DOM
-
2026-06-16days on market $148,000 Active 57 DOM
-
2026-06-15days on market $148,000 Active 56 DOM
-
2026-06-13days on market $148,000 Active 54 DOM
-
2026-06-09days on market $148,000 Active 50 DOM
-
2026-06-08days on market $148,000 Active 49 DOM
-
2026-06-07days on market $148,000 Active 48 DOM
-
2026-06-04days on market $148,000 Active 45 DOM
-
2026-06-03days on market $148,000 Active 44 DOM
-
2026-06-02days on market $148,000 Active 43 DOM
-
2026-06-01days on market $148,000 Active 42 DOM
-
2026-05-31days on market $148,000 Active 41 DOM
-
2026-04-20$148,000 Active
ⓘ Source: listings_history table (triggers on properties + properties_extension) + one-shot
backfill from property_details.listing_events for pre-trigger history.
Climate risk First Street
- Flood 1/10 Low FEMA zone X (unshaded) · 0% chance over 30 yrs
- Wildfire 1/10 Low
- Heat 7/10 Severe 7 d/yr ≥104°F today · 16 d/yr by 30 yrs out
- Wind 5/10 Major 22% chance of damaging wind over 30 yrs
- Air quality 4/10 Moderate 4 unhealthy d/yr today · 5 by 30 yrs out
Nearby sold comps map
Loading sold comps map…
Walkable amenities ~0.75 mi
Loading nearby amenities…
Taxation est. · year 1
- Rental income
- $21,397
- − Mortgage interest
- −$8,290
- − Property taxes
- −$2,220
- − Insurance
- −$740
- − Repairs & maintenance
- −$1,712
- − Management
- −$1,712
- − HOA
- −$3,444
- − Depreciation
- −$4,305
- Taxable loss
- −$1,026
- Est. tax savings @ 24.0%
- +$246
- After-tax cash flow
- $1,433/yr
For passive investors: Depreciation is non-cash, so a rental often shows a tax loss while cash-flowing — sheltering income. Rental losses are passive: they offset passive income freely, and up to $25,000/yr can offset ordinary (W-2) income if you actively participate and your MAGI is under $100k (phasing out to $0 by $150k); unused losses carry forward. On sale, claimed depreciation is recaptured at up to 25%, and gains may owe capital-gains tax (a 1031 exchange can defer both). Figures are a year-1 estimate at your 24.0% rate — not tax advice; consult a CPA.
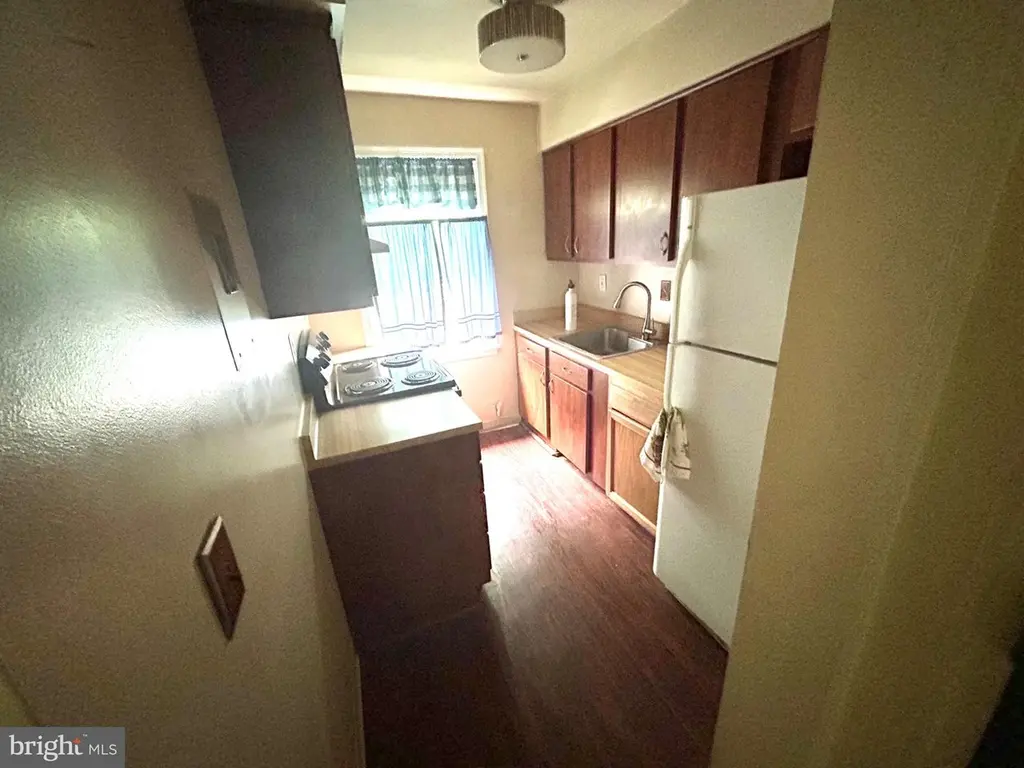
Condition & rehab AI · 6 photos
This 1940s-era condo unit requires moderate renovations to bring it up to modern standards, with a focus on updating the kitchen and bathrooms, painting, and replacing carpet. The property has potential for significant value increase with these improvements.
Repairs flagged
- Minor kitchen cabinets — Light wear and tear
- Minor bathroom fixtures — Light wear and tear
- Moderate carpet — Worn and needs replacement
- Minor paint — Light wear and tear
Value-add opportunities
- Both painting — Fresh paint can make the space feel new and inviting.
- Both new carpet — New carpet can improve comfort and appearance.
- Both kitchen and bathroom updates — Fresh updates can make the space more modern and appealing to potential buyers/renters.
Renovation cost estimate screening
| Repair item | Severity | Est. cost |
|---|---|---|
| kitchen cabinets · Light wear and tear | Minor | $500–3,000 |
| bathroom fixtures · Light wear and tear | Minor | $500–3,000 |
| carpet · Worn and needs replacement | Moderate | $3,000–15,000 |
| paint · Light wear and tear | Minor | $500–3,000 |
| Total estimated repair cost · 4 items | $4,500–24,000 |
Value-add ROI direction
- Both painting — Fresh paint can make the space feel new and inviting. ↑
- Both new carpet — New carpet can improve comfort and appearance. ↑
- Both kitchen and bathroom updates — Fresh updates can make the space more modern and appealing to potential buyers/renters. ↑
ⓘ Cost ranges are severity-bucket heuristics (US national rule-of-thumb). Get contractor quotes + a written scope before underwriting a rehab budget.
Schools (NCES district)
- District
- District Of Columbia Public Schools
- NCES district ID
- 1100030
- Math proficiency
- 33% ▲ 3.00%
- Reading proficiency
- 40% ▲ 5.00%
- Median HH income
- $67,671
- Composite
- 35.84/100
- National rank
- #9606
- State rank
- #8 of 32 in DC
Livability — Washington
- Score
- 73/100
- State rank
- #1
- US rank
- #5327
Category grades
Schools grade is shown separately in the Schools card above.
Census & demographics
- Census place
- Washington, DC
- County
- District of Columbia · 671,873 people
- City population
- 671,873
- Metro
- Washington-Arlington-Alexandria, DC-VA-MD-WV
- Population (ZIP)
- 53,005
- Household income
- $54,032
- Rent vs Own
- Severe rent burden
- 5148.0
Population outlook (District of Columbia County) Hauer SSP2
- Today (2025)
- 821,926 people
- By 2030
- 899,517 · +9.4%
- By 2040
- 1,061,162 · +29.1%
- By 2050
- 1,231,493 · +49.8%
- By 2075
- 1,603,312 · +95.1%
- By 2100
- 1,847,141 · +124.7%
Race, ethnicity, and origin ACS 2023
- Neighborhood character
- Predominantly Black (90%)
- Race & ethnicity
- Black 90% Two or more races 3% Hispanic / Latino 3% White 3%
- Common ancestry
- Lithuanian 1%
- Foreign-born
- 3% · Canada
- Languages at home
- 95% English-only · Spanish 2% French/Haitian/Cajun 1%
Political lean MEDSL · District of Columbia
- 2024 margin
- Solid D (+86.1) · D 91.2% · R 5.1% · Other 3.8%
- 2008→2024 swing
- +0.1pp no change · 2008: 85.9pp · 2024: 86.1pp
- All cycles
- 2024: D+86.1 2020: D+86.8 2016: D+88.7 2012: D+84.2 2008: D+85.9
Not yet ingested
- Civics
- —
Market trends
- HPI YoY
- ▼ -415.44%
- Current HPI
- 306.5068
- Rent YoY
- ▲ 3.86%
- Metro
- Washington-Arlington-Alexandria, DC-VA-MD-WV
- State GDP YoY
- ▲ 1.33%
- F500 in state
- 6
Industry mix (Fortune 500 HQ in DC)
| Industry | F500 HQs | Revenue |
|---|---|---|
| Financial Services | 1 | $153B |
|
||
| Life Sciences / Industrials | 1 | $25B |
|
||
| Industrial Machinery | 1 | $8B |
|
||
Price history
1 event — show timeline
- 2026-04-20 Listed $148,000 BRIGHT MLS
Cash-flow waterfall
monthlySold comps — $/sqft
last 12 mo · ≤1 miLoading sold comps…