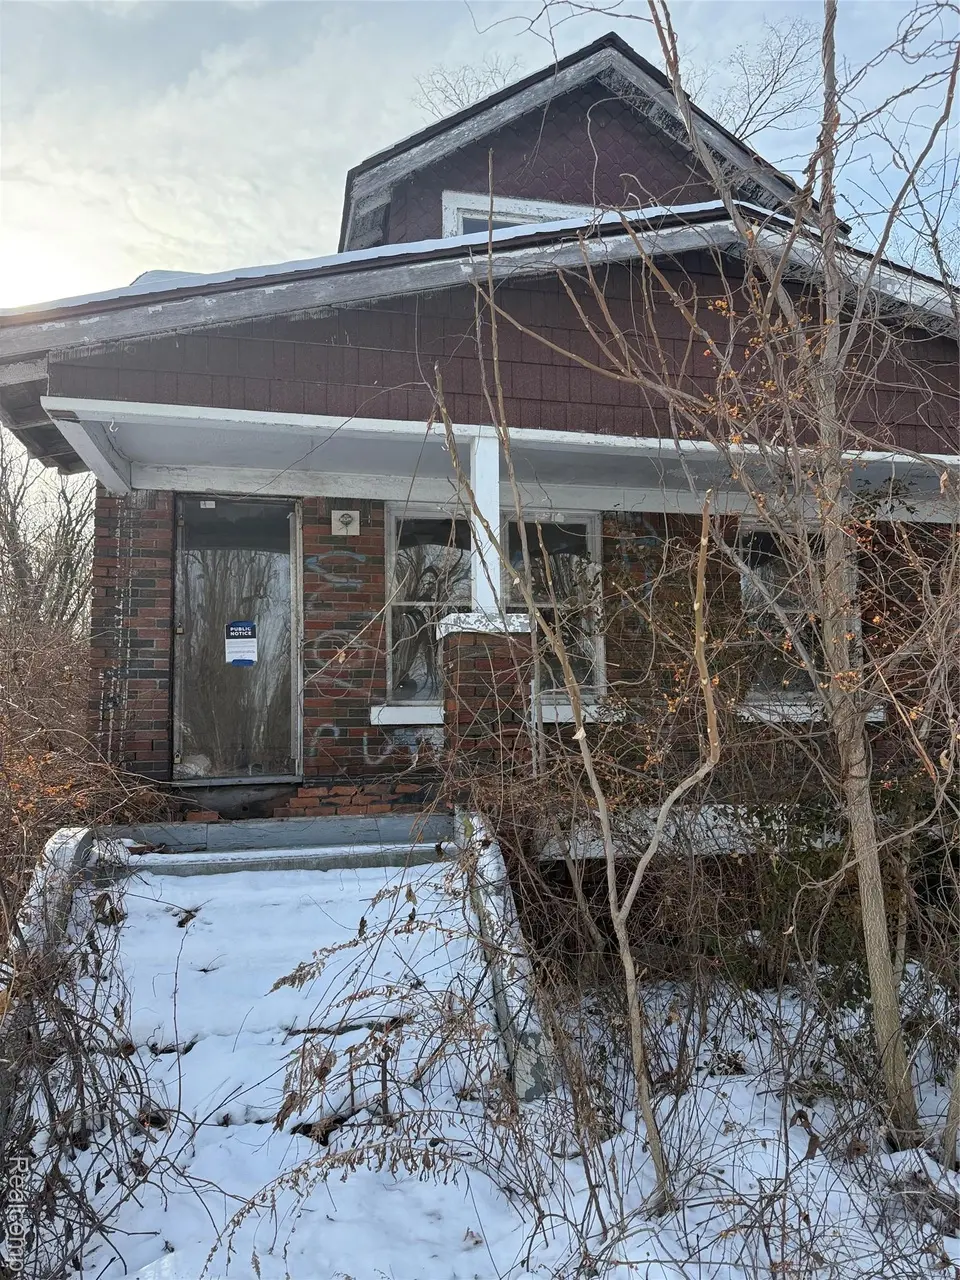
8611 Chalfonte St · Detroit, MI
Flood risk 1/10 · Minimal
- FEMA flood zone
- X (unshaded)
- Chance of flooding over 30 yrs
- 0.0%
- Est. flood insurance / yr
- $507 – $1,088
Fire risk 1/10 · Minimal
- Est. fire insurance / yr
- $784 – $1,456
Heat risk 3/10 · Minor
- Hot days now (above 97°F)
- 7 days/yr
- Hot days in 30 yrs
- 15 days/yr
Wind risk 2/10 · Minimal
- Chance of severe wind over 30 yrs
- —
Air-quality risk 3/10 · Minor
- Unhealthy air days now
- 2 days/yr
- Unhealthy air days in 30 yrs
- 5 days/yr
Risk factors via First Street. Map © Google.
Why this score? — see what drove the D grade
The composite is a weighted blend of 9 inputs, each scored 0–100. Each bar is that input's sub-score; the figure is the points it added to the 100-point composite (weight × sub-score).
- Cash flow +15.0/30.0
- ARV discount +7.5/15.0
- 1% rule +5.0/10.0
- DSCR +5.0/10.0
- Rent growth +4.0/5.0
- Livability +3.7/5.0
- Condition / age +2.5/5.0
- Schools +1.3/10.0
- Appreciation +0.0/10.0
$16,000
🖨 Deal sheet (PDF) 📄 Offer letter ✓ Due diligence
Listing remarks MLS
DLBA-owned 3-bedroom, 1-bath residential property located in the Chalfonte neighborhood. Property is being sold together with one adjacent vacant lot, included in the total purchase price of $16,000. Adjacent lot address: 8601 Chalfonte, Detroit, MI . Sale is subject to approval by the Detroit Land Bank Authority (DLBA) and execution of a DLBA Renovation/Development Agreement. Purchaser must submit a complete proposal to DLBA, including intended use and renovation timeline, proof of funds, scope of work with cost breakdown, and documentation of prior renovation projects (addresses and photos). The DLBA recommends reviewing all applicable Neighborhood Framework Plans through the City of Detroit Planning and Development Department for additional neighborhood context. DLBA retains the right to tax recapture for five (5) years following transfer of ownership. This may be incompatible with certain tax abatements or lot combinations. Waiver requests will be reviewed on a case-by-case basis and may require payment in lieu of taxes, subject to review of development pro forma and financing.
Key facts
- 3,920 sq ft lot
- Built 1925
- Listed 179 days
Neighborhood map
What this means for you Summary
Snapshot
- This is a 3-bed/1.0-bath single-family listed at $16k.
Deal economics
- At list price, monthly cash flow is $831 ($10k/yr) — positive.
- The deal already cash-flows at list — no discount required.
- Meets the 1% rule at list price ($1k rent vs $16k).
- Recommended offer: $14k (12.0% below list) — sets the bar for market timing.
- Cap rate 68.6% vs local median 10.0% in Detroit — top-decile yield for the area; either an underpriced asset or a hidden risk that comps aren't pricing in. Stress-test before assuming the spread holds.
Location & tenants
- Location reads 73/100 on livability (#218 in MI) — a middle-class / working-renter tenant base. Strengths: amenities A+, commute A+, cost of living A+; Watch: crime F, employment F.
- Detroit Public Schools Community District (urban): math 10% / reading 24% proficiency, ranked #499 of 540 in MI (top 92%) — low school quality limits family demand, transient renter base, plan for 1-2y turnover; 90% free/reduced lunch — lower-income household profile, screen leases tightly.
- Zoned schools: Mary Mcleod Bethune Elementarymiddle School (706 students, 91% FRL); Mumford High School (math 24% / reading 24%, grade F, #481 of 713 statewide, top 81%, 889 students, 86% FRL) — zoned schools at 89% FRL track the district average.
- Market conditions: Rents rising fast (+6.1%/yr); 350 active listings in the ZIP; 40 comparable units currently listed for rent nearby; rentals at typical pace (median 27d on market — plan ~3-4 weeks tenant-placement turnaround); lower-income renter base — watch delinquency; 2,639 units permitted in Wayne County in 2024 (1,216 in 5+ unit buildings).
- This rent runs 43% of the median local income ($33k/yr) — at the standard rent-burdened threshold; future hikes will face affordability resistance.
Forward outlook
- Local home prices are declining (-3.0%/yr); year-one equity from $111 of loan paydown is wiped out by about $480 of value loss. Plan a longer hold.
- Wayne County population projected at -17% by 2050 — secular population decline; favor cash flow + early exit over multi-decade hold.
- At projected returns (-3.0% appreciation + 6.1% rent growth), your $4k cash investment doubles in ~1 year — after that, you're playing with house money.
Negotiation context
- It's been on market 179 days — a 12% lower offer ($14k) is reasonable based on typical stale-listing flexibility.
- 4 sale attempts since 21y ago with the ask held roughly flat each time — persistent listings suggest the price (not the market) is what's stuck; bring a comps-based counter.
Risks & watch-outs
- Watch-outs: built in 1925 — expect roof / HVAC / electrical / plumbing capex.
Questions for the listing agent
- It's been on market 179 days. Have you received any prior offers? Is the seller open to a 12% concession, seller financing, or rate buy-down credit?
- Built in 1925 — when were the roof, HVAC, electrical panel, plumbing, and water heater last replaced?
- Why hasn't it sold? Are there any deal-killer items the seller is aware of (foundation, flood, title, zoning, code violations)?
- Is there a deadline driving the sale (1031 exchange, divorce, estate, relocation)? That informs how much negotiation room exists.
- Schools are F-rated, which usually means shorter tenancies and higher turnover. Who's the typical renter profile here, and what's been the actual vacancy rate?
- Crime grade is F in this area — have there been break-ins, vandalism, or insurance claims at this property in the last 3 years? What carrier currently insures it and at what premium?
- The area grade is low — what's the realistic commute time and amenity access for the typical tenant pool here? Any planned neighborhood developments (good or bad) we should know about?
- What's the average days-on-market for RENTAL listings here right now (not sales)? A rising rental-DOM trend means longer vacancies and softer asking-rent achievability than the comps imply.
- What's the recent tenant-quality profile in this submarket — average credit score on applications, eviction rate, late-payment / NSF rate, and stable-employment percentage? A property-management company in the area should have these aggregated.
- How much new for-sale + rental construction is in the pipeline within 1–3 miles? Heavy new supply typically softens prices + rents 12–24 months out; constrained supply supports both.
Investment metrics
- 1% rule
- 7.45% ✓
- Cap rate
- 68.59%
- Cash-on-cash
- 222.51%
- DSCR
- 10.90
- GRM
- 1.1
CMA / ARV
- ARV (median comp)
- $41,854
- List price
- $16,000
- Delta
- -61.77%
- Verdict
- UNDERPRICED
- Comps
- 20 within 1.0 mi
Show comp detail 12 sales within ~0.75 mi
| Address | Dist | Beds/Ba | Sqft | Sold | Price | $/sf | Match |
|---|---|---|---|---|---|---|---|
| 14811 Northlawn St | 0.17mi | 3/1.0 | 851 (+3%) | 16mo | $79,000 | $93 | 74 |
| 14677 Cloverlawn Ave | 0.23mi | 3/1.5 | 900 (+9%) | 2mo | $20,000 | $22 | 71 |
| 14619 Greenlawn St | 0.34mi | 2/1.0 (-1) | 804 (-2%) | 5mo | $52,000 | $65 | 71 |
| 14601 San Juan Dr | 0.55mi | 3/1.5 | 816 (-1%) | 4mo | $37,000 | $45 | 67 |
| 14284 Kentucky St | 0.51mi | 2/1.0 (-1) | 825 (0%) | 8mo | $27,000 | $33 | 64 |
| 14611 Washburn St | 0.34mi | 2/1.0 (-1) | 790 (-4%) | 10mo | $34,900 | $44 | 63 |
| 16135 Cherrylawn St | 0.71mi | 3/1.0 | 816 (-1%) | 7mo | $70,000 | $86 | 59 |
| 14887 Mendota St | 0.49mi | 3/1.0 | 803 (-3%) | 20mo | $25,000 | $31 | 56 |
| 7300 Ellsworth St | 0.63mi | 2/1.0 (-1) | 836 (+1%) | 10mo | $30,000 | $36 | 55 |
| 14014 Washburn St | 0.72mi | 2/1.0 (-1) | 876 (+6%) | 3mo | $17,000 | $19 | 49 |
| 15417 Pinehurst St | 0.63mi | 3/1.0 | 796 (-4%) | 21mo | $8,000 | $10 | 47 |
| 7326 Ellsworth St | 0.61mi | 2/1.0 (-1) | 756 (-8%) | 13mo | $35,000 | $46 | 42 |
Match score weights: distance 35% · size 25% · config 20% · recency 20%. Top-matched comps best support the ARV.
Projected returns pro-forma
-3.0% appreciation · 6.14% rent growth · sell at horizon
- IRR
- —
- Equity multiple
- 13.10×
- Total profit
- $54,215
- Equity at exit
- $2,386
- IRR
- —
- Equity multiple
- 30.55×
- Total profit
- $132,403
- Equity at exit
- $1,383
Cash invested: $4,480 (down + closing). Projections, not guarantees.
Landlord ↔ Tenant lean methodology
- Overall (STATE)
- 62 Landlord-Friendly
- State Michigan
- 62 Landlord-Friendly · EVEN
- County
- — inherits STATE
- City
- — inherits STATE
ZIP-level market 48238
- Home prices YoY
- -14.4%
- Rents YoY
- 6.1%
- Active inventory
- 350
- Price-to-rent
- 1.1×
Monthly cashflow live
- Estimated rent
- $1,191 high interval (Pro) →
- Mortgage (P&I)
- −$84
- Tax from tax record
- −$20 /mo · $240/yr
- Insurance
- −$7
- HOA
- −$0
- Vacancy / Maint / Mgmt
- −$250
- Net cashflow
- $831
Break-even live
Sensitivity live
| Price | -10% $840 | -5% $835 | +0% $831 | +5% $826 | +10% $822 |
|---|---|---|---|---|---|
| Rent | -10% $737 | -5% $784 | +0% $831 | +5% $878 | +10% $925 |
| Rate | -1.0pp $839 | -0.5pp $835 | base $831 | +0.5pp $827 | +1.0pp $822 |
UW: 25.0% down · 7.5% · 30yr · 1.5% tax · 5.0% vac · 8.0% maint · 8.0% mgmt
Financing live
Cash to close
- Down payment
- $4,000
- Closing costs
- $480
- Reserves months
- —
- Total cash needed
- —
Loan-product check · same deal, 3 products live
Conventional
25% down · 7.5% · 30yr
- Down + closing
- —
- Monthly P&I
- —
- Monthly cashflow
- —
- DSCR
- —
- Eligible?
- —
Personal DTI + credit; lowest rate.
DSCR
20% down · 8.5% · 30yr
- Down + closing
- —
- Monthly P&I
- —
- Monthly cashflow
- —
- DSCR
- —
- Eligible?
- —
No personal income docs; deal must DSCR.
Hard money
10% down · 12.0% · 12mo
- Down + closing
- —
- Monthly P&I
- —
- Monthly cashflow
- —
- DSCR
- —
- Eligible?
- —
Short-term bridge; refi at stabilization.
Rent comps 40 comps
| Address | Beds | Baths | Sqft | Rent | $/sqft | DOM | Units | Dist |
|---|---|---|---|---|---|---|---|---|
| 14570 Cherrylawn St Detroit, MI | 3.0 | 1.0 | 840 | $1,250 | $1.49 | 14d | 1 | 0.27mi |
| 14656 Roselawn St Detroit, MI | 3.0 | 1.0 | 1000 | $1,200 | $1.20 | 19d | 1 | 0.31mi |
| 14550 Northlawn St Detroit, MI | 3.0 | 2.0 | 950 | $1,200 | $1.26 | 18d | 1 | 0.31mi |
| 14881 Mendota St Detroit, MI | 3.0 | 1.0 | 1026 | $1,100 | $1.07 | 26d | 1 | 0.47mi |
| 15777 Wisconsin St Unit 77 Detroit, MI | 2.0 | 1.0 | 900 | $950 | $1.06 | 7d | 1 | 0.51mi |
| 15765 Washburn St Unit 15767 Washburn Upper Detroit, MI | 2.0 | 1.0 | 1093 | $950 | $0.87 | 0d | 1 | 0.55mi |
| 15839 Kentucky St Detroit, MI | 2.0 | 1.0 | 800 | $1,200 | $1.50 | 19d | 1 | 0.61mi |
| 15512 Mendota St Detroit, MI | 2.0 | 1.0 | 931 | $1,200 | $1.29 | 7d | 1 | 0.61mi |
| 15512 Mendota St Apt 2 Detroit, MI | 2.0 | 1.0 | 1000 | $1,200 | $1.20 | 45d | 1 | 0.61mi |
| 15771 Turner St Detroit, MI | 2.0 | 1.0 | 1000 | $1,049 | $1.05 | 45d | 1 | 0.62mi |
| 15878 Kentucky St Detroit, MI | 2.0 | 1.0 | 800 | $900 | $1.12 | 45d | 1 | 0.64mi |
| 15760 Monte Vista St Detroit, MI | 2.0 | 1.0 | 1080 | $1,250 | $1.16 | 45d | 1 | 0.75mi |
| 7350 Globe St Detroit, MI | 3.0 | 1.0 | 1000 | $1,550 | $1.55 | 5d | 1 | 0.75mi |
| 14950 Stoepel St Detroit, MI | 2.0 | 1.0 | 600 | $900 | $1.50 | 26d | 1 | 0.77mi |
| 15388 Appoline St #203 Detroit, MI | 2.0 | 1.0 | 900 | $850 | $0.94 | 45d | 1 | 0.78mi |
| 16230 Indiana St Unit 2 Detroit, MI | 2.0 | 1.0 | 1050 | $1,200 | $1.14 | 20d | 1 | 0.81mi |
| 2690 Ewald Cir Detroit, MI | 1.0–2.0 | 1.0 | 750 | $900 | $1.20 | 26d | 4 | 0.95mi |
| 15738 Sorrento Ave Detroit, MI | 3.0 | 1.0 | 762 | $1,175 | $1.54 | 45d | 1 | 0.96mi |
| 13620 Tuller St Detroit, MI | 4.0 | 1.0 | 1064 | $1,374 | $1.29 | 14d | 1 | 0.96mi |
| 14847 Cheyenne St Detroit, MI | 3.0 | 2.0 | 849 | $1,150 | $1.35 | 20d | 1 | 0.97mi |
| 2926 Ewald Cir Detroit, MI | 2.0 | 1.0 | 800 | $900 | $1.12 | 19d | 1 | 1.00mi |
| 16204 Steel St Detroit, MI | 3.0 | 1.0 | 969 | $1,150 | $1.19 | 45d | 1 | 1.11mi |
| 15340 Hartwell St Detroit, MI | 2.0 | 1.0 | 900 | $1,300 | $1.44 | 18d | 1 | 1.13mi |
| 14891 Hartwell St Detroit, MI | 3.0 | 1.0 | 1000 | $1,150 | $1.15 | 45d | 1 | 1.14mi |
| 16722 Tuller St Detroit, MI | 3.0 | 1.5 | 1100 | $1,500 | $1.36 | 18d | 1 | 1.14mi |
| 17159 Northlawn St Unit 17161 Detroit, MI | 2.0 | 1.0 | 1122 | $975 | $0.87 | 7d | 1 | 1.24mi |
| 14903 Tracey St Detroit, MI | 3.0 | 1.0 | 1004 | $1,100 | $1.10 | 18d | 1 | 1.25mi |
| 16503 Ward Ave Unit 2 Detroit, MI | 2.0 | 1.0 | 700 | $850 | $1.21 | 45d | 1 | 1.26mi |
| 3812 W Grand St Detroit, MI | 2.0 | 1.0 | 1100 | $1,025 | $0.93 | 18d | 1 | 1.29mi |
| 2034 Ewald Cir Detroit, MI | 2.0 | 1.0 | 1000 | $995 | $0.99 | 7d | 1 | 1.31mi |
| 15387 Lesure St Detroit, MI | 3.0 | 1.0 | 1064 | $1,350 | $1.27 | 14d | 1 | 1.33mi |
| 4045 Clements St Detroit, MI | 3.0 | 1.0 | 850 | $1,150 | $1.35 | 45d | 1 | 1.33mi |
| 4045 Clements St Detroit, MI | 3.0 | 1.0 | 850 | $1,150 | $1.35 | 26d | 1 | 1.33mi |
| 15517 Lesure St Unit BDRM1A Detroit, MI | 2.0 | 1.0 | 1000 | $850 | $0.85 | 26d | 1 | 1.37mi |
| 17147 Monica St Unit 2 1 Detroit, MI | 2.0 | 1.0 | 900 | $975 | $1.08 | 26d | 1 | 1.37mi |
| 17150 Meyers Rd Detroit, MI | 1.0–2.0 | 1.0 | 775 | $975 | $1.26 | 45d | 2 | 1.39mi |
| 17145 Santa Rosa Dr Unit 1 Detroit, MI | 3.0 | 1.0 | 1050 | $1,400 | $1.33 | 20d | 1 | 1.39mi |
| 12468 Mendota St Detroit, MI | 2.0 | 1.0 | 1100 | $1,100 | $1.00 | 45d | 1 | 1.44mi |
| 12468 Mendota St Detroit, MI | 2.0 | 1.0 | 1100 | $1,000 | $0.91 | 26d | 1 | 1.44mi |
| 4203 Tyler St Detroit, MI | 2.0 | 1.0 | 950 | $895 | $0.94 | 45d | 1 | 1.45mi |
Listing history 22 events
-
2026-06-21days on market $16,000 Active 179 DOM
-
2026-06-18days on market $16,000 Active 176 DOM
-
2026-06-17days on market $16,000 Active 175 DOM
-
2026-06-15days on market $16,000 Active 173 DOM
-
2026-06-13days on market $16,000 Active 171 DOM
-
2026-06-13days on market $16,000 Active 170 DOM
-
2026-06-09days on market $16,000 Active 167 DOM
-
2026-06-08days on market $16,000 Active 166 DOM
-
2026-06-07days on market $16,000 Active 165 DOM
-
2026-06-04days on market $16,000 Active 162 DOM
-
2026-06-03days on market $16,000 Active 161 DOM
-
2026-06-01days on market $16,000 Active 159 DOM
-
2026-05-31days on market $16,000 Active 158 DOM
-
2025-12-24$16,000 Active 1098-char remark
Show marketing remark (1098 chars)
DLBA-owned 3-bedroom, 1-bath residential property located in the Chalfonte neighborhood. Property is being sold together with one adjacent vacant lot, included in the total purchase price of $16,000. Adjacent lot address: 8601 Chalfonte, Detroit, MI . Sale is subject to approval by the Detroit Land Bank Authority (DLBA) and execution of a DLBA Renovation/Development Agreement. Purchaser must submit a complete proposal to DLBA, including intended use and renovation timeline, proof of funds, scope of work with cost breakdown, and documentation of prior renovation projects (addresses and photos). The DLBA recommends reviewing all applicable Neighborhood Framework Plans through the City of Detroit Planning and Development Department for additional neighborhood context. DLBA retains the right to tax recapture for five (5) years following transfer of ownership. This may be incompatible with certain tax abatements or lot combinations. Waiver requests will be reviewed on a case-by-case basis and may require payment in lieu of taxes, subject to review of development pro forma and financing.
-
2007-01-30soldstatus $70,000
-
2006-01-25soldstatus $18,000
-
2006-01-24soldstatus $18,000
-
2006-01-23historical
-
2005-04-20$23,900
-
2005-04-19$23,900
-
2003-11-12soldstatus $95,000
ⓘ Source: listings_history table (triggers on properties + properties_extension) + one-shot
backfill from property_details.listing_events for pre-trigger history.
Tax reassessment forecast MI · Partial reset (capped growth)
- Current annual tax
- $240 · $20/mo
- Projected year-2 tax
- $243 · $20/mo
- Expected delta
- +$3/yr ($0/mo · 1.3%)
ⓘ Screening estimate from a state-policy table — verify with the county assessor before closing.
Climate risk First Street
- Flood 1/10 Low FEMA zone X (unshaded) · 0% chance over 30 yrs
- Wildfire 1/10 Low
- Heat 3/10 Moderate 7 d/yr ≥97°F today · 15 d/yr by 30 yrs out
- Wind 2/10 Low
- Air quality 3/10 Moderate 2 unhealthy d/yr today · 5 by 30 yrs out
Nearby sold comps map
Loading sold comps map…
Walkable amenities ~0.75 mi
Loading nearby amenities…
Taxation est. · year 1
- Rental income
- $14,298
- − Mortgage interest
- −$896
- − Property taxes
- −$240
- − Insurance
- −$80
- − Repairs & maintenance
- −$1,144
- − Management
- −$1,144
- − Depreciation
- −$465
- Taxable income
- $10,328
- Est. tax owed @ 24.0%
- −$2,479
- After-tax cash flow
- $7,489/yr
For passive investors: Depreciation is non-cash, so a rental often shows a tax loss while cash-flowing — sheltering income. Rental losses are passive: they offset passive income freely, and up to $25,000/yr can offset ordinary (W-2) income if you actively participate and your MAGI is under $100k (phasing out to $0 by $150k); unused losses carry forward. On sale, claimed depreciation is recaptured at up to 25%, and gains may owe capital-gains tax (a 1031 exchange can defer both). Figures are a year-1 estimate at your 24.0% rate — not tax advice; consult a CPA.
Schools (NCES district)
- District
- Detroit Public Schools Community District
- NCES district ID
- 2601103
- Math proficiency
- 10% ▼ -2.00%
- Reading proficiency
- 24% ▲ 6.00%
- Median HH income
- $25,815
- Composite
- 13.06/100
- National rank
- #9564
- State rank
- #499 of 540 in MI
Livability — Detroit
- Score
- 73/100
- State rank
- #218
- US rank
- #5427
Category grades
Schools grade is shown separately in the Schools card above.
Census & demographics
- Census place
- Detroit, MI
- County
- Wayne County · 1,562,939 people
- City population
- 572,865
- Metro
- Detroit-Warren-Dearborn, MI
- Population (ZIP)
- 24,731
- Household income
- $33,315
- Rent vs Own
- Severe rent burden
- 2172.0
Population outlook (Wayne County) Hauer SSP2
- Today (2025)
- 1,675,273 people
- By 2030
- 1,620,300 · -3.3%
- By 2040
- 1,502,341 · -10.3%
- By 2050
- 1,384,039 · -17.4%
- By 2075
- 1,124,592 · -32.9%
- By 2100
- 881,193 · -47.4%
Race, ethnicity, and origin ACS 2023
- Neighborhood character
- Predominantly Black (94%)
- Race & ethnicity
- Black 94% Two or more races 3% White 1%
- Foreign-born
- 1%
Political lean MEDSL · Wayne
- 2024 margin
- Strong D (+29.0) · D 62.7% · R 33.7% · Other 3.6%
- 2008→2024 swing
- -20.5pp toward R · 2008: 49.5pp · 2024: 29.0pp
- All cycles
- 2024: D+29.0 2020: D+38.1 2016: D+37.3 2012: D+46.9 2008: D+49.5
Not yet ingested
- Civics
- —
Market trends
- HPI YoY
- ▼ -31.96%
- Current HPI
- 189.6227
- Rent YoY
- ▲ 6.14%
- Metro
- Detroit-Warren-Dearborn, MI
- State GDP YoY
- ▲ 1.37%
- F500 in state
- 28
Industry mix (Fortune 500 HQ in MI)
| Industry | F500 HQs | Revenue |
|---|---|---|
| Automotive Parts | 3 | $48B |
|
||
| Automotive | 2 | $372B |
|
||
| Chemicals | 1 | $45B |
|
||
| Automotive Retail | 1 | $29B |
|
||
| Healthcare / Medical Devices | 1 | $23B |
|
||
| Automotive Technology | 1 | $20B |
|
||
Price history
-83.2% since first listed9 events — show timeline
- 2025-12-24 Listed $16,000 REALCOMP
- 2025-12-24 Listed $16,000 MiRealSource-MiMLS
- 2007-01-30 Sold (Public Records) $70,000 Public Records
- 2006-01-25 Sold (MLS) $18,000 MiRealSource-MiMLS
- 2006-01-24 Sold (MLS) $18,000 REALCOMP
- 2006-01-23 Listing Removed — MiRealSource-MiMLS
- 2005-04-20 Listed $23,900 MiRealSource-MiMLS
- 2005-04-19 Listed $23,900 REALCOMP
- 2003-11-12 Sold (Public Records) $95,000 Public Records
Property tax history
+0.0%/yrLatest (2016): $240 · +0.0% YoY. Source: county tax records.
Cash-flow waterfall
monthlySold comps — $/sqft
last 12 mo · ≤1 miLoading sold comps…