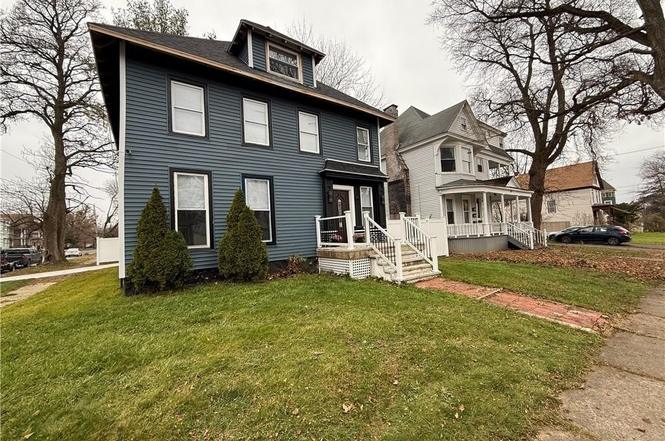
10 Grant St · Utica, NY
Flood risk 1/10 · Minimal
- FEMA flood zone
- X (unshaded)
- Chance of flooding over 30 yrs
- 0.0%
- Est. flood insurance / yr
- $473 – $860
Fire risk 3/10 · Minor
- Est. fire insurance / yr
- $691 – $1,283
Heat risk 3/10 · Minor
- Hot days now (above 95°F)
- 7 days/yr
- Hot days in 30 yrs
- 16 days/yr
Wind risk 1/10 · Minimal
- Chance of severe wind over 30 yrs
- 1.0%
Air-quality risk 2/10 · Minimal
- Unhealthy air days now
- 0 days/yr
- Unhealthy air days in 30 yrs
- 2 days/yr
Risk factors via First Street. Map © Google.
Why this score? — see what drove the D grade
The composite is a weighted blend of 9 inputs, each scored 0–100. Each bar is that input's sub-score; the figure is the points it added to the 100-point composite (weight × sub-score).
- Cash flow +14.5/30.0
- Appreciation +10.0/10.0
- DSCR +4.4/10.0
- Livability +4.0/5.0
- 1% rule +3.2/10.0
- Schools +2.9/10.0
- Rent growth +2.5/5.0
- Condition / age +2.5/5.0
- ARV discount +0.0/15.0
$287,900
🖨 Deal sheet (PDF) 📄 Offer letter ✓ Due diligence
Listing remarks
Completely remodeled South Utica corner lot home. Move right in. Home features new stainless steel island style kitchen with new cabinets, flooring, + fixtures. Expansive style layout with trey ceilings and recessed lighting. Enjoy your new spa like main bathroom with walk-in shower and soaking tub. New windows, flooring, + lighting. Just know that your exterior is complete with new roof, siding, + windows. Enjoy your new private fenced in backyard with new vinyl fencing. Remodeled garage + porches. Like we said, pack your bags and move right into this fantastic South Utica opportunity. Your new home awaits!!!
Key facts
- Soaking tub
- New vinyl fencing
- Walk-in shower
Tags
Neighborhood map
What this means for you Summary
Snapshot
- This is a 4-bed/1.5-bath single-family listed at $288k.
Deal economics
- At list price, monthly cash flow is $63 ($759/yr) — positive.
- The deal already cash-flows at list — no discount required.
- To meet the 1% rule (rent ≥ 1% of price), the offer needs to be $235k (18.3% below list).
- Recommended offer: $235k (18.3% below list) — sets the bar for 1% rule.
Location & tenants
- Location reads 80/100 on livability (#104 in NY, #1,589 nationally) — a professional / high-income tenant draw. Strengths: commute A+, cost of living A+, housing A+; Watch: employment D, schools D-, crime F.
- Utica City School District (urban): math 33% / reading 38% proficiency, ranked #562 of 590 in NY (top 95%) — families likely to look elsewhere, expect single-tenant / working-renter base with shorter leases; 71% free/reduced lunch — lower-income household profile, screen leases tightly.
- Market conditions: 143 active listings in the ZIP; 3 comparable units currently listed for rent nearby; rentals lingering (median 44d on market — plan ~5-8 weeks vacancy on turnover, expect pricing pressure); 100% of comp listings sitting > 30 days — soft ceiling on asking rent; 204 units permitted in Oneida County in 2024 (68 in 5+ unit buildings).
- At $2,351/mo this rent would consume 54% of the median local household income ($53k/yr) (locally 2251% of renters already pay >50% of income on rent) — very limited rent-growth headroom before tenants either downsize or default.
Forward outlook
- In year one you build about $31k of equity ($2k loan paydown + $29k appreciation (10.0% local appreciation)).
- Oneida County population projected at -12% by 2050 — secular population decline; favor cash flow + early exit over multi-decade hold.
- At projected returns (10.0% appreciation + 3.0% rent growth), your $81k cash investment doubles in ~3 years — after that, you're playing with house money.
- By year 2, paydown + projected appreciation supports a ~$49k cash-out refi (75% LTV) — recoverable capital for the next deal without selling this one.
Negotiation context
- Only 6 days on market — expect competitive offers; lowballing is unlikely to land.
- 5 sale attempts since 4y ago with the ask held roughly flat each time — persistent listings suggest the price (not the market) is what's stuck; bring a comps-based counter.
- Current owner paid $169k; list at $288k implies a 70% gain — meaningful room to come down on a strong offer.
Risks & watch-outs
- Watch-outs: built in 1925 — expect roof / HVAC / electrical / plumbing capex.
Questions for the listing agent
- Built in 1925 — when were the roof, HVAC, electrical panel, plumbing, and water heater last replaced?
- Is there a deadline driving the sale (1031 exchange, divorce, estate, relocation)? That informs how much negotiation room exists.
- Schools are D-rated, which usually means shorter tenancies and higher turnover. Who's the typical renter profile here, and what's been the actual vacancy rate?
- Crime grade is F in this area — have there been break-ins, vandalism, or insurance claims at this property in the last 3 years? What carrier currently insures it and at what premium?
- The area grade is low — what's the realistic commute time and amenity access for the typical tenant pool here? Any planned neighborhood developments (good or bad) we should know about?
- What's the average days-on-market for RENTAL listings here right now (not sales)? A rising rental-DOM trend means longer vacancies and softer asking-rent achievability than the comps imply.
- What's the recent tenant-quality profile in this submarket — average credit score on applications, eviction rate, late-payment / NSF rate, and stable-employment percentage? A property-management company in the area should have these aggregated.
- How much new for-sale + rental construction is in the pipeline within 1–3 miles? Heavy new supply typically softens prices + rents 12–24 months out; constrained supply supports both.
Investment metrics
- 1% rule
- 0.82% ✗
- Cap rate
- 6.56%
- Cash-on-cash
- 0.94%
- DSCR
- 1.04
- GRM
- 10.2
CMA / ARV
- ARV (on-the-fly)
- $197,690
- Comps found
- 12
Show comp detail 12 sales within ~0.75 mi
| Address | Dist | Beds/Ba | Sqft | Sold | Price | $/sf | Match |
|---|---|---|---|---|---|---|---|
| 119 Pleasant St | 0.29mi | 4/1.5 | 1,913 (+3%) | 2mo | $192,500 | $101 | 80 |
| 1548 Kemble St | 0.30mi | 4/2.0 | 1,906 (+2%) | 14mo | $180,200 | $95 | 69 |
| 18 Avery Pl | 0.20mi | 4/2.0 | 1,694 (-9%) | 9mo | $200,000 | $118 | 66 |
| 1628 Miller St | 0.61mi | 4/1.0 | 1,900 (+2%) | 7mo | $55,000 | $29 | 60 |
| 1803 Baker Ave | 0.32mi | 3/2.0 (-1) | 1,638 (-12%) | 1mo | $223,000 | $136 | 57 |
| 806 Mildred Ave | 0.57mi | 4/1.5 | 1,974 (+6%) | 11mo | $210,000 | $106 | 55 |
| 804 Symonds Pl | 0.61mi | 4/1.5 | 1,661 (-11%) | 4mo | $180,000 | $108 | 50 |
| 12 Rose Pl | 0.45mi | 3/1.5 (-1) | 1,616 (-13%) | 5mo | $185,600 | $115 | 47 |
| 28 Prospect St | 0.73mi | 4/1.5 | 1,703 (-9%) | 9mo | $163,500 | $96 | 44 |
| 1214 Noyes St | 0.71mi | 5/2.0 (+1) | 1,750 (-6%) | 9mo | $125,000 | $71 | 42 |
| 1420 Lenox Ave | 0.58mi | 5/2.0 (+1) | 2,058 (+10%) | 8mo | $150,000 | $73 | 42 |
| 225 Pleasant St | 0.65mi | 3/2.0 (-1) | 1,600 (-14%) | 11mo | $187,620 | $117 | 30 |
Match score weights: distance 35% · size 25% · config 20% · recency 20%. Top-matched comps best support the ARV.
Projected returns pro-forma
10.0% appreciation · 3.0% rent growth · sell at horizon
- IRR
- 24.9%
- Equity multiple
- 2.99×
- Total profit
- $160,741
- Equity at exit
- $259,363
- IRR
- 22.0%
- Equity multiple
- 6.83×
- Total profit
- $470,020
- Equity at exit
- $559,326
Cash invested: $80,612 (down + closing). Projections, not guarantees.
Landlord ↔ Tenant lean methodology
- Overall (STATE)
- 15 Strongly Tenant-Friendly
- State New York
- 15 Strongly Tenant-Friendly · D+10
- County
- — inherits STATE
- City
- — inherits STATE
ZIP-level market 13501
- Home prices YoY
- 5.6%
- Active inventory
- 143
- Price-to-rent
- 10.2×
Monthly cashflow live
- Estimated rent
- $2,351 medium interval (Pro) →
- Mortgage (P&I)
- −$1,510
- Tax from tax record
- −$164 /mo · $1,974/yr
- Insurance
- −$120
- HOA
- −$0
- Vacancy / Maint / Mgmt
- −$494
- Net cashflow
- $63
Break-even live
Sensitivity live
| Price | -10% $226 | -5% $145 | +0% $63 | +5% $-18 | +10% $-100 |
|---|---|---|---|---|---|
| Rent | -10% $-123 | -5% $-30 | +0% $63 | +5% $156 | +10% $249 |
| Rate | -1.0pp $208 | -0.5pp $136 | base $63 | +0.5pp $-11 | +1.0pp $-87 |
UW: 25.0% down · 7.5% · 30yr · 1.5% tax · 5.0% vac · 8.0% maint · 8.0% mgmt
Financing live
Cash to close
- Down payment
- $71,975
- Closing costs
- $8,637
- Reserves months
- —
- Total cash needed
- —
Loan-product check · same deal, 3 products live
Conventional
25% down · 7.5% · 30yr
- Down + closing
- —
- Monthly P&I
- —
- Monthly cashflow
- —
- DSCR
- —
- Eligible?
- —
Personal DTI + credit; lowest rate.
DSCR
20% down · 8.5% · 30yr
- Down + closing
- —
- Monthly P&I
- —
- Monthly cashflow
- —
- DSCR
- —
- Eligible?
- —
No personal income docs; deal must DSCR.
Hard money
10% down · 12.0% · 12mo
- Down + closing
- —
- Monthly P&I
- —
- Monthly cashflow
- —
- DSCR
- —
- Eligible?
- —
Short-term bridge; refi at stabilization.
Rent comps 3 comps
| Address | Beds | Baths | Sqft | Rent | $/sqft | DOM | Units | Dist |
|---|---|---|---|---|---|---|---|---|
| 1804 Storrs Ave Utica, NY | 3.0 | 1.5 | 1633 | $3,000 | $1.84 | 44d | 1 | 0.35mi |
| 1642 Taylor Ave #1644 Utica, NY | 3.0 | 1.0 | 2600 | $1,650 | $0.63 | 44d | 1 | 0.93mi |
| 1124 Dudley Ave Unit 1 Utica, NY | 3.0 | 1.0 | 1300 | $1,400 | $1.08 | 44d | 1 | 1.12mi |
Listing history 13 events
-
2026-03-05status Pending
-
2026-02-27$287,900 Active
-
2026-02-21historical
-
2025-11-21$294,900 Active
-
2025-10-08historical
-
2025-08-07price $299,900
-
2025-07-08$325,000 Active
-
2023-10-31soldstatus $169,000
-
2023-02-28historical
-
2022-11-09$169,000 Active
-
2022-09-21historical
-
2022-08-29$200,000 Active
-
2002-09-30soldstatus $14,000
ⓘ Source: listings_history table (triggers on properties + properties_extension) + one-shot
backfill from property_details.listing_events for pre-trigger history.
Tax reassessment forecast NY · Partial reset (capped growth)
- Current annual tax
- $1,974 · $164/mo
- Projected year-2 tax
- $3,420 · $285/mo
- Expected delta
- +$1,446/yr (+$120/mo · 73.2%)
ⓘ Screening estimate from a state-policy table — verify with the county assessor before closing.
Climate risk First Street
- Flood 1/10 Low FEMA zone X (unshaded) · 0% chance over 30 yrs
- Wildfire 3/10 Moderate
- Heat 3/10 Moderate 7 d/yr ≥95°F today · 16 d/yr by 30 yrs out
- Wind 1/10 Low 100% chance of damaging wind over 30 yrs
- Air quality 2/10 Low 0 unhealthy d/yr today · 2 by 30 yrs out
Nearby sold comps map
Loading sold comps map…
Walkable amenities ~0.75 mi
Loading nearby amenities…
Taxation est. · year 1
- Rental income
- $28,215
- − Mortgage interest
- −$16,127
- − Property taxes
- −$1,974
- − Insurance
- −$1,440
- − Repairs & maintenance
- −$2,257
- − Management
- −$2,257
- − Depreciation
- −$8,375
- Taxable loss
- −$4,215
- Est. tax savings @ 24.0%
- +$1,012
- After-tax cash flow
- $1,771/yr
For passive investors: Depreciation is non-cash, so a rental often shows a tax loss while cash-flowing — sheltering income. Rental losses are passive: they offset passive income freely, and up to $25,000/yr can offset ordinary (W-2) income if you actively participate and your MAGI is under $100k (phasing out to $0 by $150k); unused losses carry forward. On sale, claimed depreciation is recaptured at up to 25%, and gains may owe capital-gains tax (a 1031 exchange can defer both). Figures are a year-1 estimate at your 24.0% rate — not tax advice; consult a CPA.
Schools (NCES district)
- District
- Utica City School District
- NCES district ID
- 3629370
- Math proficiency
- 33% ▼ -7.00%
- Reading proficiency
- 38% ▲ 2.00%
- Median HH income
- $31,834
- Composite
- 29.01/100
- National rank
- #6613
- State rank
- #562 of 590 in NY
Livability — Utica
- Score
- 80/100
- State rank
- #104
- US rank
- #1589
Category grades
Schools grade is shown separately in the Schools card above.
Census & demographics
- Census place
- Utica, NY
- County
- Oneida County · 89,710 people
- City population
- 72,968
- Metro
- Utica-Rome, NY
- Population (ZIP)
- 38,931
- Household income
- $52,548
- Rent vs Own
- Severe rent burden
- 2251.0
Population outlook (Oneida County) Hauer SSP2
- Today (2025)
- 225,223 people
- By 2030
- 220,384 · -2.1%
- By 2040
- 209,071 · -7.2%
- By 2050
- 197,920 · -12.1%
- By 2075
- 175,541 · -22.1%
- By 2100
- 148,491 · -34.1%
Race, ethnicity, and origin ACS 2023
- Neighborhood character
- Highly diverse neighborhood (Simpson 0.70)
- Race & ethnicity
- White 49% Two or more races 15% Hispanic / Latino 14% Black 14% Asian 14%
- Hispanic origin (detail)
- Puerto Rican 8% Dominican 4%
- Common ancestry
- American 8% Romanian 3% Lithuanian 1%
- Foreign-born
- 25% · Canada, Philippines, Vietnam
- Languages at home
- 62% English-only · Other Asian/Pacific 11% Russian/Polish/Slavic 10% Spanish 9%
Political lean MEDSL · Oneida
- 2024 margin
- Strong R (+21.3) · D 39.4% · R 60.6%
- 2008→2024 swing
- -15.2pp toward R · 2008: -6.1pp · 2024: -21.3pp
- All cycles
- 2024: R+21.3 2020: R+15.5 2016: R+21.1 2012: R+5.3 2008: R+6.1
Not yet ingested
- Civics
- —
Market trends
- HPI YoY
- ▲ 20.28%
- Current HPI
- 382.3726
- Rent YoY
- —
- Metro
- Utica-Rome, NY
- State GDP YoY
- ▲ 2.60%
- F500 in state
- 92
Industry mix (Fortune 500 HQ in NY)
| Industry | F500 HQs | Revenue |
|---|---|---|
| Financial Services | 10 | $950B |
|
||
| Consumer Goods | 9 | $162B |
|
||
| Insurance | 4 | $225B |
|
||
| Telecommunications | 2 | $144B |
|
||
| Pharmaceuticals | 2 | $112B |
|
||
| Media / Entertainment | 2 | $69B |
|
||
Price history
+1956.4% since first listed13 events — show timeline
- 2026-03-05 Pending — CNYIS
- 2026-02-27 Listed $287,900 CNYIS
- 2026-02-21 Listing Removed — CNYIS
- 2025-11-21 Listed $294,900 CNYIS
- 2025-10-08 Listing Removed — CNYIS
- 2025-08-07 Price Changed $299,900 CNYIS
- 2025-07-08 Listed $325,000 CNYIS
- 2023-10-31 Sold (Public Records) $169,000 Public Records
- 2023-02-28 Listing Removed — CNYIS
- 2022-11-09 Listed $169,000 CNYIS
- 2022-09-21 Listing Removed — WNYREIS
- 2022-08-29 Listed $200,000 WNYREIS
- 2002-09-30 Sold (Public Records) $14,000 Public Records
Property tax history
+3.4%/yrLatest (2025): $1,974 · -0.4% YoY. Source: county tax records.
Cash-flow waterfall
monthlySold comps — $/sqft
last 12 mo · ≤1 miLoading sold comps…