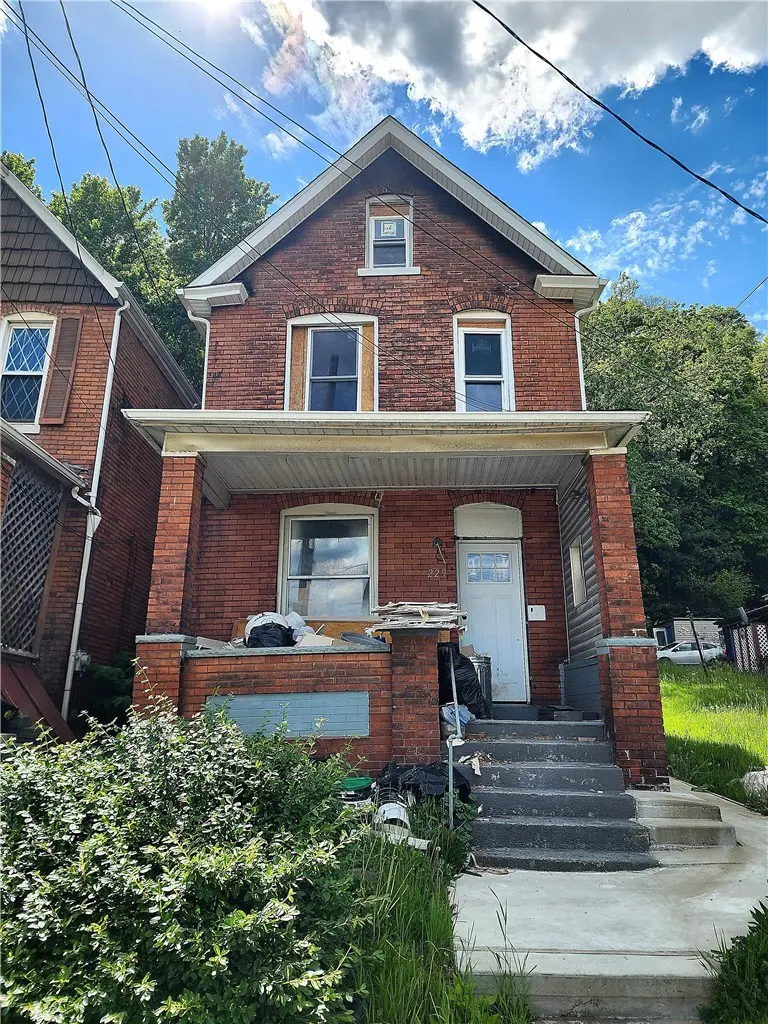
229 Freeport Rd · Arnold, PA
Flood risk 6/10 · Moderate
- FEMA flood zone
- X (unshaded)
- Chance of flooding over 30 yrs
- 0.69%
- Est. flood insurance / yr
- $473 – $860
Fire risk 1/10 · Minimal
- Est. fire insurance / yr
- $511 – $949
Heat risk 4/10 · Minor
- Hot days now (above 98°F)
- 7 days/yr
- Hot days in 30 yrs
- 18 days/yr
Wind risk 2/10 · Minimal
- Chance of severe wind over 30 yrs
- —
Air-quality risk 4/10 · Minor
- Unhealthy air days now
- 5 days/yr
- Unhealthy air days in 30 yrs
- 6 days/yr
Risk factors via First Street. Map © Google.
Why this score? — see what drove the B+ grade
The composite is a weighted blend of 9 inputs, each scored 0–100. Each bar is that input's sub-score; the figure is the points it added to the 100-point composite (weight × sub-score).
- Cash flow +30.0/30.0
- ARV discount +15.0/15.0
- DSCR +10.0/10.0
- 1% rule +9.5/10.0
- Schools +4.3/10.0
- Livability +3.2/5.0
- Rent growth +2.5/5.0
- Condition / age +2.5/5.0
- Appreciation +1.7/10.0
$85,000
🖨 Deal sheet (PDF) 📄 Offer letter ✓ Due diligence
Listing remarks MLS
Awesome investment Opportunity! Solid brick home in East Deer Township. Bring your tools and vision to transform this space to your liking.
Key facts
- Local amenities
- Solid brick home
- 7,501 sq ft lot
Tags
Property features AI
Finance
- Financial info: Annual taxes approximately $1,201
Exterior
- Parking: Assigned parking
- Home design: 2-story building
- Exterior features: Lot approximately 0.172 acres; Resale property
Interior
- Bathrooms: 1 full bathroom
- Heating & cooling: Central air conditioning; Gas heating
- Interior features: Basement present
Neighborhood map
What this means for you Summary
Snapshot
- This is a 3-bed/1.0-bath single-family listed at $85k.
Deal economics
- At list price, monthly cash flow is $393 ($5k/yr) — positive.
- The deal already cash-flows at list — no discount required.
- Meets the 1% rule at list price ($1k rent vs $85k).
- Recommended offer: $82k (3.0% below list) — sets the bar for market timing.
Location & tenants
- Location reads 64/100 on livability (#1,212 in PA) — a middle-class / working-renter tenant base. Strengths: cost of living A+, housing A+; Watch: crime F, amenities F, commute F.
- Deer Lakes SD (suburban): math 39% / reading 59% proficiency, ranked #182 of 539 in PA (top 34%) — families likely to look elsewhere, expect single-tenant / working-renter base with shorter leases.
- Zoned schools: East Union Intrmd Sch (math 37% / reading 61%, grade D, #712 of 1,518 statewide, top 47%, 377 students, 49% FRL); Deer Lakes Ms (math 36% / reading 58%, grade D+, #163 of 512 statewide, top 33%, 422 students, 38% FRL); Deer Lakes Hs (math 52%, 583 students, 28% FRL) — zoned schools average 38% FRL vs 22% district-wide (17 pts higher); higher-poverty schools than district average — tighter screening recommended.
- Market conditions: 2 active listings in the ZIP; 5 comparable units currently listed for rent nearby; rentals at typical pace (median 26d on market — plan ~3-4 weeks tenant-placement turnaround); 40% of comp listings sitting > 30 days — soft ceiling on asking rent; 2,996 units permitted in Allegheny County in 2024 (1,588 in 5+ unit buildings).
Forward outlook
- Local home prices are declining (-3.0%/yr); year-one equity from $588 of loan paydown is wiped out by about $3k of value loss. Plan a longer hold.
- At projected returns (-3.0% appreciation + 3.0% rent growth), your $24k cash investment doubles in ~7 years — after that, you're playing with house money.
Negotiation context
- It's been on market 47 days — a 3% lower offer ($82k) is reasonable based on typical stale-listing flexibility.
- 2 sale attempts since 2y ago with the ask held roughly flat each time — persistent listings suggest the price (not the market) is what's stuck; bring a comps-based counter.
- Current owner paid $65k; 32% above their basis — modest negotiation headroom, anchor on the comps not their cost.
Risks & watch-outs
- Watch-outs: built in 1940 — expect roof / HVAC / electrical / plumbing capex.
- Climate carrying-cost: major flood risk — expect insurance premiums to compound above CPI over the hold.
Questions for the listing agent
- It's been on market 47 days. Have you received any prior offers? Is the seller open to a 3% concession, seller financing, or rate buy-down credit?
- Built in 1940 — when were the roof, HVAC, electrical panel, plumbing, and water heater last replaced?
- Is there a deadline driving the sale (1031 exchange, divorce, estate, relocation)? That informs how much negotiation room exists.
- Schools are D-rated, which usually means shorter tenancies and higher turnover. Who's the typical renter profile here, and what's been the actual vacancy rate?
- Crime grade is F in this area — have there been break-ins, vandalism, or insurance claims at this property in the last 3 years? What carrier currently insures it and at what premium?
- What's the average days-on-market for RENTAL listings here right now (not sales)? A rising rental-DOM trend means longer vacancies and softer asking-rent achievability than the comps imply.
- What's the recent tenant-quality profile in this submarket — average credit score on applications, eviction rate, late-payment / NSF rate, and stable-employment percentage? A property-management company in the area should have these aggregated.
- How much new for-sale + rental construction is in the pipeline within 1–3 miles? Heavy new supply typically softens prices + rents 12–24 months out; constrained supply supports both.
Investment metrics
- 1% rule
- 1.45% ✓
- Cap rate
- 11.85%
- Cash-on-cash
- 19.84%
- DSCR
- 1.88
- GRM
- 5.7
CMA / ARV
- ARV (median comp)
- $118,411
- List price
- $85,000
- Delta
- -28.22%
- Verdict
- UNDERPRICED
- Comps
- 20 within 1.0 mi
Show comp detail 10 sales within ~0.75 mi
| Address | Dist | Beds/Ba | Sqft | Sold | Price | $/sf | Match |
|---|---|---|---|---|---|---|---|
| 227 Freeport | 0.00mi | 2/1.0 (-1) | 1,496 (0%) | 20mo | $20,000 | $13 | 79 |
| 421 Freeport Rd | 0.28mi | 3/1.0 | 1,416 (-5%) | 2mo | $110,000 | $78 | 76 |
| 414 Marion St | 0.24mi | 3/2.0 | 1,344 (-10%) | 4mo | $184,000 | $137 | 64 |
| 128 Yost Dr | 0.51mi | 3/2.5 | 1,478 (-1%) | 9mo | $270,000 | $183 | 60 |
| 555 Marion St | 0.47mi | 4/2.0 (+1) | 1,553 (+4%) | 6mo | $65,000 | $42 | 58 |
| 1249 Leishman Ave | 0.73mi | 3/1.0 | 1,444 (-4%) | 10mo | $30,571 | $21 | 52 |
| 252 Catalpa St | 0.71mi | 3/2.0 | 1,434 (-4%) | 5mo | $26,500 | $18 | 51 |
| 511 Marion St | 0.37mi | 2/2.0 (-1) | 1,356 (-9%) | 15mo | $123,000 | $91 | 46 |
| 1240 Leishman Ave | 0.75mi | 4/1.5 (+1) | 1,500 (+0%) | 23mo | $149,900 | $100 | 38 |
| 1327 Kenneth Ave | 0.67mi | 3/1.0 | 1,668 (+12%) | 24mo | $63,500 | $38 | 30 |
Match score weights: distance 35% · size 25% · config 20% · recency 20%. Top-matched comps best support the ARV.
Projected returns pro-forma
-3.0% appreciation · 3.0% rent growth · sell at horizon
- IRR
- 12.0%
- Equity multiple
- 1.47×
- Total profit
- $11,297
- Equity at exit
- $12,674
- IRR
- 20.9%
- Equity multiple
- 2.77×
- Total profit
- $42,160
- Equity at exit
- $7,349
Cash invested: $23,800 (down + closing). Projections, not guarantees.
Landlord ↔ Tenant lean methodology
- Overall (STATE)
- 62 Landlord-Friendly
- State Pennsylvania
- 62 Landlord-Friendly · EVEN
- County
- — inherits STATE
- City
- — inherits STATE
ZIP-level market 15030
- Home prices YoY
- -3.5%
- Active inventory
- 2
- Price-to-rent
- 5.7×
Monthly cashflow live
- Estimated rent
- $1,234 high interval (Pro) →
- Mortgage (P&I)
- −$446
- Tax from tax record
- −$100 /mo · $1,201/yr
- Insurance
- −$35
- HOA
- −$0
- Vacancy / Maint / Mgmt
- −$259
- Net cashflow
- $393
Break-even live
Sensitivity live
| Price | -10% $442 | -5% $417 | +0% $393 | +5% $369 | +10% $345 |
|---|---|---|---|---|---|
| Rent | -10% $296 | -5% $345 | +0% $393 | +5% $442 | +10% $491 |
| Rate | -1.0pp $436 | -0.5pp $415 | base $393 | +0.5pp $371 | +1.0pp $349 |
UW: 25.0% down · 7.5% · 30yr · 1.5% tax · 5.0% vac · 8.0% maint · 8.0% mgmt
Financing live
Cash to close
- Down payment
- $21,250
- Closing costs
- $2,550
- Reserves months
- —
- Total cash needed
- —
Loan-product check · same deal, 3 products live
Conventional
25% down · 7.5% · 30yr
- Down + closing
- —
- Monthly P&I
- —
- Monthly cashflow
- —
- DSCR
- —
- Eligible?
- —
Personal DTI + credit; lowest rate.
DSCR
20% down · 8.5% · 30yr
- Down + closing
- —
- Monthly P&I
- —
- Monthly cashflow
- —
- DSCR
- —
- Eligible?
- —
No personal income docs; deal must DSCR.
Hard money
10% down · 12.0% · 12mo
- Down + closing
- —
- Monthly P&I
- —
- Monthly cashflow
- —
- DSCR
- —
- Eligible?
- —
Short-term bridge; refi at stabilization.
Rent comps 5 comps
| Address | Beds | Baths | Sqft | Rent | $/sqft | DOM | Units | Dist |
|---|---|---|---|---|---|---|---|---|
| 1330 Woodmont Ave New Kensington, PA | 3.0 | 1.0 | 1250 | $1,100 | $0.88 | 12d | 1 | 0.87mi |
| 542 5th Ave Unit 1 New Kensington, PA | 2.0 | 1.0 | 890 | $825 | $0.93 | 25d | 1 | 0.96mi |
| 826 North St New Kensington, PA | 4.0 | 1.5 | 1250 | $1,495 | $1.20 | 0d | 1 | 1.07mi |
| 915 Evans St New Kensington, PA | 3.0 | 2.0 | 1152 | $1,295 | $1.12 | 45d | 1 | 1.16mi |
| 1134 Strawn Ave New Kensington, PA | 3.0 | 1.0 | 1084 | $1,500 | $1.38 | 45d | 1 | 1.40mi |
Listing history 23 events
-
2026-06-21days on market $85,000 Active 47 DOM
-
2026-06-18days on market $85,000 Active 44 DOM
-
2026-06-17days on market $85,000 Active 43 DOM
-
2026-06-16days on market $85,000 Active 42 DOM
-
2026-06-15days on market $85,000 Active 41 DOM
-
2026-06-13days on market $85,000 Active 39 DOM
-
2026-06-09days on market $85,000 Active 35 DOM
-
2026-06-08days on market $85,000 Active 34 DOM
-
2026-06-07days on market $85,000 Active 33 DOM
-
2026-06-05days on market $85,000 Active 30 DOM
-
2026-06-03days on market $85,000 Active 29 DOM
-
2026-06-02days on market $85,000 Active 28 DOM
-
2026-06-01days on market $85,000 Active 27 DOM
-
2026-05-31days on market $85,000 Active 26 DOM
-
2026-05-05$85,000 Active 633-char remark
-
2024-09-05soldstatus $64,600
-
2024-08-23status Pending 139-char remark
Show marketing remark (139 chars)
Awesome investment Opportunity! Solid brick home in East Deer Township. Bring your tools and vision to transform this space to your liking.
-
2024-08-19soldstatus $8,500 Closed 139-char remark
Show marketing remark (139 chars)
Awesome investment Opportunity! Solid brick home in East Deer Township. Bring your tools and vision to transform this space to your liking.
-
2024-07-18historical Contingent 139-char remark
Show marketing remark (139 chars)
Awesome investment Opportunity! Solid brick home in East Deer Township. Bring your tools and vision to transform this space to your liking.
-
2024-07-11price $10,000 139-char remark
Show marketing remark (139 chars)
Awesome investment Opportunity! Solid brick home in East Deer Township. Bring your tools and vision to transform this space to your liking.
-
2024-06-27$15,000 Active 139-char remark
Show marketing remark (139 chars)
Awesome investment Opportunity! Solid brick home in East Deer Township. Bring your tools and vision to transform this space to your liking.
-
2004-12-15soldstatus $12,500
-
1982-04-22soldstatus $18,500
ⓘ Source: listings_history table (triggers on properties + properties_extension) + one-shot
backfill from property_details.listing_events for pre-trigger history.
Tax reassessment forecast PA · Partial reset (capped growth)
- Current annual tax
- $1,201 · $100/mo
- Projected year-2 tax
- $1,272 · $106/mo
- Expected delta
- +$71/yr (+$6/mo · 5.9%)
ⓘ Screening estimate from a state-policy table — verify with the county assessor before closing.
Climate risk First Street
- Flood 6/10 Major FEMA zone X (unshaded) · 69% chance over 30 yrs
- Wildfire 1/10 Low
- Heat 4/10 Moderate 7 d/yr ≥98°F today · 18 d/yr by 30 yrs out
- Wind 2/10 Low
- Air quality 4/10 Moderate 5 unhealthy d/yr today · 6 by 30 yrs out
Nearby sold comps map
Loading sold comps map…
Walkable amenities ~0.75 mi
Loading nearby amenities…
Taxation est. · year 1
- Rental income
- $14,805
- − Mortgage interest
- −$4,761
- − Property taxes
- −$1,201
- − Insurance
- −$425
- − Repairs & maintenance
- −$1,184
- − Management
- −$1,184
- − Depreciation
- −$2,473
- Taxable income
- $3,576
- Est. tax owed @ 24.0%
- −$858
- After-tax cash flow
- $3,863/yr
For passive investors: Depreciation is non-cash, so a rental often shows a tax loss while cash-flowing — sheltering income. Rental losses are passive: they offset passive income freely, and up to $25,000/yr can offset ordinary (W-2) income if you actively participate and your MAGI is under $100k (phasing out to $0 by $150k); unused losses carry forward. On sale, claimed depreciation is recaptured at up to 25%, and gains may owe capital-gains tax (a 1031 exchange can defer both). Figures are a year-1 estimate at your 24.0% rate — not tax advice; consult a CPA.
Schools (NCES district)
- District
- Deer Lakes SD
- NCES district ID
- 4207540
- Math proficiency
- 39% ▼ -13.00%
- Reading proficiency
- 59% ▼ -10.00%
- Median HH income
- $57,944
- Composite
- 42.64/100
- National rank
- #3183
- State rank
- #182 of 539 in PA
Livability — Arnold
- Score
- 64/100
- State rank
- #1212
- US rank
- #14318
Category grades
Schools grade is shown separately in the Schools card above.
Census & demographics
- Population (ZIP)
- 1,044
Population outlook (Allegheny County) Hauer SSP2
- Today (2025)
- 1,250,282 people
- By 2030
- 1,256,482 · +0.5%
- By 2040
- 1,256,318 · +0.5%
- By 2050
- 1,244,169 · -0.5%
- By 2075
- 1,197,693 · -4.2%
- By 2100
- 1,093,187 · -12.6%
Race, ethnicity, and origin ACS 2023
- Neighborhood character
- Predominantly White (93%)
- Race & ethnicity
- White 93% Two or more races 3% Black 2% Hispanic / Latino 1%
- Common ancestry
- Romanian 6% Slovak 6% Lithuanian 3%
- Foreign-born
- 2% · Canada, South Korea, Vietnam
- Languages at home
- 97% English-only · Spanish 2%
Political lean MEDSL · Allegheny
- 2024 margin
- Strong D (+20.3) · D 59.7% · R 39.4%
- 2008→2024 swing
- +4.8pp toward D · 2008: 15.5pp · 2024: 20.3pp
- All cycles
- 2024: D+20.3 2020: D+20.4 2016: D+16.4 2012: D+14.4 2008: D+15.5
Not yet ingested
- Civics
- —
Market trends
- HPI YoY
- ▼ -6.59%
- Current HPI
- 183.3853
- Rent YoY
- —
- Metro
- —
- State GDP YoY
- ▲ 1.68%
- F500 in state
- 34
Industry mix (Fortune 500 HQ in PA)
| Industry | F500 HQs | Revenue |
|---|---|---|
| Healthcare | 2 | $309B |
|
||
| Insurance | 2 | $27B |
|
||
| Telecommunications / Media | 1 | $124B |
|
||
| Industrial Distribution | 1 | $22B |
|
||
| Financial Services | 1 | $20B |
|
||
| Chemicals / Materials | 1 | $18B |
|
||
Price history
+359.5% since first listed9 events — show timeline
- 2026-05-05 Listed $85,000 West Penn MLS
- 2024-09-05 Sold (Public Records) $64,600 Public Records
- 2024-08-23 Pending — West Penn MLS
- 2024-08-19 Sold (MLS) $8,500 West Penn MLS
- 2024-07-18 Contingent — West Penn MLS
- 2024-07-11 Price Changed $10,000 West Penn MLS
- 2024-06-27 Listed $15,000 West Penn MLS
- 2004-12-15 Sold (Public Records) $12,500 Public Records
- 1982-04-22 Sold (Public Records) $18,500 Public Records
Property tax history
+1.0%/yrLatest (2026): $1,201 · +0.0% YoY. Source: county tax records.
Cash-flow waterfall
monthlySold comps — $/sqft
last 12 mo · ≤1 miLoading sold comps…