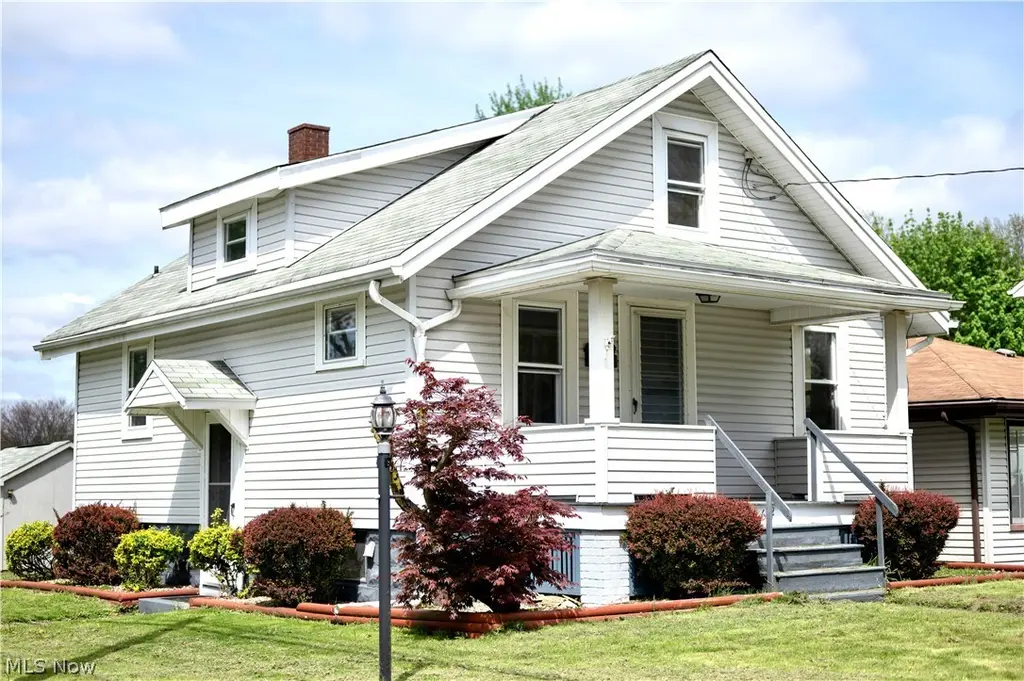
664 Tenney Ave · Campbell, OH
Flood risk 1/10 · Minimal
- FEMA flood zone
- X (unshaded)
- Chance of flooding over 30 yrs
- 0.0%
- Est. flood insurance / yr
- $473 – $860
Fire risk 1/10 · Minimal
- Est. fire insurance / yr
- $713 – $1,323
Heat risk 2/10 · Minimal
- Hot days now (above 96°F)
- 6 days/yr
- Hot days in 30 yrs
- 15 days/yr
Wind risk 1/10 · Minimal
- Chance of severe wind over 30 yrs
- —
Air-quality risk 3/10 · Minor
- Unhealthy air days now
- 1 days/yr
- Unhealthy air days in 30 yrs
- 4 days/yr
Risk factors via First Street. Map © Google.
Why this score? — see what drove the D grade
The composite is a weighted blend of 9 inputs, each scored 0–100. Each bar is that input's sub-score; the figure is the points it added to the 100-point composite (weight × sub-score).
- Cash flow +14.7/30.0
- Appreciation +10.0/10.0
- DSCR +4.5/10.0
- Livability +3.6/5.0
- 1% rule +3.4/10.0
- Schools +2.6/10.0
- Rent growth +2.5/5.0
- Condition / age +2.5/5.0
- ARV discount +0.0/15.0
$119,000
🖨 Deal sheet (PDF) 📄 Offer letter ✓ Due diligence
Listing remarks
Welcome to this cozy, clean, and move-in ready 4-bedroom, 1.5-bath home! Step inside to a warm and inviting living room that flows into a spacious kitchen; perfect for everyday living and entertaining. The main floor features two comfortable bedrooms and a full bathroom for convenient one-level living. Upstairs, you’ll find two additional bedrooms tucked into a charming loft space, offering flexibility for guests, a home office, or hobbies. The lower level provides even more functionality with a generously sized laundry room, a half bath, and extra living space. Outside, enjoy a nicely sized yard along with a large 2-car garage and an additional storage shed for all your needs. To top
Key facts
- Large garage
- Nicely sized yard
- Spacious kitchen
Tags
Property features AI
Exterior
- Parking: Detached 2-car garage
- Utilities: Public water; Public sewer
- Home design: Single-family property; Above-grade finished area approximately 1,008
- Construction: Asphalt/fiberglass roof; Built as recorded in public records; Home warranty included
- Exterior features: Vinyl siding; Lot approximately 0.148 acres
Interior
- Bedrooms: Two main-level bedrooms
- Bathrooms: One full bathroom; One half bathroom; One main-level bathroom
- Heating & cooling: Forced-air gas heating; Central air conditioning
- Interior features: Full basement; One fireplace
Neighborhood map
What this means for you Summary
Snapshot
- This is a 2-bed/1.0-bath single-family listed at $119k.
Deal economics
- At list price, monthly cash flow is $30 ($365/yr) — positive.
- The deal already cash-flows at list — no discount required.
- To meet the 1% rule (rent ≥ 1% of price), the offer needs to be $100k (15.6% below list).
- Recommended offer: $100k (15.6% below list) — sets the bar for 1% rule.
Location & tenants
- Location reads 71/100 on livability (#425 in OH) — a middle-class / working-renter tenant base. Strengths: commute A+, cost of living A+, housing A+; Watch: crime C-, schools D, amenities F.
- Campbell City (suburban): math 28% / reading 35% proficiency, ranked #580 of 656 in OH (top 88%) — families likely to look elsewhere, expect single-tenant / working-renter base with shorter leases; 80% free/reduced lunch — lower-income household profile, screen leases tightly.
- Market conditions: 21 active listings in the ZIP; 4 comparable units currently listed for rent nearby; rentals at typical pace (median 15d on market — plan ~3-4 weeks tenant-placement turnaround); lower-income renter base — watch delinquency; 147 units permitted in Mahoning County in 2024 (0 in 5+ unit buildings).
Forward outlook
- In year one you build about $13k of equity ($823 loan paydown + $12k appreciation (10.0% local appreciation)).
- Mahoning County population projected at -14% by 2050 — secular population decline; favor cash flow + early exit over multi-decade hold.
- At projected returns (10.0% appreciation + 3.0% rent growth), your $33k cash investment doubles in ~3 years — after that, you're playing with house money.
- By year 3, paydown + projected appreciation supports a ~$32k cash-out refi (75% LTV) — recoverable capital for the next deal without selling this one.
Negotiation context
- It's been on market 46 days — a 3% lower offer ($115k) is reasonable based on typical stale-listing flexibility.
- 3 sale attempts with the ask held roughly flat each time — persistent listings suggest the price (not the market) is what's stuck; bring a comps-based counter.
- Current owner paid $12k; list at $119k implies a 892% gain — meaningful room to come down on a strong offer.
Risks & watch-outs
- Watch-outs: built in 1937 — expect roof / HVAC / electrical / plumbing capex.
Questions for the listing agent
- It's been on market 46 days. Have you received any prior offers? Is the seller open to a 16% concession, seller financing, or rate buy-down credit?
- Built in 1937 — when were the roof, HVAC, electrical panel, plumbing, and water heater last replaced?
- Is there a deadline driving the sale (1031 exchange, divorce, estate, relocation)? That informs how much negotiation room exists.
- Schools are D-rated, which usually means shorter tenancies and higher turnover. Who's the typical renter profile here, and what's been the actual vacancy rate?
- The area grade is low — what's the realistic commute time and amenity access for the typical tenant pool here? Any planned neighborhood developments (good or bad) we should know about?
- What's the average days-on-market for RENTAL listings here right now (not sales)? A rising rental-DOM trend means longer vacancies and softer asking-rent achievability than the comps imply.
- What's the recent tenant-quality profile in this submarket — average credit score on applications, eviction rate, late-payment / NSF rate, and stable-employment percentage? A property-management company in the area should have these aggregated.
- How much new for-sale + rental construction is in the pipeline within 1–3 miles? Heavy new supply typically softens prices + rents 12–24 months out; constrained supply supports both.
Investment metrics
- 1% rule
- 0.84% ✗
- Cap rate
- 6.60%
- Cash-on-cash
- 1.10%
- DSCR
- 1.05
- GRM
- 9.9
CMA / ARV
- ARV (on-the-fly)
- $99,792
- Comps found
- 9
Show comp detail 9 sales within ~0.75 mi
| Address | Dist | Beds/Ba | Sqft | Sold | Price | $/sf | Match |
|---|---|---|---|---|---|---|---|
| 746 Whipple Ave | 0.29mi | 3/1.0 (+1) | 888 (-4%) | 4mo | $136,500 | $154 | 72 |
| 165 Piccadilly St | 0.22mi | 2/1.5 | 832 (-10%) | 1mo | $89,900 | $108 | 70 |
| 769 Whipple Ave | 0.34mi | 2/1.0 | 884 (-4%) | 23mo | $115,000 | $130 | 58 |
| 331 Sanderson Ave | 0.70mi | 2/1.0 | 948 (+3%) | 7mo | $40,000 | $42 | 57 |
| 805 Devitt | 0.30mi | 3/2.0 (+1) | 1,040 (+13%) | 6mo | $185,000 | $178 | 51 |
| 166 Piccadilly St | 0.19mi | 3/1.5 (+1) | 1,044 (+13%) | 21mo | $135,000 | $129 | 45 |
| 481 Penhale Ave | 0.36mi | 2/1.0 | 1,056 (+14%) | 20mo | $74,000 | $70 | 42 |
| 327 Sanderson Ave | 0.71mi | 3/1.5 (+1) | 852 (-8%) | 10mo | $89,000 | $104 | 38 |
| 513 Porter Ave | 0.45mi | 3/2.0 (+1) | 1,040 (+13%) | 16mo | $80,000 | $77 | 36 |
Match score weights: distance 35% · size 25% · config 20% · recency 20%. Top-matched comps best support the ARV.
Projected returns pro-forma
10.0% appreciation · 3.0% rent growth · sell at horizon
- IRR
- 25.1%
- Equity multiple
- 3.00×
- Total profit
- $66,726
- Equity at exit
- $107,205
- IRR
- 22.1%
- Equity multiple
- 6.85×
- Total profit
- $194,933
- Equity at exit
- $231,191
Cash invested: $33,320 (down + closing). Projections, not guarantees.
Landlord ↔ Tenant lean methodology
- Overall (STATE)
- 73 Landlord-Friendly
- State Ohio
- 73 Landlord-Friendly · R+6
- County
- — inherits STATE
- City
- — inherits STATE
ZIP-level market 44405
- Home prices YoY
- 26.4%
- Active inventory
- 21
- Price-to-rent
- 9.9×
Monthly cashflow live
- Estimated rent
- $1,005 medium interval (Pro) →
- Mortgage (P&I)
- −$624
- Tax from tax record
- −$90 /mo · $1,078/yr
- Insurance
- −$50
- HOA
- −$0
- Vacancy / Maint / Mgmt
- −$211
- Net cashflow
- $30
Break-even live
Sensitivity live
| Price | -10% $98 | -5% $64 | +0% $30 | +5% $-3 | +10% $-37 |
|---|---|---|---|---|---|
| Rent | -10% $-49 | -5% $-9 | +0% $30 | +5% $70 | +10% $110 |
| Rate | -1.0pp $90 | -0.5pp $61 | base $30 | +0.5pp $0 | +1.0pp $-32 |
UW: 25.0% down · 7.5% · 30yr · 1.5% tax · 5.0% vac · 8.0% maint · 8.0% mgmt
Financing live
Cash to close
- Down payment
- $29,750
- Closing costs
- $3,570
- Reserves months
- —
- Total cash needed
- —
Loan-product check · same deal, 3 products live
Conventional
25% down · 7.5% · 30yr
- Down + closing
- —
- Monthly P&I
- —
- Monthly cashflow
- —
- DSCR
- —
- Eligible?
- —
Personal DTI + credit; lowest rate.
DSCR
20% down · 8.5% · 30yr
- Down + closing
- —
- Monthly P&I
- —
- Monthly cashflow
- —
- DSCR
- —
- Eligible?
- —
No personal income docs; deal must DSCR.
Hard money
10% down · 12.0% · 12mo
- Down + closing
- —
- Monthly P&I
- —
- Monthly cashflow
- —
- DSCR
- —
- Eligible?
- —
Short-term bridge; refi at stabilization.
Rent comps 4 comps
| Address | Beds | Baths | Sqft | Rent | $/sqft | DOM | Units | Dist |
|---|---|---|---|---|---|---|---|---|
| 106 Gluck St Unit H Youngstown, OH | 2.0 | 1.0 | 858 | $900 | $1.05 | 14d | 1 | 1.20mi |
| 114 Gluck St Youngstown, OH | 1.0–3.0 | 1.0–1.5 | 1075 | $1,062 | $0.99 | 14d | 1 | 1.23mi |
| 130 Gluck St Youngstown, OH | 2.0 | 1.0 | 989 | $1,065 | $1.08 | 14d | 1 | 1.28mi |
| 79 Lilburne Dr Youngstown, OH | 3.0 | 1.0 | 988 | $1,000 | $1.01 | 14d | 1 | 1.41mi |
Listing history 28 events
-
2026-06-19days on market $119,000 Active 46 DOM
-
2026-06-18days on market $119,000 Active 45 DOM
-
2026-06-17days on market $119,000 Active 44 DOM
-
2026-06-16days on market $119,000 Active 43 DOM
-
2026-06-15days on market $119,000 Active 42 DOM
-
2026-06-14days on market $119,000 Active 40 DOM
-
2026-06-13days on market $119,000 Active 39 DOM
-
2026-06-10days on market $119,000 Active 37 DOM
-
2026-06-09days on market $119,000 Active 36 DOM
-
2026-06-08days on market $119,000 Active 35 DOM
-
2026-06-07days on market $119,000 Active 34 DOM
-
2026-06-05days on market $119,000 Active 31 DOM
-
2026-06-03days on market $119,000 Active 30 DOM
-
2026-06-02days on market $119,000 Active 29 DOM
-
2026-06-01days on market $119,000 Active 28 DOM
-
2026-05-31days on market $119,000 Active 27 DOM
-
2026-05-30days on market $119,000 Active 26 DOM
-
2026-05-15price $119,000
-
2026-05-04$124,900 Active
-
2026-04-30historical
-
2026-04-14status Active
-
2026-03-20status Pending
-
2025-11-07price $112,000
-
2025-11-06price $109,900
-
2025-10-12price $119,000
-
2025-10-11price $109,000
-
2025-08-26$125,000 Active
-
1989-09-20soldstatus $12,000
ⓘ Source: listings_history table (triggers on properties + properties_extension) + one-shot
backfill from property_details.listing_events for pre-trigger history.
Tax reassessment forecast OH · Partial reset (capped growth)
- Current annual tax
- $1,078 · $90/mo
- Projected year-2 tax
- $1,467 · $122/mo
- Expected delta
- +$389/yr (+$32/mo · 36.1%)
ⓘ Screening estimate from a state-policy table — verify with the county assessor before closing.
Climate risk First Street
- Flood 1/10 Low FEMA zone X (unshaded) · 0% chance over 30 yrs
- Wildfire 1/10 Low
- Heat 2/10 Low 6 d/yr ≥96°F today · 15 d/yr by 30 yrs out
- Wind 1/10 Low
- Air quality 3/10 Moderate 1 unhealthy d/yr today · 4 by 30 yrs out
Nearby sold comps map
Loading sold comps map…
Walkable amenities ~0.75 mi
Loading nearby amenities…
Taxation est. · year 1
- Rental income
- $12,059
- − Mortgage interest
- −$6,666
- − Property taxes
- −$1,078
- − Insurance
- −$595
- − Repairs & maintenance
- −$965
- − Management
- −$965
- − Depreciation
- −$3,462
- Taxable loss
- −$1,671
- Est. tax savings @ 24.0%
- +$401
- After-tax cash flow
- $766/yr
For passive investors: Depreciation is non-cash, so a rental often shows a tax loss while cash-flowing — sheltering income. Rental losses are passive: they offset passive income freely, and up to $25,000/yr can offset ordinary (W-2) income if you actively participate and your MAGI is under $100k (phasing out to $0 by $150k); unused losses carry forward. On sale, claimed depreciation is recaptured at up to 25%, and gains may owe capital-gains tax (a 1031 exchange can defer both). Figures are a year-1 estimate at your 24.0% rate — not tax advice; consult a CPA.
Schools (NCES district)
- District
- Campbell City
- NCES district ID
- 3904370
- Math proficiency
- 28% ▼ -11.00%
- Reading proficiency
- 35% ▼ -10.00%
- Median HH income
- $31,251
- Composite
- 25.64/100
- National rank
- #7403
- State rank
- #580 of 656 in OH
Livability — Campbell
- Score
- 71/100
- State rank
- #425
- US rank
- #6961
Category grades
Schools grade is shown separately in the Schools card above.
Census & demographics
- Census place
- Campbell, OH
- County
- Mahoning · 224,175 people
- City population
- 7,834
- Metro
- Youngstown-Warren, OH
- Population (ZIP)
- 7,834
- Household income
- $41,156
- Rent vs Own
- Severe rent burden
- 19.4
Population outlook (Mahoning County) Hauer SSP2
- Today (2025)
- 223,932 people
- By 2030
- 218,387 · -2.5%
- By 2040
- 205,367 · -8.3%
- By 2050
- 193,606 · -13.5%
- By 2075
- 173,694 · -22.4%
- By 2100
- 151,147 · -32.5%
Race, ethnicity, and origin ACS 2023
- Neighborhood character
- Diverse neighborhood (Simpson 0.65)
- Race & ethnicity
- White 50% Hispanic / Latino 25% Black 19% Two or more races 15%
- Hispanic origin (detail)
- Puerto Rican 22%
- Common ancestry
- Romanian 3% Slovak 1% Lithuanian 1%
- Foreign-born
- 4% · Canada
- Languages at home
- 75% English-only · Spanish 14% Other Indo-European 10% Arabic 1%
Political lean MEDSL · Mahoning
- 2024 margin
- Lean R (+9.4) · D 44.9% · R 54.4%
- 2008→2024 swing
- -36.1pp toward R · 2008: 26.6pp · 2024: -9.4pp
- All cycles
- 2024: R+9.4 2020: R+1.9 2016: D+3.0 2012: D+27.7 2008: D+26.6
Not yet ingested
- Civics
- —
Market trends
- HPI YoY
- ▲ 70.82%
- Current HPI
- 338.7174
- Rent YoY
- —
- Metro
- —
- State GDP YoY
- ▲ 1.98%
- F500 in state
- 48
Industry mix (Fortune 500 HQ in OH)
| Industry | F500 HQs | Revenue |
|---|---|---|
| Insurance | 3 | $145B |
|
||
| Industrial Machinery | 3 | $49B |
|
||
| Financial Services | 3 | $24B |
|
||
| Consumer Goods | 2 | $93B |
|
||
| Aerospace / Defense | 2 | $47B |
|
||
| Utilities | 2 | $33B |
|
||
Price history
+891.7% since first listed11 events — show timeline
- 2026-05-15 Price Changed $119,000 MLSNOW
- 2026-05-04 Listed $124,900 MLSNOW
- 2026-04-30 Listing Removed — MLSNOW
- 2026-04-14 Relisted — MLSNOW
- 2026-03-20 Pending — MLSNOW
- 2025-11-07 Price Changed $112,000 MLSNOW
- 2025-11-06 Price Changed $109,900 MLSNOW
- 2025-10-12 Price Changed $119,000 MLSNOW
- 2025-10-11 Price Changed $109,000 MLSNOW
- 2025-08-26 Listed $125,000 MLSNOW
- 1989-09-20 Sold (Public Records) $12,000 Public Records
Property tax history
+1.9%/yrLatest (2025): $1,078 · +99.1% YoY. Source: county tax records.
Cash-flow waterfall
monthlySold comps — $/sqft
last 12 mo · ≤1 miLoading sold comps…