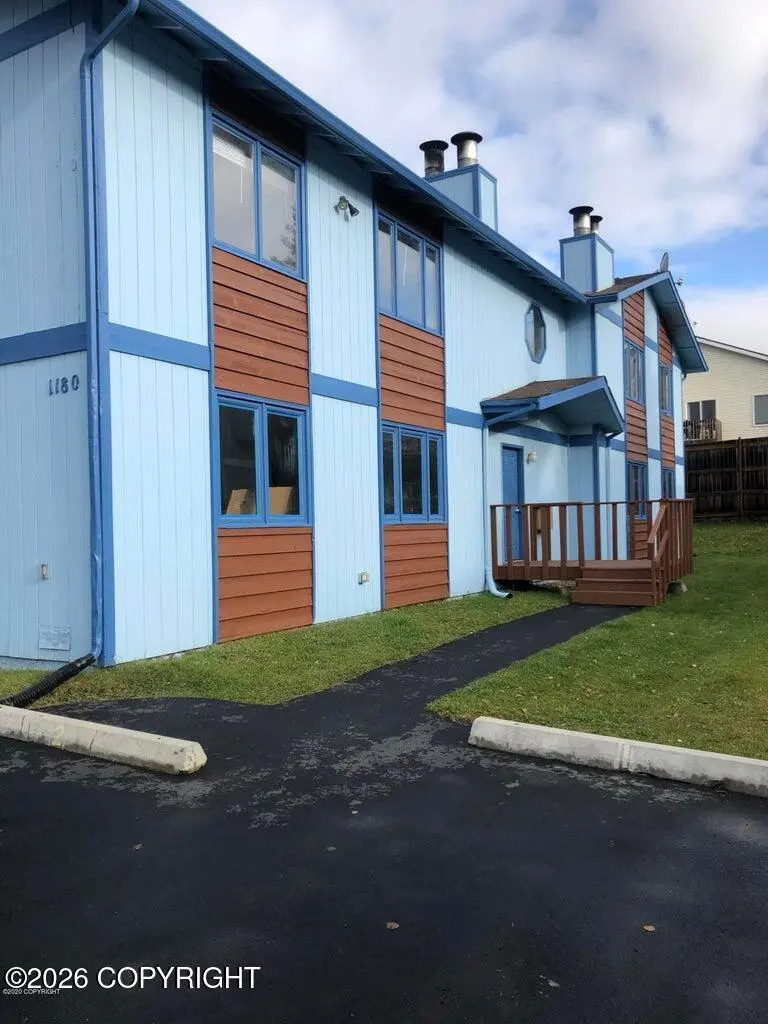
 Fourplex
1180 Golden Dawn Cir · Anchorage, AK
Flood risk 1/10 · Minimal
- FEMA flood zone
- X (unshaded)
- Chance of flooding over 30 yrs
- 0.0%
- Est. flood insurance / yr
- $507 – $1,088
Fire risk No data
- Est. fire insurance / yr
- —
Heat risk No data
- Hot days now (above threshold)
- —
- Hot days in 30 yrs
- —
Wind risk No data
- Chance of severe wind over 30 yrs
- —
Air-quality risk 1/10 · Minimal
- Unhealthy air days now
- —
- Unhealthy air days in 30 yrs
- —
Risk factors via First Street. Map © Google.
Why this score? — see what drove the C- grade
The composite is a weighted blend of 9 inputs, each scored 0–100. Each bar is that input's sub-score; the figure is the points it added to the 100-point composite (weight × sub-score).
- Cash flow +19.5/30.0
- ARV discount +6.6/15.0
- DSCR +6.2/10.0
- 1% rule +4.8/10.0
- Livability +3.9/5.0
- Schools +3.7/10.0
- Rent growth +3.4/5.0
- Condition / age +2.5/5.0
- Appreciation +0.0/10.0
$825,000
🖨 Deal sheet 📄 Offer letter ✓ Due diligence
Multi-family units
County records classify this as Multi-Family (5+ Unit). Listing-text estimate: 4 units. estimate disagrees with records
5+ unit building — per-unit beds/baths from public records are typically unavailable; the breakdown below (if shown) is an estimate from the listing text.
Listing remarks
EXCITING INVESTMENT OPPORTUNITY! Great location, proven 4-plex close to schools, restaurants, and shopping. Property features two 2-bedroom units and two 3-bedroom units, offering strong rental appeal and easy leasing. All units are currently occupied. Owner has completed numerous improvements and maintains the property well. DO NOT DISTURB TENANTS. Showings by appointment only. Current Home Inspection is available. All items have been fixed. Buyer to verify all square footage, measurements, and amenities.
Key facts
- 8,585 sq ft lot
- 8 parking spots
- Built 1984
Property features AI
Exterior
- Parking: 8 open parking spaces; No garage or carport spaces
- Utilities: Public sewer
- Home design: Multi-Family property; Built in 1984; Entry level information not provided; Facing direction not provided
- Construction: Wood frame construction; Block foundation; Composition/Shingle/Asphalt roof
- Exterior features: Paved road access
Interior
- Bedrooms: 10 bedrooms
- Bathrooms: 4 full bathrooms
- Interior features: Multi-family property layout
Neighborhood map
What this means for you Summary
Snapshot
- This is a 4 × 2-bed/1.0-bath units multifamily listed at $825k.
Deal economics
- At list price, monthly cash flow is $932 ($11k/yr) — positive. Per door: $233/mo.
- The deal already cash-flows at list — no discount required.
- To meet the 1% rule (rent ≥ 1% of price), the offer needs to be $808k (2.1% below list).
- Recommended offer: $808k (2.1% below list) — sets the bar for 1% rule.
- Cap rate 7.6% vs local median 3.8% in Anchorage — top-decile yield for the area; either an underpriced asset or a hidden risk that comps aren't pricing in. Stress-test before assuming the spread holds.
Location & tenants
- Location reads 78/100 on livability (#6 in AK, #2,553 nationally) — a middle-class / working-renter tenant base. Strengths: amenities A+, commute A+, employment A+; Watch: crime F, cost of living F.
- Anchorage School District (urban): math 37% / reading 43% proficiency, ranked #6 of 21 in AK (top 29%) — families likely to look elsewhere, expect single-tenant / working-renter base with shorter leases.
- Zoned schools: Taku Elementary (math 22% / reading 27%, grade F, #122 of 156 statewide, top 81%, 286 students, 72% FRL); Goldenview Middle School (math 46% / reading 58%, grade C+, #3 of 36 statewide, top 9%, 626 students, 16% FRL); Service High School (math 40% / reading 41%, grade F, #21 of 61 statewide, top 33%, 1,544 students, 28% FRL) — zoned schools at 38% FRL track the district average.
- Market conditions: Rents rising (+3.6%/yr); 110 active listings in the ZIP; high-income renter base; 306 units permitted in Anchorage Municipality in 2024 (90 in 5+ unit buildings).
- At $8,076/mo this rent would consume 85% of the median local household income ($114k/yr) (locally 411% of renters already pay >50% of income on rent) — very limited rent-growth headroom before tenants either downsize or default.
Forward outlook
- Local home prices are declining (-3.0%/yr); year-one equity from $6k of loan paydown is wiped out by about $25k of value loss. Plan a longer hold.
- Anchorage County population projected at +12% by 2050 — modest demand growth; plan on rents tracking national, not racing it.
Negotiation context
- Only 9 days on market — expect competitive offers; lowballing is unlikely to land.
- 4 sale attempts since 20y ago with the ask held roughly flat each time — persistent listings suggest the price (not the market) is what's stuck; bring a comps-based counter.
Questions for the listing agent
- Can we see the unit-by-unit rent roll, current vacancy, and any below-market leases? What's the average tenancy length?
- What capital expenditures (roof, boiler, parking lot, exteriors) have been made in the last 5 years, and what's planned in the next 2?
- Is there a deadline driving the sale (1031 exchange, divorce, estate, relocation)? That informs how much negotiation room exists.
- Schools are B-rated — typically a magnet for longer-tenancy family renters. What's the average tenant stay here, and is there a school-zone premium baked into asking?
- Crime grade is F in this area — have there been break-ins, vandalism, or insurance claims at this property in the last 3 years? What carrier currently insures it and at what premium?
- What's the average days-on-market for RENTAL listings here right now (not sales)? A rising rental-DOM trend means longer vacancies and softer asking-rent achievability than the comps imply.
- What's the recent tenant-quality profile in this submarket — average credit score on applications, eviction rate, late-payment / NSF rate, and stable-employment percentage? A property-management company in the area should have these aggregated.
- How much new apartment / multifamily construction is in the pipeline within 1–3 miles? Heavy new supply (>2% of stock underway) typically softens rents 12–24 months out; light construction supports rent growth.
Investment metrics
- 1% rule
- 0.98% ✗
- Cap rate
- 7.65%
- Cash-on-cash
- 4.84%
- DSCR
- 1.22
- GRM
- 8.5
CMA / ARV
- ARV (median comp)
- $808,637
- List price
- $825,000
- Delta
- 2.02%
- Verdict
- FAIR
- Comps
- 16 within 1.0 mi
Show comp detail 3 sales within ~0.75 mi
| Address | Dist | Beds/Ba | Sqft | Sold | Price | $/sf | Match |
|---|---|---|---|---|---|---|---|
| 1120 Golden Dawn Cir | 0.05mi | 8/4.5 | 4,003 (+2%) | 19mo | $759,000 | $190 | 76 |
| 8607 Corbin Dr | 0.70mi | 8/4.0 | 4,096 (+4%) | 7mo | $650,000 | $159 | 54 |
| 1910 Congress Cir | 0.47mi | 8/4.0 | 3,456 (-12%) | 15mo | $769,000 | $223 | 46 |
Match score weights: distance 35% · size 25% · config 20% · recency 20%. Top-matched comps best support the ARV.
Projected returns pro-forma
-3.0% appreciation · 3.65% rent growth · sell at horizon
- IRR
- -8.1%
- Equity multiple
- 0.70×
- Total profit
- $-69,029
- Equity at exit
- $123,010
- IRR
- 2.3%
- Equity multiple
- 1.17×
- Total profit
- $38,311
- Equity at exit
- $71,331
Cash invested: $231,000 (down + closing). Projections, not guarantees.
Landlord ↔ Tenant lean methodology
- Overall (STATE)
- 80 Strongly Landlord-Friendly
- State Alaska
- 80 Strongly Landlord-Friendly · R+8
- County
- — inherits STATE
- City
- — inherits STATE
ZIP-level market 99515
- Rents YoY
- 3.6%
- Active inventory
- 110
- Price-to-rent
- 34.1×
Monthly cashflow live
- Estimated rent
- $8,076 high interval (Pro) →
- Mortgage (P&I)
- −$4,326
- Tax from tax record
- −$778 /mo · $9,332/yr
- Insurance
- −$344
- HOA
- −$0
- Vacancy / Maint / Mgmt
- −$1,696
- Net cashflow
- $932
Break-even live
4-unit breakdown (identical units grouped — click to expand)
| Units | Beds | Baths | Est. rent |
|---|---|---|---|
| 4× units | 2 | 1 | $8,076 |
| #1 | 2 | 1 | $2,019 |
| #2 | 2 | 1 | $2,019 |
| #3 | 2 | 1 | $2,019 |
| #4 | 2 | 1 | $2,019 |
| Total (4 units) | $8,076 | ||
UW: 25.0% down · 7.5% · 30yr · 1.5% tax · 5.0% vac · 8.0% maint · 8.0% mgmt
Financing live
Cash to close
- Down payment
- $206,250
- Closing costs
- $24,750
- Reserves months
- —
- Total cash needed
- —
Loan-product check · same deal, 3 products live
Conventional
25% down · 7.5% · 30yr
- Down + closing
- —
- Monthly P&I
- —
- Monthly cashflow
- —
- DSCR
- —
- Eligible?
- —
Personal DTI + credit; lowest rate.
DSCR
20% down · 8.5% · 30yr
- Down + closing
- —
- Monthly P&I
- —
- Monthly cashflow
- —
- DSCR
- —
- Eligible?
- —
No personal income docs; deal must DSCR.
Hard money
10% down · 12.0% · 12mo
- Down + closing
- —
- Monthly P&I
- —
- Monthly cashflow
- —
- DSCR
- —
- Eligible?
- —
Short-term bridge; refi at stabilization.
Listing history 6 events
-
2026-05-18status Pending 511-char remark
-
2026-05-06$825,000 Active 511-char remark
-
2010-06-14$442,000
-
2006-11-09$460,000
-
2006-05-18$475,000
-
1989-01-06soldstatus
ⓘ Source: listings_history table (triggers on properties + properties_extension) + one-shot
backfill from property_details.listing_events for pre-trigger history.
Tax reassessment forecast AK · Partial reset (capped growth)
- Current annual tax
- $9,332 · $778/mo
- Projected year-2 tax
- $9,575 · $798/mo
- Expected delta
- +$243/yr (+$20/mo · 2.6%)
ⓘ Screening estimate from a state-policy table — verify with the county assessor before closing.
Climate risk First Street
- Flood 1/10 Low FEMA zone X (unshaded) · 0% chance over 30 yrs
- Air quality 1/10 Low
Nearby sold comps map
Loading sold comps map…
Walkable amenities ~0.75 mi
Loading nearby amenities…
Taxation est. · year 1
- Rental income
- $96,912
- − Mortgage interest
- −$46,213
- − Property taxes
- −$9,332
- − Insurance
- −$4,125
- − Repairs & maintenance
- −$7,753
- − Management
- −$7,753
- − Depreciation
- −$24,000
- Taxable loss
- −$2,264
- Est. tax savings @ 24.0%
- +$543
- After-tax cash flow
- $11,730/yr
For passive investors: Depreciation is non-cash, so a rental often shows a tax loss while cash-flowing — sheltering income. Rental losses are passive: they offset passive income freely, and up to $25,000/yr can offset ordinary (W-2) income if you actively participate and your MAGI is under $100k (phasing out to $0 by $150k); unused losses carry forward. On sale, claimed depreciation is recaptured at up to 25%, and gains may owe capital-gains tax (a 1031 exchange can defer both). Figures are a year-1 estimate at your 24.0% rate — not tax advice; consult a CPA.
Schools (NCES district)
- District
- Anchorage School District
- NCES district ID
- 0200180
- Math proficiency
- 37% ▼ -2.00%
- Reading proficiency
- 43% ▲ 1.00%
- Median HH income
- $76,447
- Composite
- 37.0/100
- National rank
- #4523
- State rank
- #6 of 21 in AK
Livability — Anchorage
- Score
- 78/100
- State rank
- #6
- US rank
- #2553
Category grades
Schools grade is shown separately in the Schools card above.
Census & demographics
- Census place
- Anchorage, AK
- County
- Anchorage Borough · 246,594 people
- City population
- 218,117
- Metro
- Anchorage, AK
- Population (ZIP)
- 21,870
- Household income
- $113,995
- Rent vs Own
- Severe rent burden
- 411.0
Population outlook (Anchorage County) Hauer SSP2
- Today (2025)
- 314,993 people
- By 2030
- 321,771 · +2.2%
- By 2040
- 335,493 · +6.5%
- By 2050
- 352,799 · +12.0%
- By 2075
- 414,771 · +31.7%
- By 2100
- 474,485 · +50.6%
Race, ethnicity, and origin ACS 2023
- Neighborhood character
- Diverse neighborhood (Simpson 0.63)
- Race & ethnicity
- White 59% Two or more races 15% Asian 12% Hispanic / Latino 9% Native American 4% Pacific Islander 4%
- Hispanic origin (detail)
- Mexican 5% Puerto Rican 1%
- Common ancestry
- Portuguese 4% Lithuanian 3% Italian 2%
- Foreign-born
- 14% · Canada, South Korea
- Languages at home
- 79% English-only · Spanish 7% Tagalog/Filipino 5% Other Asian/Pacific 5%
Political lean MEDSL · Anchorage
- 2024 margin
- D (+12.7) · D 56.3% · R 43.7%
- 2016→2024 swing
- +27.9pp toward D · 2016: -15.2pp · 2024: 12.7pp
- All cycles
- 2024: D+12.7 2016: R+15.2
Not yet ingested
- Civics
- —
Market trends
- HPI YoY
- ▼ -205.45%
- Current HPI
- 283.2778
- Rent YoY
- ▲ 3.65%
- Metro
- Anchorage, AK
- State GDP YoY
- —
- F500 in state
- 0
Price history
+73.7% since first listed7 events — show timeline
- 2026-06-10 Sold (MLS) — AKMLS
- 2026-05-18 Pending — AKMLS
- 2026-05-06 Listed $825,000 AKMLS
- 2010-06-14 Listed $442,000 AKMLS
- 2006-11-09 Listed $460,000 AKMLS
- 2006-05-18 Listed $475,000 AKMLS
- 1989-01-06 Sold (Public Records) — Public Records
Property tax history
+3.2%/yrLatest (2025): $9,332 · +5.9% YoY. Source: county tax records.
Cash-flow waterfall
monthlySold comps — $/sqft
last 12 mo · ≤1 miLoading sold comps…