 Multi-family
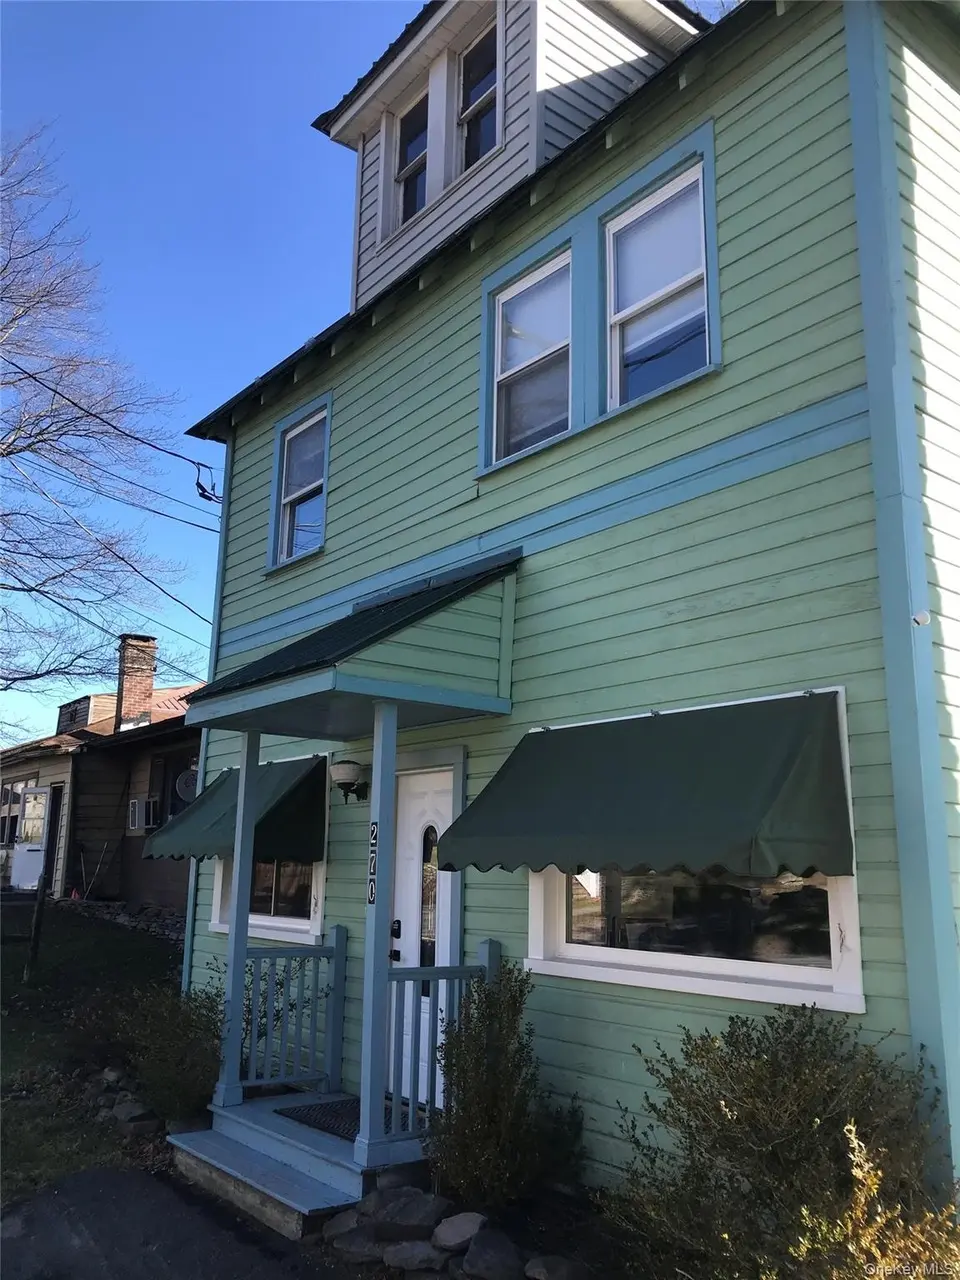
2 Hope St · Hurleyville, NY
Flood risk No data
- FEMA flood zone
- —
- Chance of flooding over 30 yrs
- —
- Est. flood insurance / yr
- —
Fire risk No data
- Est. fire insurance / yr
- —
Heat risk No data
- Hot days now (above threshold)
- —
- Hot days in 30 yrs
- —
Wind risk No data
- Chance of severe wind over 30 yrs
- —
Air-quality risk No data
- Unhealthy air days now
- —
- Unhealthy air days in 30 yrs
- —
Risk factors via First Street. Map © Google.
Why this score? — see what drove the D+ grade
The composite is a weighted blend of 9 inputs, each scored 0–100. Each bar is that input's sub-score; the figure is the points it added to the 100-point composite (weight × sub-score).
- Cash flow +11.7/30.0
- Appreciation +10.0/10.0
- ARV discount +7.5/15.0
- Condition / age +3.8/5.0
- 1% rule +3.4/10.0
- DSCR +3.4/10.0
- Rent growth +2.5/5.0
- Livability +2.5/5.0
- Schools +2.4/10.0
$360,000
🖨 Deal sheet (PDF) 📄 Offer letter ✓ Due diligence
Multi-family units
County records classify this as Multi-Family (2-4 Unit). Listing-text estimate: 1 unit. estimate disagrees with records
Listing remarks MLS
Prime mixed-use investment property in the heart of Hurleyville. This fully occupied building features a street-level commercial space and two residential units—a 3BR/1BA apartment and a 1BR/1BA apartment. An on-site coin-operated laundry provides additional income. This property may be purchased as part of a three-parcel, fully occupied investment portfolio offered strictly as-is/where-is, with inspections permitted for informational purposes only. The contiguous parcels include mixed-use, short-term rentals, long-term rentals, and commercial space, providing diversified income and strong cash flow. The sale includes the building and all on-site contents for a combined purchase price of $360,000. Allocation of purchase price between real property and contents/FF&E will be determined during contract negotiations. See MLS #978829 and #983187 for the additional parcels. Seller is open to offering improved terms if the parcels are purchased as a package. Located steps from Main Street amenities, dining, the Rail Trail, houses of worship, and Hurleyville’s growing arts and cultural district. Agent discloses interest in this property. Seller intends to prioritize offers that include all three parcels. Individual parcel offers remain eligible for consideration but may be secondary to full-portfolio proposals.
Key facts
- Strong cash flow
- 9,148 sq ft lot
- 5 parking spots
Tags
Neighborhood map
What this means for you Summary
Snapshot
- This is a multifamily listed at $360k. Condition is rated good.
Deal economics
- At list price, monthly cash flow is $-106 ($-1k/yr) — negative.
- To cash-flow at today's rent, offer at most $345k (4.3% below list).
- To meet the 1% rule (rent ≥ 1% of price), the offer needs to be $302k (16.2% below list).
- Recommended offer: $302k (16.2% below list) — sets the bar for 1% rule.
Location & tenants
- Location reads: area grade D — affects rentability + tenant quality, not the cash-flow math above.
- Fallsburg Central School District (town): math 29% / reading 27% proficiency, ranked #583 of 590 in NY (top 99%) — low school quality limits family demand, transient renter base, plan for 1-2y turnover.
- Zoned schools: Benjamin Cosor Elementary School (math 8% / reading 22%, grade F, #2,024 of 2,108 statewide, top 97%, 810 students, 72% FRL); Fallsburg Junior Senior High School (math 52% / reading 32%, grade F, #1,046 of 1,100 statewide, top 96%, 684 students, 64% FRL).
- Market conditions: 21 active listings in the ZIP; 739 units permitted in Sullivan County in 2024 (5 in 5+ unit buildings).
Forward outlook
- In year one you build about $38k of equity ($2k loan paydown + $36k appreciation (10.0% local appreciation)).
- Sullivan County population projected at -24% by 2050 — secular population decline; favor cash flow + early exit over multi-decade hold.
- By year 2, paydown + projected appreciation supports a ~$62k cash-out refi (75% LTV) — recoverable capital for the next deal without selling this one.
Negotiation context
- It's been on market 70 days — a 6% lower offer ($338k) is reasonable based on typical stale-listing flexibility.
Risks & watch-outs
- Watch-outs: built in 1902 — expect roof / HVAC / electrical / plumbing capex.
Questions for the listing agent
- What do current leases actually rent for vs. the listed asking? Can we see a recent rent roll and the last 12 months of T-12 income?
- It's been on market 70 days. Have you received any prior offers? Is the seller open to a 16% concession, seller financing, or rate buy-down credit?
- Built in 1902 — when were the roof, HVAC, electrical panel, plumbing, and water heater last replaced?
- Why hasn't it sold? Are there any deal-killer items the seller is aware of (foundation, flood, title, zoning, code violations)?
- Is there a deadline driving the sale (1031 exchange, divorce, estate, relocation)? That informs how much negotiation room exists.
- The area grade is low — what's the realistic commute time and amenity access for the typical tenant pool here? Any planned neighborhood developments (good or bad) we should know about?
- What's the average days-on-market for RENTAL listings here right now (not sales)? A rising rental-DOM trend means longer vacancies and softer asking-rent achievability than the comps imply.
- What's the recent tenant-quality profile in this submarket — average credit score on applications, eviction rate, late-payment / NSF rate, and stable-employment percentage? A property-management company in the area should have these aggregated.
- How much new apartment / multifamily construction is in the pipeline within 1–3 miles? Heavy new supply (>2% of stock underway) typically softens rents 12–24 months out; light construction supports rent growth.
Investment metrics
- 1% rule
- 0.84% ✗
- Cap rate
- 5.94%
- Cash-on-cash
- -1.26%
- DSCR
- 0.94
- GRM
- 10.0
CMA / ARV
- ARV (median comp)
- $884,646
- List price
- $360,000
- Delta
- -59.31%
- Verdict
- UNDERPRICED
- Comps
- 1 within 2.0 mi
Projected returns pro-forma
10.0% appreciation · 3.0% rent growth · sell at horizon
- IRR
- 23.4%
- Equity multiple
- 2.88×
- Total profit
- $189,358
- Equity at exit
- $324,317
- IRR
- 20.8%
- Equity multiple
- 6.59×
- Total profit
- $563,029
- Equity at exit
- $699,401
Cash invested: $100,800 (down + closing). Projections, not guarantees.
Landlord ↔ Tenant lean methodology
- Overall (STATE)
- 15 Strongly Tenant-Friendly
- State New York
- 15 Strongly Tenant-Friendly · D+10
- County
- — inherits STATE
- City
- — inherits STATE
ZIP-level market 12747
- Home prices YoY
- 3.2%
- Active inventory
- 21
- Price-to-rent
- 17.2×
Monthly cashflow live
- Estimated rent
- $3,015 medium interval (Pro) →
- Mortgage (P&I)
- −$1,888
- Tax est. 1.5%
- −$450 /mo · $5,400/yr
- Insurance
- −$150
- HOA
- −$0
- Vacancy / Maint / Mgmt
- −$633
- Net cashflow
- $-106
Break-even live
Sensitivity live
| Price | -10% $143 | -5% $18 | +0% $-106 | +5% $-230 | +10% $-355 |
|---|---|---|---|---|---|
| Rent | -10% $-344 | -5% $-225 | +0% $-106 | +5% $13 | +10% $132 |
| Rate | -1.0pp $75 | -0.5pp $-14 | base $-106 | +0.5pp $-199 | +1.0pp $-294 |
2-unit breakdown (identical units grouped — click to expand)
| Units | Beds | Baths | Est. rent |
|---|---|---|---|
| 1× unit | 3 | 1 | $1,744 |
| 1× unit | 1 | 1 | $1,270 |
| Total (2 units) | $3,015 | ||
UW: 25.0% down · 7.5% · 30yr · 1.5% tax · 5.0% vac · 8.0% maint · 8.0% mgmt
Financing live
Cash to close
- Down payment
- $90,000
- Closing costs
- $10,800
- Reserves months
- —
- Total cash needed
- —
Loan-product check · same deal, 3 products live
Conventional
25% down · 7.5% · 30yr
- Down + closing
- —
- Monthly P&I
- —
- Monthly cashflow
- —
- DSCR
- —
- Eligible?
- —
Personal DTI + credit; lowest rate.
DSCR
20% down · 8.5% · 30yr
- Down + closing
- —
- Monthly P&I
- —
- Monthly cashflow
- —
- DSCR
- —
- Eligible?
- —
No personal income docs; deal must DSCR.
Hard money
10% down · 12.0% · 12mo
- Down + closing
- —
- Monthly P&I
- —
- Monthly cashflow
- —
- DSCR
- —
- Eligible?
- —
Short-term bridge; refi at stabilization.
Listing history 17 events
-
2026-06-21days on market $360,000 Active 70 DOM
-
2026-06-18days on market $360,000 Active 67 DOM
-
2026-06-17days on market $360,000 Active 66 DOM
-
2026-06-16days on market $360,000 Active 65 DOM
-
2026-06-15days on market $360,000 Active 64 DOM
-
2026-06-14days on market $360,000 Active 62 DOM
-
2026-06-13days on market $360,000 Active 61 DOM
-
2026-06-10days on market $360,000 Active 59 DOM
-
2026-06-09days on market $360,000 Active 58 DOM
-
2026-06-08days on market $360,000 Active 57 DOM
-
2026-06-07days on market $360,000 Active 56 DOM
-
2026-06-03days on market $360,000 Active 52 DOM
-
2026-06-02days on market $360,000 Active 51 DOM
-
2026-06-01days on market $360,000 Active 50 DOM
-
2026-05-31days on market $360,000 Active 49 DOM
-
2026-05-31days on market $360,000 Active 48 DOM
-
2026-04-08$360,000 Active 1342-char remark
Show marketing remark (1342 chars)
Prime mixed-use investment property in the heart of Hurleyville. This fully occupied building features a street-level commercial space and two residential units—a 3BR/1BA apartment and a 1BR/1BA apartment. An on-site coin-operated laundry provides additional income. This property may be purchased as part of a three-parcel, fully occupied investment portfolio offered strictly as-is/where-is, with inspections permitted for informational purposes only. The contiguous parcels include mixed-use, short-term rentals, long-term rentals, and commercial space, providing diversified income and strong cash flow. The sale includes the building and all on-site contents for a combined purchase price of $360,000. Allocation of purchase price between real property and contents/FF&E will be determined during contract negotiations. See MLS #978829 and #983187 for the additional parcels. Seller is open to offering improved terms if the parcels are purchased as a package. Located steps from Main Street amenities, dining, the Rail Trail, houses of worship, and Hurleyville’s growing arts and cultural district. Agent discloses interest in this property. Seller intends to prioritize offers that include all three parcels. Individual parcel offers remain eligible for consideration but may be secondary to full-portfolio proposals.
ⓘ Source: listings_history table (triggers on properties + properties_extension) + one-shot
backfill from property_details.listing_events for pre-trigger history.
Nearby sold comps map
Loading sold comps map…
Walkable amenities ~0.75 mi
Loading nearby amenities…
Taxation est. · year 1
- Rental income
- $36,180
- − Mortgage interest
- −$20,166
- − Property taxes
- −$5,400
- − Insurance
- −$1,800
- − Repairs & maintenance
- −$2,894
- − Management
- −$2,894
- − Depreciation
- −$10,473
- Taxable loss
- −$7,447
- Est. tax savings @ 24.0%
- +$1,787
- After-tax cash flow
- $515/yr
For passive investors: Depreciation is non-cash, so a rental often shows a tax loss while cash-flowing — sheltering income. Rental losses are passive: they offset passive income freely, and up to $25,000/yr can offset ordinary (W-2) income if you actively participate and your MAGI is under $100k (phasing out to $0 by $150k); unused losses carry forward. On sale, claimed depreciation is recaptured at up to 25%, and gains may owe capital-gains tax (a 1031 exchange can defer both). Figures are a year-1 estimate at your 24.0% rate — not tax advice; consult a CPA.
Condition & rehab AI · 12 photos
This multi-family property is in good condition with a good condition score of 75. It has a cosmetic rehab level and requires minor maintenance items such as painting the exterior siding and cleaning gutters. The property has a good resale and rental value with updates like fresh paint and clean gutters that can further enhance its value.
Value-add opportunities
- Both Paint exterior siding — Fresh paint can enhance curb appeal and property value.
- Both Clean gutters — Clean gutters improve drainage and prevent water damage, enhancing property value and reducing maintenance costs.
Renovation cost estimate screening
Value-add ROI direction
- Both Paint exterior siding — Fresh paint can enhance curb appeal and property value. ↑
- Both Clean gutters — Clean gutters improve drainage and prevent water damage, enhancing property value and reducing maintenance costs. ↑
ⓘ Cost ranges are severity-bucket heuristics (US national rule-of-thumb). Get contractor quotes + a written scope before underwriting a rehab budget.
Schools (NCES district)
- District
- Fallsburg Central School District
- NCES district ID
- 3610950
- Math proficiency
- 29% ▼ -3.00%
- Reading proficiency
- 27% ▬ 0.00%
- Median HH income
- $42,513
- Composite
- 23.84/100
- National rank
- #7805
- State rank
- #583 of 590 in NY
Livability — Hurleyville
No livability data for this city. (Only ~50 U.S. cities are tracked.)
Census & demographics
- Census place
- Hurleyville, NY
- Population (ZIP)
- 2,036
Population outlook (Sullivan County) Hauer SSP2
- Today (2025)
- 68,974 people
- By 2030
- 65,609 · -4.9%
- By 2040
- 58,878 · -14.6%
- By 2050
- 52,500 · -23.9%
- By 2075
- 39,941 · -42.1%
- By 2100
- 28,880 · -58.1%
Race, ethnicity, and origin ACS 2023
- Neighborhood character
- Predominantly White (75%)
- Race & ethnicity
- White 75% Hispanic / Latino 12% Two or more races 11% Black 8% Asian 2%
- Hispanic origin (detail)
- Puerto Rican 5%
- Common ancestry
- Romanian 14% Lithuanian 10% Scotch-Irish 5%
- Foreign-born
- 7% · Canada
- Languages at home
- 88% English-only · Spanish 10% Chinese 1%
Political lean MEDSL · Sullivan
- 2024 margin
- R (+16.7) · D 41.6% · R 58.4%
- 2008→2024 swing
- -26.2pp toward R · 2008: 9.5pp · 2024: -16.7pp
- All cycles
- 2024: R+16.7 2020: R+9.2 2016: R+13.7 2012: D+10.4 2008: D+9.5
Not yet ingested
- Civics
- —
Market trends
- HPI YoY
- ▲ 15.46%
- Current HPI
- 504.332
- Rent YoY
- —
- Metro
- —
- State GDP YoY
- ▲ 2.60%
- F500 in state
- 92
Industry mix (Fortune 500 HQ in NY)
| Industry | F500 HQs | Revenue |
|---|---|---|
| Financial Services | 10 | $950B |
|
||
| Consumer Goods | 9 | $162B |
|
||
| Insurance | 4 | $225B |
|
||
| Telecommunications | 2 | $144B |
|
||
| Pharmaceuticals | 2 | $112B |
|
||
| Media / Entertainment | 2 | $69B |
|
||
Price history
1 event — show timeline
- 2026-04-08 Listed $360,000 OneKey® MLS as Distributed by MLS Grid
Cash-flow waterfall
monthlySold comps — $/sqft
last 12 mo · ≤1 miLoading sold comps…