 Multi-family
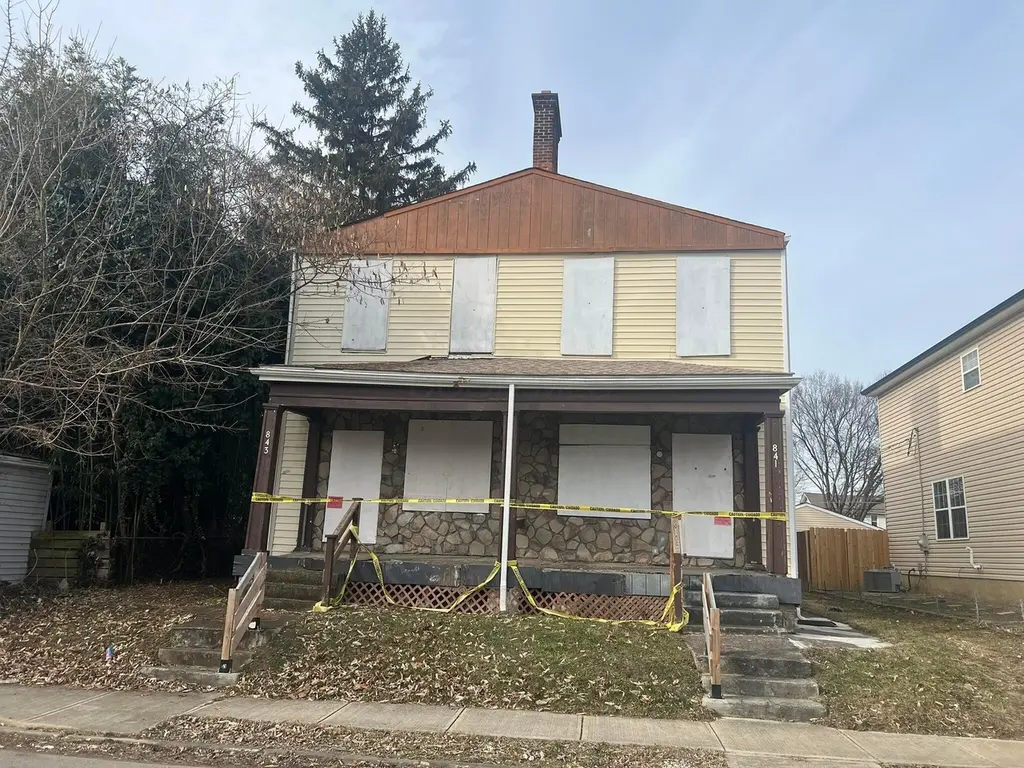
841 Ann St · Columbus, OH
Flood risk 1/10 · Minimal
- FEMA flood zone
- X (unshaded)
- Chance of flooding over 30 yrs
- 0.0%
- Est. flood insurance / yr
- $473 – $860
Fire risk 1/10 · Minimal
- Est. fire insurance / yr
- $713 – $1,323
Heat risk 4/10 · Minor
- Hot days now (above 100°F)
- 7 days/yr
- Hot days in 30 yrs
- 18 days/yr
Wind risk 2/10 · Minimal
- Chance of severe wind over 30 yrs
- 1.0%
Air-quality risk 3/10 · Minor
- Unhealthy air days now
- 2 days/yr
- Unhealthy air days in 30 yrs
- 3 days/yr
Risk factors via First Street. Map © Google.
Why this score? — see what drove the B- grade
The composite is a weighted blend of 9 inputs, each scored 0–100. Each bar is that input's sub-score; the figure is the points it added to the 100-point composite (weight × sub-score).
- Cash flow +30.0/30.0
- 1% rule +10.0/10.0
- DSCR +10.0/10.0
- ARV discount +7.5/15.0
- Livability +4.0/5.0
- Rent growth +3.4/5.0
- Schools +1.7/10.0
- Condition / age +1.0/5.0
- Appreciation +0.0/10.0
$120,000
🖨 Deal sheet 📄 Offer letter ✓ Due diligence
Multi-family units
County records classify this as Multi-Family (2-4 Unit). Listing-text estimate: 1 unit. estimate disagrees with records
Listing remarks
THE REALTOR IS THE RECEIVER APPOINTED BY THE FRANKLIN COUNTY MUNICIPAL COURT, ENVIRONMENTAL DIVISION. The buyer must provide the Receiver with a demolition or rehabilitation plan, project timeline, and proof of funds when submitting an offer. The property currently has an unsafe order that the buyer will be required to remediate. Any accepted contract is subject to court review and approval and will not be a quick close. Due to the condition of the property, an entry waiver is required. The Receiver requests in-state buyers only.
Key facts
- 6,098 sq ft lot
- Built 1914
- Listed 11 days
Neighborhood map
What this means for you Summary
Snapshot
- This is a multifamily listed at $120k. Condition is rated poor.
Deal economics
- At list price, monthly cash flow is $644 ($8k/yr) — positive.
- The deal already cash-flows at list — no discount required.
- Meets the 1% rule at list price ($2k rent vs $120k).
- Cap rate 12.7% vs local median 3.8% in Columbus — top-decile yield for the area; either an underpriced asset or a hidden risk that comps aren't pricing in. Stress-test before assuming the spread holds.
Location & tenants
- Location reads 81/100 on livability (#97 in OH, #1,491 nationally) — a professional / high-income tenant draw. Strengths: commute A+, cost of living A+, housing A+; Watch: employment C-, crime F.
- Columbus City School District (urban): math 15% / reading 26% proficiency, ranked #626 of 656 in OH (top 95%) — low school quality limits family demand, transient renter base, plan for 1-2y turnover; 72% free/reduced lunch — lower-income household profile, screen leases tightly.
- Market conditions: Rents rising (+3.5%/yr); 193 active listings in the ZIP; 21 comparable units currently listed for rent nearby; rentals at typical pace (median 24d on market — plan ~3-4 weeks tenant-placement turnaround); 48% of comp listings sitting > 30 days — soft ceiling on asking rent; solid renter incomes; 8,139 units permitted in Franklin County in 2024 (5,940 in 5+ unit buildings).
Forward outlook
- Local home prices are declining (-3.0%/yr); year-one equity from $830 of loan paydown is wiped out by about $4k of value loss. Plan a longer hold.
- Franklin County population projected at +34% by 2050 — long-run rental-demand tailwind backs the buy-and-hold thesis.
- At projected returns (-3.0% appreciation + 3.5% rent growth), your $34k cash investment doubles in ~6 years — after that, you're playing with house money.
Negotiation context
- Only 11 days on market — expect competitive offers; lowballing is unlikely to land.
- 2 sale attempts since 2y ago with the ask held roughly flat each time — persistent listings suggest the price (not the market) is what's stuck; bring a comps-based counter.
Risks & watch-outs
- Watch-outs: built in 1914 — expect roof / HVAC / electrical / plumbing capex.
Questions for the listing agent
- Have any recent inspections been done? Can we get a copy of the seller's disclosures and any deferred-maintenance estimates?
- Built in 1914 — when were the roof, HVAC, electrical panel, plumbing, and water heater last replaced?
- Is there a deadline driving the sale (1031 exchange, divorce, estate, relocation)? That informs how much negotiation room exists.
- Crime grade is F in this area — have there been break-ins, vandalism, or insurance claims at this property in the last 3 years? What carrier currently insures it and at what premium?
- What's the average days-on-market for RENTAL listings here right now (not sales)? A rising rental-DOM trend means longer vacancies and softer asking-rent achievability than the comps imply.
- What's the recent tenant-quality profile in this submarket — average credit score on applications, eviction rate, late-payment / NSF rate, and stable-employment percentage? A property-management company in the area should have these aggregated.
- How much new apartment / multifamily construction is in the pipeline within 1–3 miles? Heavy new supply (>2% of stock underway) typically softens rents 12–24 months out; light construction supports rent growth.
Investment metrics
- 1% rule
- 1.55% ✓
- Cap rate
- 12.73%
- Cash-on-cash
- 22.99%
- DSCR
- 2.02
- GRM
- 5.4
CMA / ARV
- ARV (on-the-fly)
- $438,840
- Comps found
- 12
Show comp detail 12 sales within ~0.75 mi
| Address | Dist | Beds/Ba | Sqft | Sold | Price | $/sf | Match |
|---|---|---|---|---|---|---|---|
| 767 Wager St | 0.11mi | 4/3.0 | 2,892 (+5%) | 13mo | $399,900 | $138 | 76 |
| 519-521 E Deshler Ave | 0.47mi | 6/— | 2,610 (-5%) | 2mo | $415,000 | $159 | 67 |
| 961-963 Heyl Ave | 0.23mi | 6/— | 3,125 (+13%) | 1mo | $598,000 | $191 | 66 |
| 265-267 Siebert St | 0.56mi | 2/— | 2,674 (-3%) | 5mo | $585,000 | $219 | 65 |
| 394-396 E Mithoff St | 0.63mi | 4/— | 2,761 (0%) | 10mo | $545,000 | $197 | 62 |
| 890-892 S Champion Ave | 0.56mi | —/— | 2,711 (-2%) | 14mo | $365,000 | $135 | 60 |
| 385-387 Jackson St | 0.50mi | 5/— | 2,502 (-9%) | 2mo | $655,000 | $262 | 59 |
| 887 E Livingston Ave | 0.39mi | 6/— | 2,496 (-10%) | 9mo | $400,000 | $160 | 59 |
| 1113-1115 S Ohio Ave | 0.53mi | 6/— | 2,576 (-7%) | 11mo | $387,000 | $150 | 55 |
| 1126-1128 S Ohio Ave | 0.57mi | 9/— | 2,648 (-4%) | 15mo | $309,400 | $117 | 54 |
| 1167-1169 Wilson Ave | 0.74mi | 6/— | 2,464 (-11%) | 7mo | $220,000 | $89 | 41 |
| 857-859 Wilson Ave | 0.69mi | 6/— | 3,055 (+11%) | 13mo | $465,000 | $152 | 39 |
Match score weights: distance 35% · size 25% · config 20% · recency 20%. Top-matched comps best support the ARV.
Projected returns pro-forma
-3.0% appreciation · 3.51% rent growth · sell at horizon
- IRR
- 16.5%
- Equity multiple
- 1.67×
- Total profit
- $22,537
- Equity at exit
- $17,892
- IRR
- 25.5%
- Equity multiple
- 3.28×
- Total profit
- $76,511
- Equity at exit
- $10,375
Cash invested: $33,600 (down + closing). Projections, not guarantees.
Landlord ↔ Tenant lean methodology
- Overall (STATE)
- 73 Landlord-Friendly
- State Ohio
- 73 Landlord-Friendly · R+6
- County
- — inherits STATE
- City
- — inherits STATE
ZIP-level market 43206
- Rents YoY
- 3.5%
- Active inventory
- 193
- Price-to-rent
- 5.4×
Monthly cashflow live
- Estimated rent
- $1,864 high interval (Pro) →
- Mortgage (P&I)
- −$629
- Tax est. 1.5%
- −$150 /mo · $1,800/yr
- Insurance
- −$50
- HOA
- −$0
- Vacancy / Maint / Mgmt
- −$392
- Net cashflow
- $644
Break-even live
UW: 25.0% down · 7.5% · 30yr · 1.5% tax · 5.0% vac · 8.0% maint · 8.0% mgmt
Financing live
Cash to close
- Down payment
- $30,000
- Closing costs
- $3,600
- Reserves months
- —
- Total cash needed
- —
Loan-product check · same deal, 3 products live
Conventional
25% down · 7.5% · 30yr
- Down + closing
- —
- Monthly P&I
- —
- Monthly cashflow
- —
- DSCR
- —
- Eligible?
- —
Personal DTI + credit; lowest rate.
DSCR
20% down · 8.5% · 30yr
- Down + closing
- —
- Monthly P&I
- —
- Monthly cashflow
- —
- DSCR
- —
- Eligible?
- —
No personal income docs; deal must DSCR.
Hard money
10% down · 12.0% · 12mo
- Down + closing
- —
- Monthly P&I
- —
- Monthly cashflow
- —
- DSCR
- —
- Eligible?
- —
Short-term bridge; refi at stabilization.
Rent comps 21 comps
| Address | Beds | Baths | Sqft | Rent | $/sqft | DOM | Units | Dist |
|---|---|---|---|---|---|---|---|---|
| 484-488 E Columbus St Columbus, OH | 2.0 | 1.5 | 2316 | $1,650 | $0.71 | 43d | 1 | 0.23mi |
| 890 E Livingston Ave #892 Columbus, OH | 3.0 | 1.0 | 2430 | $1,400 | $0.58 | 12d | 1 | 0.37mi |
| 698 S 22nd St Columbus, OH | 3.0 | 3.5 | 2400 | $2,500 | $1.04 | 43d | 1 | 0.47mi |
| 598 Lathrop St #6 Columbus, OH | 2.0 | 2.5 | 2156 | $4,500 | $2.09 | 7d | 1 | 0.48mi |
| 310 E Beck St Columbus, OH | 3.0 | 2.5 | 2265 | $3,995 | $1.76 | 43d | 1 | 0.58mi |
| 316 E Deshler Ave Columbus, OH | 3.0 | 1.5 | 3701 | $2,600 | $0.70 | 23d | 1 | 0.60mi |
| 683 S Champion Ave Unit 683 Columbus, OH | 3.0 | 1.0 | 2728 | $1,700 | $0.62 | 43d | 1 | 0.60mi |
| 172 Reinhard Ave Unit 172 Columbus, OH | 2.0 | 1.0 | 2656 | $1,900 | $0.72 | 43d | 1 | 0.69mi |
| 174 Reinhard Ave Columbus, OH | 2.0 | 1.0 | 2656 | $2,500 | $0.94 | 43d | 1 | 0.69mi |
| 627 Oakwood Ave Columbus, OH | 3.0 | 2.5 | 2009 | $2,379 | $1.18 | 12d | 1 | 0.71mi |
| 498 S Ohio Ave Unit A Columbus, OH | 2.0 | 1.0 | 2582 | $1,500 | $0.58 | 43d | 1 | 0.74mi |
| 860 S 3rd St Columbus, OH | 1.0 | 1.0 | 2496 | $1,375 | $0.55 | 23d | 1 | 0.77mi |
| 1175 Studer Ave Columbus, OH | 1.0 | 1.0 | 2484 | $800 | $0.32 | 23d | 1 | 0.86mi |
| 357 Frebis Ave #6 Columbus, OH | 3.0 | 3.5 | 2160 | $2,950 | $1.37 | 43d | 1 | 0.87mi |
| 965 E Rich St Unit 965 Columbus, OH | 3.0 | 1.0 | 2184 | $1,600 | $0.73 | 23d | 1 | 0.89mi |
| 895 S Wall St Columbus, OH | 3.0 | 3.5 | 2139 | $4,500 | $2.10 | 2d | 1 | 0.99mi |
| 47 S Monroe Ave Unit 49 Columbus, OH | 1.0 | 1.0 | 2476 | $1,695 | $0.68 | 43d | 1 | 1.14mi |
| 209 S High St Columbus, OH | 1.0–3.0 | 1.0–3.0 | 1396 | $2,348 | $1.68 | 1d | 22 | 1.30mi |
| 155 E Broad St Columbus, OH | 1.0–3.0 | 1.0–3.5 | 1380 | $4,926 | $3.57 | 7d | 41 | 1.39mi |
| 287 E Woodrow Ave Columbus, OH | 2.0 | 1.0 | 2028 | $1,300 | $0.64 | 43d | 1 | 1.43mi |
| 1402 Fair Ave Columbus, OH | 3.0 | 2.5 | 2563 | $2,350 | $0.92 | 15d | 1 | 1.48mi |
Listing history 6 events
-
2026-04-27status Pending
-
2026-04-16$120,000 Active
-
2024-12-02status Pending
-
2024-07-29status Pending
-
2024-07-29historical
-
2024-07-19$120,000 Active
ⓘ Source: listings_history table (triggers on properties + properties_extension) + one-shot
backfill from property_details.listing_events for pre-trigger history.
Climate risk First Street
- Flood 1/10 Low FEMA zone X (unshaded) · 0% chance over 30 yrs
- Wildfire 1/10 Low
- Heat 4/10 Moderate 7 d/yr ≥100°F today · 18 d/yr by 30 yrs out
- Wind 2/10 Low 100% chance of damaging wind over 30 yrs
- Air quality 3/10 Moderate 2 unhealthy d/yr today · 3 by 30 yrs out
Nearby sold comps map
Loading sold comps map…
Walkable amenities ~0.75 mi
Loading nearby amenities…
Taxation est. · year 1
- Rental income
- $22,373
- − Mortgage interest
- −$6,722
- − Property taxes
- −$1,800
- − Insurance
- −$600
- − Repairs & maintenance
- −$1,790
- − Management
- −$1,790
- − Depreciation
- −$3,491
- Taxable income
- $6,181
- Est. tax owed @ 24.0%
- −$1,483
- After-tax cash flow
- $6,240/yr
For passive investors: Depreciation is non-cash, so a rental often shows a tax loss while cash-flowing — sheltering income. Rental losses are passive: they offset passive income freely, and up to $25,000/yr can offset ordinary (W-2) income if you actively participate and your MAGI is under $100k (phasing out to $0 by $150k); unused losses carry forward. On sale, claimed depreciation is recaptured at up to 25%, and gains may owe capital-gains tax (a 1031 exchange can defer both). Figures are a year-1 estimate at your 24.0% rate — not tax advice; consult a CPA.
Condition & rehab AI · 6 photos
This property requires extensive repairs and maintenance, including structural repairs, exterior improvements, and landscaping. Significant investment is needed to bring it up to a livable condition.
Repairs flagged
- Major Exterior siding — Severe damage and peeling
- Major Roof — Signs of significant damage
- Major Foundation — Appears structurally compromised
- Major Landscaping — Overgrown and unkempt
- Major Windows — Boarded up, likely broken
Value-add opportunities
- Both Landscaping and exterior repairs — Improves curb appeal and property value
- Both Roof repair — Essential for structural integrity and safety
- Both Exterior siding repair — Enhances property appearance and value
- Both Foundation repair — Ensures structural stability and safety
- Both Window repair/replacement — Restores functionality and enhances property value
Renovation cost estimate screening
| Repair item | Severity | Est. cost |
|---|---|---|
| Exterior siding · Severe damage and peeling | Major | $15,000–50,000 |
| Roof · Signs of significant damage | Major | $15,000–50,000 |
| Foundation · Appears structurally compromised | Major | $15,000–50,000 |
| Landscaping · Overgrown and unkempt | Major | $15,000–50,000 |
| Windows · Boarded up, likely broken | Major | $15,000–50,000 |
| Total estimated repair cost · 5 items | $75,000–250,000 |
Value-add ROI direction
- Both Landscaping and exterior repairs — Improves curb appeal and property value ↑
- Both Roof repair — Essential for structural integrity and safety ↑
- Both Exterior siding repair — Enhances property appearance and value ↑
- Both Foundation repair — Ensures structural stability and safety ↑
- Both Window repair/replacement — Restores functionality and enhances property value ↑
ⓘ Cost ranges are severity-bucket heuristics (US national rule-of-thumb). Get contractor quotes + a written scope before underwriting a rehab budget.
Schools (NCES district)
- District
- Columbus City School District
- NCES district ID
- 3904380
- Math proficiency
- 15% ▼ -17.00%
- Reading proficiency
- 26% ▼ -12.00%
- Median HH income
- $38,483
- Composite
- 17.19/100
- National rank
- #9105
- State rank
- #626 of 656 in OH
Livability — Columbus
- Score
- 81/100
- State rank
- #97
- US rank
- #1491
Category grades
Schools grade is shown separately in the Schools card above.
Census & demographics
- Census place
- Columbus, OH
- County
- Franklin County · 1,351,780 people
- City population
- 612,189
- Metro
- Columbus, OH
- Population (ZIP)
- 21,996
- Household income
- $75,806
- Rent vs Own
- Severe rent burden
- 846.0
Population outlook (Franklin County) Hauer SSP2
- Today (2025)
- 1,456,139 people
- By 2030
- 1,556,890 · +6.9%
- By 2040
- 1,757,349 · +20.7%
- By 2050
- 1,950,539 · +34.0%
- By 2075
- 2,376,171 · +63.2%
- By 2100
- 2,636,796 · +81.1%
Race, ethnicity, and origin ACS 2023
- Neighborhood character
- Diverse neighborhood (Simpson 0.59)
- Race & ethnicity
- White 56% Black 31% Two or more races 9% Hispanic / Latino 4% Asian 1% Native American 1%
- Common ancestry
- Romanian 3% Slovak 2% Lithuanian 1%
- Foreign-born
- 4% · Canada
- Languages at home
- 96% English-only · Spanish 2% Other Indo-European 1%
Political lean MEDSL · Franklin
- 2024 margin
- Strong D (+28.4) · D 63.7% · R 35.3% · Other 1.0%
- 2008→2024 swing
- +7.7pp toward D · 2008: 20.7pp · 2024: 28.4pp
- All cycles
- 2024: D+28.4 2020: D+31.4 2016: D+25.9 2012: D+21.7 2008: D+20.7
Not yet ingested
- Civics
- —
Market trends
- HPI YoY
- ▼ -576.73%
- Current HPI
- 173.8569
- Rent YoY
- ▲ 3.51%
- Metro
- Columbus, OH
- State GDP YoY
- ▲ 1.98%
- F500 in state
- 48
Industry mix (Fortune 500 HQ in OH)
| Industry | F500 HQs | Revenue |
|---|---|---|
| Insurance | 3 | $145B |
|
||
| Industrial Machinery | 3 | $49B |
|
||
| Financial Services | 3 | $24B |
|
||
| Consumer Goods | 2 | $93B |
|
||
| Aerospace / Defense | 2 | $47B |
|
||
| Utilities | 2 | $33B |
|
||
Price history
+0.0% since first listed6 events — show timeline
- 2026-04-27 Pending — CBRMLS
- 2026-04-16 Listed $120,000 CBRMLS
- 2024-12-02 Pending — CBRMLS
- 2024-07-29 Pending — CBRMLS
- 2024-07-29 Listing Removed — CBRMLS
- 2024-07-19 Listed $120,000 CBRMLS
Cash-flow waterfall
monthlySold comps — $/sqft
last 12 mo · ≤1 miLoading sold comps…