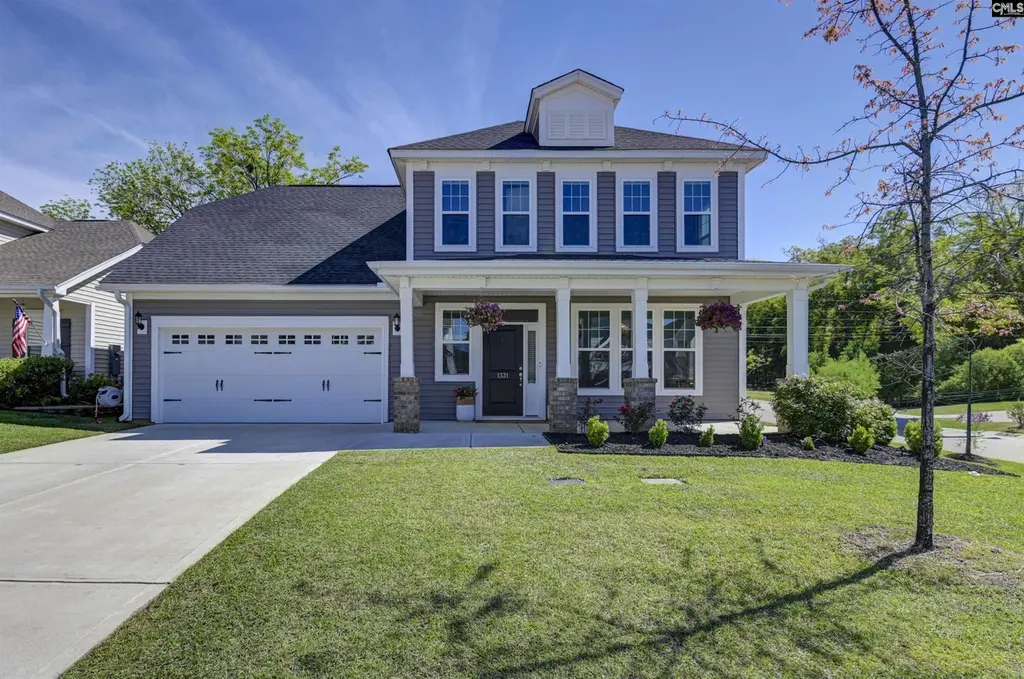
1331 Tamarind Ln · Lake Murray of Richland, SC
Flood risk 1/10 · Minimal
- FEMA flood zone
- X (unshaded)
- Chance of flooding over 30 yrs
- 0.0%
- Est. flood insurance / yr
- $507 – $1,088
Fire risk 3/10 · Minor
- Est. fire insurance / yr
- $783 – $1,453
Heat risk 6/10 · Moderate
- Hot days now (above 108°F)
- 7 days/yr
- Hot days in 30 yrs
- 16 days/yr
Wind risk 6/10 · Moderate
- Chance of severe wind over 30 yrs
- 60.0%
Air-quality risk 3/10 · Minor
- Unhealthy air days now
- 2 days/yr
- Unhealthy air days in 30 yrs
- 3 days/yr
Risk factors via First Street. Map © Google.
Why this score? — see what drove the D- grade
The composite is a weighted blend of 9 inputs, each scored 0–100. Each bar is that input's sub-score; the figure is the points it added to the 100-point composite (weight × sub-score).
- Cash flow +12.4/30.0
- ARV discount +7.5/15.0
- Schools +4.5/10.0
- DSCR +3.7/10.0
- Livability +3.4/5.0
- 1% rule +2.6/10.0
- Rent growth +2.5/5.0
- Condition / age +2.5/5.0
- Appreciation +0.0/10.0
$375,000
🖨 Deal sheet 📄 Offer letter ✓ Due diligence
Listing remarks
Welcome to 1331 Tamarind Lane in Chapin, South Carolina. Built in 2020, this four-bedroom home offers thoughtfully selected upgrades that elevate it well beyond builder-grade. The open-concept design features a spacious kitchen that flows seamlessly into a bright, inviting living area. The main-level primary suite includes a custom walk-in closet, while an additional custom walk-in closet upstairs adds both convenience and style. Positioned on a corner lot with only one adjacent neighbor, the property provides added privacy along with peaceful, wooded views from the backyard—creating a quiet, natural setting. Chapin, known as the “Capital of Lake Murray, ” is part of the h
Key facts
- Gathering space
- Neighborhood pool
- Corner lot
Tags
Property features AI
Finance
- HOA & community: Community association with clubhouse, pool, playground, sidewalks, street light and common area maintenance, and green areas included
Exterior
- Parking: Attached garage with 2 car spaces on the main level
- Utilities: Public water; Public sewer
- Home design: Two-story single-family home; Vinyl exterior finish
- Construction: Slab foundation
- Exterior features: Covered front porch; Covered back porch; Privacy fence; Paved road access
Interior
- Kitchen: Eat-in kitchen with island and pantry; Painted cabinetry; Double oven range (free-standing, smooth surface, self-cleaning); Microwave above stove; Dishwasher; Disposal
- Bedrooms: Primary suite on main level with double vanity, garden tub, separate shower, walk-in closet, box ceilings and ceiling fan; Three additional bedrooms on second level — each with double vanity, shared bath access, tub/shower (or tub shower), ceiling fan, and luxury vinyl plank flooring; two have private closets
- Flooring: Luxury vinyl plank throughout main living areas and bedrooms
- Bathrooms: Two full bathrooms and one half bath; Second full bath shares access among upstairs bedrooms
- Heating & cooling: Central cooling with zoned system; Gas heating on first level with zoned controls
- Interior features: Fireplace in great room with molding and box ceilings; Recessed lighting; Tankless hot water
- Laundry & utility: Main-level utility/laundry room
Neighborhood map
What this means for you Summary
Snapshot
- This is a 4-bed/2.5-bath single-family listed at $375k.
Deal economics
- At list price, monthly cash flow is $-61 ($-733/yr) — negative.
- To cash-flow at today's rent, offer at most $364k (2.9% below list).
- To meet the 1% rule (rent ≥ 1% of price), the offer needs to be $284k (24.2% below list).
- Recommended offer: $284k (24.2% below list) — sets the bar for 1% rule.
Location & tenants
- Location reads 67/100 on livability (#102 in SC) — a middle-class / working-renter tenant base. Strengths: crime A+, employment A+, housing A+; Watch: amenities F, commute F, cost of living F.
- Lexington 05 (suburban): math 47% / reading 55% proficiency, ranked #5 of 80 in SC (top 6%) — acceptable for families but not a draw, mixed tenant base, ~2y average lease.
- Zoned schools: Chapin Elementary (math 53% / reading 51%, grade C-, #145 of 597 statewide, top 26%, 790 students, 34% FRL); Chapin High (math 82% / reading 91%, grade A, #7 of 196 statewide, top 4%, 1,615 students, 100% FRL) — zoned schools average 67% FRL vs 27% district-wide (40 pts higher); higher-poverty schools than district average — tighter screening recommended.
- Zoned-school proficiency averages 69% at this address vs 51% district-wide (+18 pts) — the actual schools serving this property are materially stronger than the Lexington 05 average implies; a family-tenant draw the district grade alone would hide.
- Market conditions: 434 active listings in the ZIP; 3 comparable units currently listed for rent nearby; rentals leasing fast (median 12d on market — plan ~1-2 weeks tenant-placement turnaround); high-income renter base; 1,712 units permitted in Lexington County in 2024 (0 in 5+ unit buildings).
Forward outlook
- Local home prices are declining (-3.0%/yr); year-one equity from $3k of loan paydown is wiped out by about $11k of value loss. Plan a longer hold.
- Lexington County population projected at +26% by 2050 — long-run rental-demand tailwind backs the buy-and-hold thesis.
Negotiation context
- It's been on market 36 days — a 3% lower offer ($364k) is reasonable based on typical stale-listing flexibility.
- Current owner paid $119k; list at $375k implies a 215% gain — meaningful room to come down on a strong offer.
Risks & watch-outs
- Climate carrying-cost: major wind risk, 60% chance of damaging wind over 30y; extreme-heat days projected 7→16/yr by 2055 (HVAC capex compounding) — expect insurance premiums to compound above CPI over the hold.
Questions for the listing agent
- What do current leases actually rent for vs. the listed asking? Can we see a recent rent roll and the last 12 months of T-12 income?
- It's been on market 36 days. Have you received any prior offers? Is the seller open to a 24% concession, seller financing, or rate buy-down credit?
- What does the HOA fee cover, when was the last increase, and are there any pending special assessments or reserve-fund shortfalls?
- Is there a deadline driving the sale (1031 exchange, divorce, estate, relocation)? That informs how much negotiation room exists.
- Schools are D-rated, which usually means shorter tenancies and higher turnover. Who's the typical renter profile here, and what's been the actual vacancy rate?
- The area grade is low — what's the realistic commute time and amenity access for the typical tenant pool here? Any planned neighborhood developments (good or bad) we should know about?
- What's the average days-on-market for RENTAL listings here right now (not sales)? A rising rental-DOM trend means longer vacancies and softer asking-rent achievability than the comps imply.
- What's the recent tenant-quality profile in this submarket — average credit score on applications, eviction rate, late-payment / NSF rate, and stable-employment percentage? A property-management company in the area should have these aggregated.
- How much new for-sale + rental construction is in the pipeline within 1–3 miles? Heavy new supply typically softens prices + rents 12–24 months out; constrained supply supports both.
Investment metrics
- 1% rule
- 0.76% ✗
- Cap rate
- 6.10%
- Cash-on-cash
- -0.70%
- DSCR
- 0.97
- GRM
- 11.0
CMA / ARV
No comps found within radius.
Projected returns pro-forma
-3.0% appreciation · 3.0% rent growth · sell at horizon
- IRR
- -17.5%
- Equity multiple
- 0.38×
- Total profit
- $-64,786
- Equity at exit
- $55,914
- IRR
- -9.6%
- Equity multiple
- 0.41×
- Total profit
- $-61,955
- Equity at exit
- $32,423
Cash invested: $105,000 (down + closing). Projections, not guarantees.
Landlord ↔ Tenant lean methodology
- Overall (STATE)
- 90 Strongly Landlord-Friendly
- State South Carolina
- 90 Strongly Landlord-Friendly · R+6
- County
- — inherits STATE
- City
- — inherits STATE
ZIP-level market 29036
- Active inventory
- 434
- Price-to-rent
- 11.0×
Monthly cashflow live
- Estimated rent
- $2,844 medium interval (Pro) →
- Mortgage (P&I)
- −$1,967
- Tax from tax record
- −$147 /mo · $1,767/yr
- Insurance
- −$156
- HOA
- −$38
- Vacancy / Maint / Mgmt
- −$597
- Net cashflow
- $-61
Break-even live
UW: 25.0% down · 7.5% · 30yr · 1.5% tax · 5.0% vac · 8.0% maint · 8.0% mgmt
Financing live
Cash to close
- Down payment
- $93,750
- Closing costs
- $11,250
- Reserves months
- —
- Total cash needed
- —
Loan-product check · same deal, 3 products live
Conventional
25% down · 7.5% · 30yr
- Down + closing
- —
- Monthly P&I
- —
- Monthly cashflow
- —
- DSCR
- —
- Eligible?
- —
Personal DTI + credit; lowest rate.
DSCR
20% down · 8.5% · 30yr
- Down + closing
- —
- Monthly P&I
- —
- Monthly cashflow
- —
- DSCR
- —
- Eligible?
- —
No personal income docs; deal must DSCR.
Hard money
10% down · 12.0% · 12mo
- Down + closing
- —
- Monthly P&I
- —
- Monthly cashflow
- —
- DSCR
- —
- Eligible?
- —
Short-term bridge; refi at stabilization.
Rent comps 3 comps
| Address | Beds | Baths | Sqft | Rent | $/sqft | DOM | Units | Dist |
|---|---|---|---|---|---|---|---|---|
| 1433 Tamarind Ln Chapin, SC | 5.0 | 3.0 | 2317 | $2,595 | $1.12 | 21d | 1 | 0.15mi |
| 2019 Ludlow Pl Chapin, SC | 5.0 | 3.5 | 3316 | $2,990 | $0.90 | 11d | 1 | 1.15mi |
| 425 Pine Log Run Chapin, SC | 5.0 | 3.0 | 2588 | $2,600 | $1.00 | 11d | 1 | 1.31mi |
HOA detail
- Monthly dues
- $38 · $456/yr
Listing history 8 events
-
2026-06-07statusdays on market $375,000 Pending 36 DOM
-
2026-06-03days on market $375,000 Active - Contingent 34 DOM
-
2026-06-03days on market $375,000 Active - Contingent 33 DOM
-
2026-06-01days on market $375,000 Active - Contingent 32 DOM
-
2026-05-31days on market $375,000 Active - Contingent 31 DOM
-
2026-05-21historical Active - Contingent
-
2026-04-30$375,000 Active
-
2020-03-12soldstatus $119,158
ⓘ Source: listings_history table (triggers on properties + properties_extension) + one-shot
backfill from property_details.listing_events for pre-trigger history.
Tax reassessment forecast SC · Resets to sale price
- Current annual tax
- $1,767 · $147/mo
- Projected year-2 tax
- $2,138 · $178/mo
- Expected delta
- +$370/yr (+$31/mo · 21.0%)
ⓘ Screening estimate from a state-policy table — verify with the county assessor before closing.
Climate risk First Street
- Flood 1/10 Low FEMA zone X (unshaded) · 0% chance over 30 yrs
- Wildfire 3/10 Moderate
- Heat 6/10 Major 7 d/yr ≥108°F today · 16 d/yr by 30 yrs out
- Wind 6/10 Major 60% chance of damaging wind over 30 yrs
- Air quality 3/10 Moderate 2 unhealthy d/yr today · 3 by 30 yrs out
Nearby sold comps map
Loading sold comps map…
Walkable amenities ~0.75 mi
Loading nearby amenities…
Taxation est. · year 1
- Rental income
- $34,132
- − Mortgage interest
- −$21,006
- − Property taxes
- −$1,767
- − Insurance
- −$1,875
- − Repairs & maintenance
- −$2,731
- − Management
- −$2,731
- − HOA
- −$456
- − Depreciation
- −$10,909
- Taxable loss
- −$7,342
- Est. tax savings @ 24.0%
- +$1,762
- After-tax cash flow
- $1,030/yr
For passive investors: Depreciation is non-cash, so a rental often shows a tax loss while cash-flowing — sheltering income. Rental losses are passive: they offset passive income freely, and up to $25,000/yr can offset ordinary (W-2) income if you actively participate and your MAGI is under $100k (phasing out to $0 by $150k); unused losses carry forward. On sale, claimed depreciation is recaptured at up to 25%, and gains may owe capital-gains tax (a 1031 exchange can defer both). Figures are a year-1 estimate at your 24.0% rate — not tax advice; consult a CPA.
Schools (NCES district)
- District
- Lexington 05
- NCES district ID
- 4502820
- Math proficiency
- 47% ▼ -7.00%
- Reading proficiency
- 55% ▼ -4.00%
- Median HH income
- $67,732
- Composite
- 45.28/100
- National rank
- #2656
- State rank
- #5 of 80 in SC
Livability — Lake Murray of Richland
- Score
- 67/100
- State rank
- #102
- US rank
- #10903
Category grades
Schools grade is shown separately in the Schools card above.
Census & demographics
- County
- Lexington County · 232,571 people
- City population
- 179
- Metro
- Columbia, SC
- Population (ZIP)
- 26,620
- Household income
- $113,986
- Rent vs Own
- Severe rent burden
- 212.0
Population outlook (Lexington County) Hauer SSP2
- Today (2025)
- 322,999 people
- By 2030
- 342,356 · +6.0%
- By 2040
- 377,715 · +16.9%
- By 2050
- 406,984 · +26.0%
- By 2075
- 465,447 · +44.1%
- By 2100
- 485,674 · +50.4%
Race, ethnicity, and origin ACS 2023
- Neighborhood character
- Predominantly White (86%)
- Race & ethnicity
- White 86% Asian 5% Two or more races 4% Black 3% Hispanic / Latino 3%
- Common ancestry
- Lithuanian 4% Slovak 4% Italian 2%
- Foreign-born
- 6% · Canada, South Korea, China
- Languages at home
- 95% English-only · Other Indo-European 2% Spanish 1% Korean 1%
Political lean MEDSL · Lexington
- 2024 margin
- Solid R (+33.5) · D 32.5% · R 66.0% · Other 1.4%
- 2008→2024 swing
- +4.6pp toward D · 2008: -38.0pp · 2024: -33.5pp
- All cycles
- 2024: R+33.5 2020: R+30.1 2016: R+36.7 2012: R+37.8 2008: R+38.0
Not yet ingested
- Civics
- —
Market trends
- HPI YoY
- ▼ -134.76%
- Current HPI
- 248.3807
- Rent YoY
- —
- Metro
- Columbia, SC
- State GDP YoY
- ▲ 4.51%
- F500 in state
- 2
Industry mix (Fortune 500 HQ in SC)
| Industry | F500 HQs | Revenue |
|---|---|---|
| Packaging | 1 | $7B |
|
||
Price history
+214.7% since first listed3 events — show timeline
- 2026-05-21 Contingent — Consolidated MLS
- 2026-04-30 Listed $375,000 Consolidated MLS
- 2020-03-12 Sold (Public Records) $119,158 Public Records
Property tax history
-0.4%/yrLatest (2024): $1,767 · +0.9% YoY. Source: county tax records.
Cash-flow waterfall
monthlySold comps — $/sqft
last 12 mo · ≤1 miLoading sold comps…