 🔨 Auction
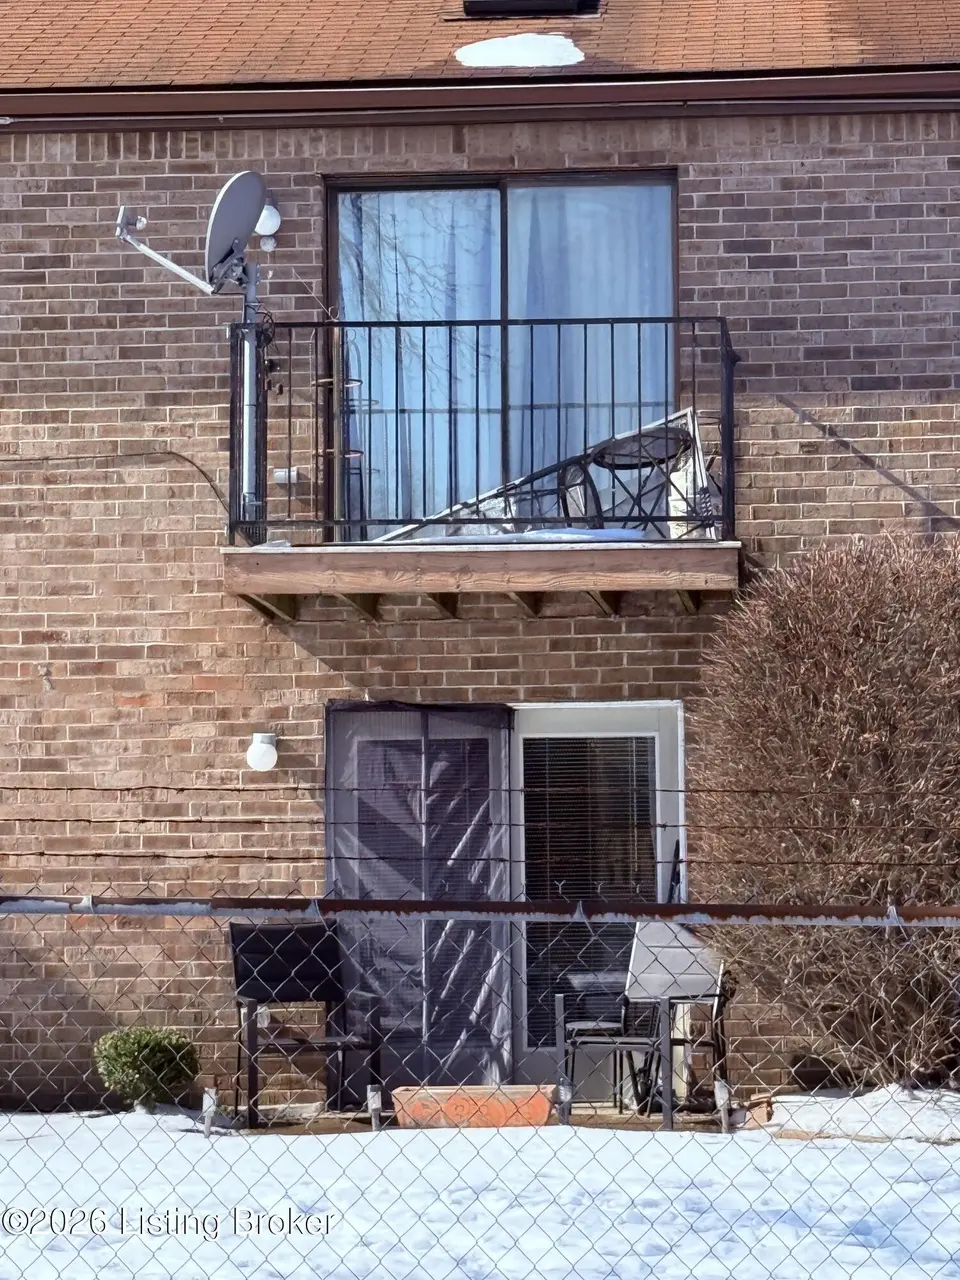
6510 Six Mile Ln #3 · Louisville/Jefferson County metro government (balance), KY
Flood risk 1/10 · Minimal
- FEMA flood zone
- X (unshaded)
- Chance of flooding over 30 yrs
- 0.0%
- Est. flood insurance / yr
- $507 – $1,088
Fire risk 1/10 · Minimal
- Est. fire insurance / yr
- $839 – $1,559
Heat risk 5/10 · Moderate
- Hot days now (above 103°F)
- 7 days/yr
- Hot days in 30 yrs
- 20 days/yr
Wind risk 2/10 · Minimal
- Chance of severe wind over 30 yrs
- 2.0%
Air-quality risk 3/10 · Minor
- Unhealthy air days now
- 2 days/yr
- Unhealthy air days in 30 yrs
- 5 days/yr
Risk factors via First Street. Map © Google.
Why this score? — see what drove the D grade
The composite is a weighted blend of 9 inputs, each scored 0–100. Each bar is that input's sub-score; the figure is the points it added to the 100-point composite (weight × sub-score).
- Cash flow +15.0/30.0
- ARV discount +7.5/15.0
- 1% rule +5.0/10.0
- DSCR +5.0/10.0
- Livability +2.5/5.0
- Condition / age +2.5/5.0
- Schools +2.3/10.0
- Rent growth +1.6/5.0
- Appreciation +0.0/10.0
$1
🖨 Deal sheet 📄 Offer letter ✓ Due diligence
Listing remarks
PROPERTY IS GOING TO AUCTION ONLINE ONLY APRIL 26TH-30TH WWW. AUCTIONGROUPS. COM THIS IS PART OF 13 PROPERTIES GOING TO AUCTION. PLEASE VISIT OUR WEBSITE FOR COMPLET DETAILS
Key facts
- Built 1982
- Listed 14 days
Property features AI
Finance
- HOA & community: Association present with $0 association fee; Pets allowed per restrictions; Subdivision: ARBOR PLACE
Exterior
- Parking: No parking
- Utilities: Utilities: Other
- Home design: Residential property (subtype: Auction); Other architectural style; Single-story; Entry level: first floor
- Construction: Built in 1982; Brick construction; Shingle roof; Slab foundation
- Exterior features: Lot features: see remarks; No fencing indicated
Interior
- Kitchen: Kitchen on the first floor
- Bedrooms: 1 bedroom on the first floor; Primary bedroom on the first floor
- Bathrooms: 1 full bathroom on the first floor
- Heating & cooling: Radiant heating; Central air conditioning
- Interior features: 4 total rooms; Family room on the first floor; No basement
- Laundry & utility: No first-floor laundry
Neighborhood map
What this means for you Summary
Snapshot
- This is a 1-bed/1.0-bath condo listed at $1.
Deal economics
- At list price, monthly cash flow is $670 ($8k/yr) — positive.
- The deal already cash-flows at list — no discount required.
- Meets the 1% rule at list price ($1k rent vs $1).
- Cap rate 803721.3% vs local median 4.0% in Louisville/Jefferson County metro government (balance) — top-decile yield for the area; either an underpriced asset or a hidden risk that comps aren't pricing in. Stress-test before assuming the spread holds.
Location & tenants
- Location reads: area grade D — affects rentability + tenant quality, not the cash-flow math above.
- Jefferson County (urban): math 19% / reading 35% proficiency, ranked #121 of 165 in KY (top 73%) — low school quality limits family demand, transient renter base, plan for 1-2y turnover.
- Market conditions: Rents falling (-3.5%/yr); 100 active listings in the ZIP; 28 comparable units currently listed for rent nearby; rentals at typical pace (median 17d on market — plan ~3-4 weeks tenant-placement turnaround); 2,836 units permitted in Jefferson County in 2024 (1,558 in 5+ unit buildings).
Forward outlook
- Local home prices are declining (-3.0%/yr); year-one equity from $0 of loan paydown is wiped out by about $0 of value loss. Plan a longer hold.
- Jefferson County population projected at +13% by 2050 — modest demand growth; plan on rents tracking national, not racing it.
- At projected returns (-3.0% appreciation + 0.0% rent growth), your $0 cash investment doubles in ~1 year — after that, you're playing with house money.
Negotiation context
- Only 14 days on market — expect competitive offers; lowballing is unlikely to land.
- 5 sale attempts since 22y ago with the ask held roughly flat each time — persistent listings suggest the price (not the market) is what's stuck; bring a comps-based counter.
Risks & watch-outs
- Climate carrying-cost: extreme-heat days projected 7→20/yr by 2055 (HVAC capex compounding) — expect insurance premiums to compound above CPI over the hold.
Questions for the listing agent
- What does the HOA fee cover, when was the last increase, and are there any pending special assessments or reserve-fund shortfalls?
- Any open or pending special assessments — roof, HVAC, plumbing, elevator, façade? What's the per-unit balance and payoff schedule, and is the seller paying it off at close or rolling it to the buyer?
- Is there a deadline driving the sale (1031 exchange, divorce, estate, relocation)? That informs how much negotiation room exists.
- The area grade is low — what's the realistic commute time and amenity access for the typical tenant pool here? Any planned neighborhood developments (good or bad) we should know about?
- What's the average days-on-market for RENTAL listings here right now (not sales)? A rising rental-DOM trend means longer vacancies and softer asking-rent achievability than the comps imply.
- What's the recent tenant-quality profile in this submarket — average credit score on applications, eviction rate, late-payment / NSF rate, and stable-employment percentage? A property-management company in the area should have these aggregated.
- How much new apartment / multifamily construction is in the pipeline within 1–3 miles? Heavy new supply (>2% of stock underway) typically softens rents 12–24 months out; light construction supports rent growth.
Investment metrics
- 1% rule
- 107186.00% ✓
- Cap rate
- 803721.28%
- Cash-on-cash
- 2870410.67%
- DSCR
- 127718.12
- GRM
- 0.0
CMA / ARV
No comps found within radius.
Projected returns pro-forma
-3.0% appreciation · 0.0% rent growth · sell at horizon
- IRR
- —
- Equity multiple
- 141576.43×
- Total profit
- $39,641
- Equity at exit
- $0
- IRR
- —
- Equity multiple
- 277912.62×
- Total profit
- $77,815
- Equity at exit
- $0
Cash invested: $0 (down + closing). Projections, not guarantees.
Landlord ↔ Tenant lean methodology
- Overall (STATE)
- 83 Strongly Landlord-Friendly
- State Kentucky
- 83 Strongly Landlord-Friendly · R+16
- County
- — inherits STATE
- City
- — inherits STATE
ZIP-level market 40218
- Rents YoY
- -3.5%
- Active inventory
- 100
Monthly cashflow live
- Estimated rent
- $1,072 high interval (Pro) →
- Mortgage (P&I)
- −$0
- Tax est. 1.5%
- −$0 /mo · $0/yr
- Insurance
- −$0
- HOA est. from 1 same-building comp
- −$177
- Vacancy / Maint / Mgmt
- −$225
- Net cashflow
- $670
Break-even live
UW: 25.0% down · 7.5% · 30yr · 1.5% tax · 5.0% vac · 8.0% maint · 8.0% mgmt
Financing live
Cash to close
- Down payment
- $0
- Closing costs
- $0
- Reserves months
- —
- Total cash needed
- —
Loan-product check · same deal, 3 products live
Conventional
25% down · 7.5% · 30yr
- Down + closing
- —
- Monthly P&I
- —
- Monthly cashflow
- —
- DSCR
- —
- Eligible?
- —
Personal DTI + credit; lowest rate.
DSCR
20% down · 8.5% · 30yr
- Down + closing
- —
- Monthly P&I
- —
- Monthly cashflow
- —
- DSCR
- —
- Eligible?
- —
No personal income docs; deal must DSCR.
Hard money
10% down · 12.0% · 12mo
- Down + closing
- —
- Monthly P&I
- —
- Monthly cashflow
- —
- DSCR
- —
- Eligible?
- —
Short-term bridge; refi at stabilization.
Rent comps 28 comps
| Address | Beds | Baths | Sqft | Rent | $/sqft | DOM | Units | Dist |
|---|---|---|---|---|---|---|---|---|
| 6512 Six Mile Ln #6 Louisville, KY | 2.0 | 2.0 | 900 | $1,099 | $1.22 | 3d | 1 | 0.05mi |
| 6512 Six Mile Ln #6 Louisville, KY | 2.0 | 2.0 | 900 | $1,099 | $1.22 | 16d | 1 | 0.05mi |
| 6710 Six Mile Ln Louisville, KY | 2.0 | 1.0 | 1005 | $1,275 | $1.27 | 23d | 1 | 0.23mi |
| 6710 Six Mile Ln Louisville, KY | 2.0 | 1.0 | 1005 | $1,275 | $1.27 | 14d | 1 | 0.23mi |
| 3424 Breckenridge Ln Louisville, KY | 2.0 | 1.0–2.0 | 875 | $1,229 | $1.40 | 3d | 6 | 0.37mi |
| 4401 Landside Dr Unit 3 Louisville, KY | 2.0 | 1.0 | 850 | $850 | $1.00 | 10d | 1 | 0.56mi |
| 4405 Landside Dr Unit 3 Louisville, KY | 2.0 | 1.0 | 800 | $800 | $1.00 | 23d | 1 | 0.58mi |
| 4508 Landside Dr Unit 12 Louisville, KY | 2.0 | 1.0 | 950 | $1,000 | $1.05 | 3d | 1 | 0.63mi |
| 3712 Klondike Ln Louisville, KY | 2.0 | 1.0 | 875 | $950 | $1.09 | 17d | 1 | 0.85mi |
| 7025 Bronner Cir Louisville, KY | 1.0–2.0 | 1.0–2.5 | 1050 | $1,063 | $1.01 | 11d | 9 | 0.88mi |
| 3710 Noblitt Dr Apt 3 Louisville, KY | 2.0 | 1.0 | 950 | $1,100 | $1.16 | 17d | 1 | 0.94mi |
| 5935 6 Mile Ln Unit Second Floor Louisville, KY | 2.0 | 1.0 | 980 | $1,500 | $1.53 | 23d | 1 | 0.96mi |
| 3705 Briarbridge Ln Unit 4 Louisville, KY | 2.0 | 1.0 | 750 | $750 | $1.00 | 23d | 1 | 0.97mi |
| 3705 Briarbridge Ln Unit 4 Louisville, KY | 2.0 | 1.0 | 750 | $750 | $1.00 | 21d | 1 | 0.97mi |
| 8010 Summerfield Cir Louisville, KY | 1.0–3.0 | 1.0–2.5 | 1100 | $1,020 | $0.93 | 14d | 1 | 1.04mi |
| 2906 Noe Ct Unit 2 Louisville, KY | 2.0 | 1.0 | 878 | $895 | $1.02 | 23d | 1 | 1.08mi |
| 2106 Buechel Bank Rd Louisville, KY | 1.0–3.0 | 1.0 | 1000 | $1,069 | $1.07 | 3d | 7 | 1.08mi |
| 4313 Norbrook Dr Unit 4 Louisville, KY | 2.0 | 1.0 | 725 | $950 | $1.31 | 23d | 1 | 1.09mi |
| 3245 Orchard Manor Cir Louisville, KY | 1.0–2.0 | 1.0–2.0 | 950 | $950 | $1.00 | 3d | 3 | 1.11mi |
| 3316 Noe Way Louisville, KY | 2.0 | 1.0 | 950 | $950 | $1.00 | 3d | 2 | 1.13mi |
| 3206 Orchard Manor Cir Apt 7 Louisville, KY | 2.0 | 1.0 | 850 | $900 | $1.06 | 3d | 1 | 1.13mi |
| 3204 Orchard Manor Cir Unit 3 Louisville, KY | 2.0 | 1.0 | 750 | $900 | $1.20 | 3d | 1 | 1.14mi |
| 3416 Clingstone Way Louisville, KY | 2.0 | 1.5 | 900 | $1,150 | $1.28 | 17d | 1 | 1.16mi |
| 7204 Churchill Park Dr Louisville, KY | 1.0–3.0 | 1.0–2.0 | 1020 | $1,025 | $1.00 | 20d | 35 | 1.17mi |
| 3216 Hikes Ln Louisville, KY | 2.0 | 1.5 | 900 | $1,150 | $1.28 | 23d | 1 | 1.17mi |
| 3206 Abshire Ln Louisville, KY | 1.0–2.0 | 1.0–2.0 | 720 | $955 | $1.33 | 2d | 10 | 1.20mi |
| 2041 Shady Grove Way Louisville, KY | 3.0 | 1.0–2.0 | 754 | $1,042 | $1.38 | 23d | 4 | 1.23mi |
| 203 El Conquistador Pl Louisville, KY | 2.0 | 2.0 | 1006 | $1,400 | $1.39 | 23d | 1 | 1.32mi |
HOA detail condo
- Monthly dues
- $0 · $0/yr
- Assessments
- None detected in remarks — confirm with the listing agent.
Listing history 11 events
-
2026-05-06status Pending
-
2026-04-01$1 Active
-
2012-06-22soldstatus $46,000
-
2012-05-22historical
-
2012-05-21$54,900
-
2012-04-17$61,900
-
2006-05-30soldstatus $81,500
-
2006-05-25soldstatus $81,500
-
2006-03-29$81,500
-
2004-10-17historical
-
2004-04-16$79,500
ⓘ Source: listings_history table (triggers on properties + properties_extension) + one-shot
backfill from property_details.listing_events for pre-trigger history.
Climate risk First Street
- Flood 1/10 Low FEMA zone X (unshaded) · 0% chance over 30 yrs
- Wildfire 1/10 Low
- Heat 5/10 Major 7 d/yr ≥103°F today · 20 d/yr by 30 yrs out
- Wind 2/10 Low 2% chance of damaging wind over 30 yrs
- Air quality 3/10 Moderate 2 unhealthy d/yr today · 5 by 30 yrs out
Nearby sold comps map
Loading sold comps map…
Walkable amenities ~0.75 mi
Loading nearby amenities…
Taxation est. · year 1
- Rental income
- $12,862
- − Mortgage interest
- −$0
- − Property taxes
- −$0
- − Insurance
- −$0
- − Repairs & maintenance
- −$1,029
- − Management
- −$1,029
- − HOA
- −$2,124
- − Depreciation
- −$0
- Taxable income
- $8,680
- Est. tax owed @ 24.0%
- −$2,083
- After-tax cash flow
- $5,954/yr
For passive investors: Depreciation is non-cash, so a rental often shows a tax loss while cash-flowing — sheltering income. Rental losses are passive: they offset passive income freely, and up to $25,000/yr can offset ordinary (W-2) income if you actively participate and your MAGI is under $100k (phasing out to $0 by $150k); unused losses carry forward. On sale, claimed depreciation is recaptured at up to 25%, and gains may owe capital-gains tax (a 1031 exchange can defer both). Figures are a year-1 estimate at your 24.0% rate — not tax advice; consult a CPA.
Schools (NCES district)
- District
- Jefferson County
- NCES district ID
- 2102990
- Math proficiency
- 19% ▼ -17.00%
- Reading proficiency
- 35% ▼ -11.00%
- Median HH income
- $47,885
- Composite
- 23.45/100
- National rank
- #7884
- State rank
- #121 of 165 in KY
Livability — Louisville/Jefferson County metro government (balance)
No livability data for this city. (Only ~50 U.S. cities are tracked.)
Census & demographics
- Census place
- Louisville/Jefferson County metro government (balance), KY
- County
- Jefferson County · 790,184 people
- City population
- 419,741
- Metro
- Louisville/Jefferson County, KY-IN
- Population (ZIP)
- 33,736
- Household income
- $58,811
- Rent vs Own
- Severe rent burden
- 1590.0
Population outlook (Jefferson County) Hauer SSP2
- Today (2025)
- 823,112 people
- By 2030
- 849,343 · +3.2%
- By 2040
- 895,696 · +8.8%
- By 2050
- 933,630 · +13.4%
- By 2075
- 1,028,262 · +24.9%
- By 2100
- 1,072,675 · +30.3%
Race, ethnicity, and origin ACS 2023
- Neighborhood character
- Diverse neighborhood (Simpson 0.69)
- Race & ethnicity
- White 42% Black 32% Hispanic / Latino 17% Two or more races 16% Asian 4%
- Hispanic origin (detail)
- Mexican 5% Puerto Rican 1% Cuban 7%
- Common ancestry
- Lithuanian 1% Portuguese 1% Swiss 1%
- Foreign-born
- 20% · Canada, India, Jamaica
- Languages at home
- 77% English-only · Spanish 12% Other Indo-European 3% Arabic 1%
Political lean MEDSL · Jefferson
- 2024 margin
- D (+16.6) · D 57.4% · R 40.9% · Other 1.7%
- 2008→2024 swing
- +4.5pp toward D · 2008: 12.0pp · 2024: 16.6pp
- All cycles
- 2024: D+16.6 2020: D+20.1 2016: D+13.3 2012: D+11.1 2008: D+12.0
Not yet ingested
- Civics
- —
Market trends
- HPI YoY
- ▼ -208.23%
- Current HPI
- 257.9528
- Rent YoY
- ▼ -3.47%
- Metro
- Louisville/Jefferson County, KY-IN
- State GDP YoY
- ▲ 1.81%
- F500 in state
- 4
Industry mix (Fortune 500 HQ in KY)
| Industry | F500 HQs | Revenue |
|---|---|---|
| Healthcare | 1 | $118B |
|
||
| Food / Beverage | 1 | $7B |
|
||
Price history
-42.1% since first listed11 events — show timeline
- 2026-05-06 Pending — Metro Search MLS
- 2026-04-01 Listed $1 Metro Search MLS
- 2012-06-22 Sold (MLS) $46,000 Metro Search MLS
- 2012-05-22 Listing Removed — Metro Search MLS
- 2012-05-21 Listed $54,900 Metro Search MLS
- 2012-04-17 Listed $61,900 Metro Search MLS
- 2006-05-30 Sold (Public Records) $81,500 Public Records
- 2006-05-25 Sold (MLS) $81,500 Metro Search MLS
- 2006-03-29 Listed $81,500 Metro Search MLS
- 2004-10-17 Listing Removed — Metro Search MLS
- 2004-04-16 Listed $79,500 Metro Search MLS
Property tax history
+2.2%/yrLatest (2025): $1,093 · -2.1% YoY. Source: county tax records.
Cash-flow waterfall
monthlySold comps — $/sqft
last 12 mo · ≤1 miLoading sold comps…