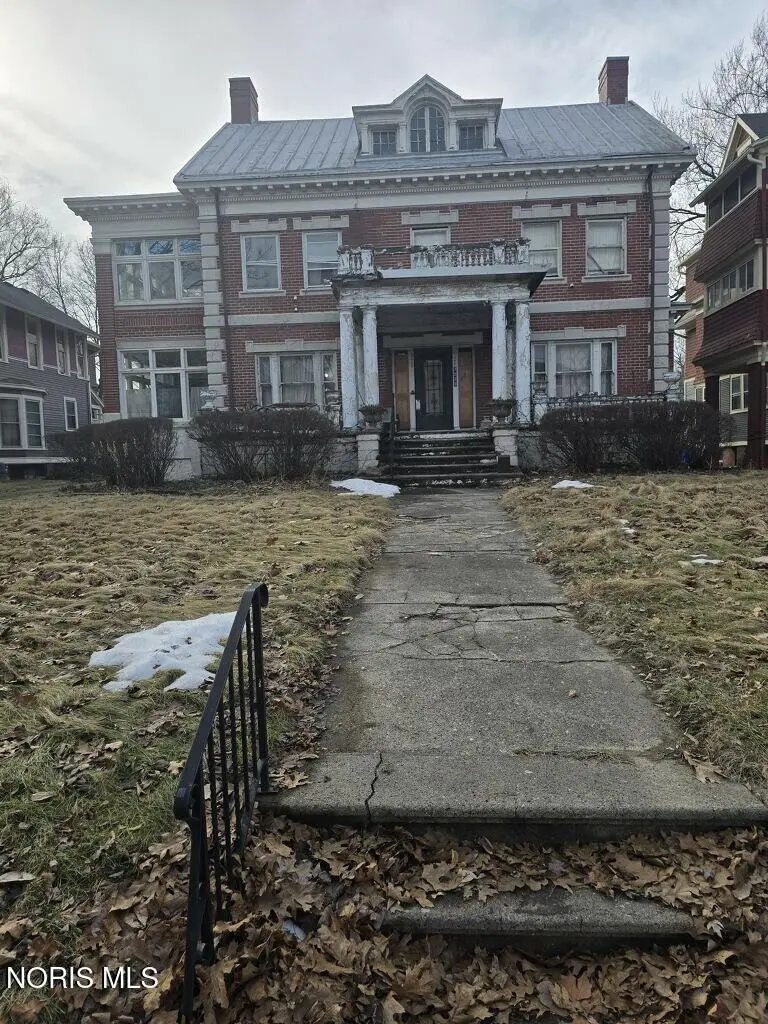
2229 Parkwood Ave · Toledo, OH
Flood risk 1/10 · Minimal
- FEMA flood zone
- X (unshaded)
- Chance of flooding over 30 yrs
- 0.0%
- Est. flood insurance / yr
- $473 – $860
Fire risk 1/10 · Minimal
- Est. fire insurance / yr
- $713 – $1,323
Heat risk 3/10 · Minor
- Hot days now (above 100°F)
- 7 days/yr
- Hot days in 30 yrs
- 16 days/yr
Wind risk 2/10 · Minimal
- Chance of severe wind over 30 yrs
- —
Air-quality risk 2/10 · Minimal
- Unhealthy air days now
- 1 days/yr
- Unhealthy air days in 30 yrs
- 3 days/yr
Risk factors via First Street. Map © Google.
Why this score? — see what drove the D grade
The composite is a weighted blend of 9 inputs, each scored 0–100. Each bar is that input's sub-score; the figure is the points it added to the 100-point composite (weight × sub-score).
- Cash flow +15.0/30.0
- ARV discount +7.5/15.0
- 1% rule +5.0/10.0
- DSCR +5.0/10.0
- Livability +3.3/5.0
- Rent growth +2.5/5.0
- Condition / age +2.5/5.0
- Schools +1.6/10.0
- Appreciation +0.0/10.0
$100,000
🖨 Deal sheet (PDF) 📄 Offer letter ✓ Due diligence
Listing remarks MLS
Grand home being sold as-is, CASH only, proof of funds required for showing. House and garage roofs need repairs, possible replacement, front porch and overhangs need to be replaced, plumbing and electrical need update-repair, needs new heating system. All offers subject to approval of City of Toledo; verification of funds for repairs to be verified.
Key facts
- 0.38 acre lot
- 3 garage spots
- Built 1912
Neighborhood map
What this means for you Summary
Snapshot
- This is a 4-bed/1.5-bath single-family listed at $100k.
Deal economics
- At list price, monthly cash flow is $3k ($34k/yr) — positive.
- The deal already cash-flows at list — no discount required.
- Meets the 1% rule at list price ($4k rent vs $100k).
- Recommended offer: $91k (9.0% below list) — sets the bar for market timing.
- Cap rate 40.3% vs local median 7.7% in Toledo — top-decile yield for the area; either an underpriced asset or a hidden risk that comps aren't pricing in. Stress-test before assuming the spread holds.
Location & tenants
- Location reads 66/100 on livability (#645 in OH) — a middle-class / working-renter tenant base. Strengths: cost of living A+, housing A+, health & safety A+; Watch: amenities C-, crime F, commute F.
- Toledo City (urban): math 15% / reading 24% proficiency, ranked #634 of 656 in OH (top 97%) — low school quality limits family demand, transient renter base, plan for 1-2y turnover; 72% free/reduced lunch — lower-income household profile, screen leases tightly.
- Zoned schools: Grove Patterson Academy Elementary School (math 47% / reading 66%, grade C+, #761 of 1,584 statewide, top 48%, 403 students, 38% FRL); Jesup W. Scott High School (math 8% / reading 17%, grade F, #726 of 781 statewide, top 94%, 736 students, 0% FRL) — zoned schools average 19% FRL vs 72% district-wide (53 pts lower); this property's tenant base skews higher-income than the district average.
- Zoned-school proficiency averages 34% at this address vs 20% district-wide (+15 pts) — the actual schools serving this property are materially stronger than the Toledo City average implies; a family-tenant draw the district grade alone would hide.
- Market conditions: 22 active listings in the ZIP; 1 comparable units currently listed for rent nearby; lower-income renter base — watch delinquency; 415 units permitted in Lucas County in 2024 (122 in 5+ unit buildings).
- At $4,500/mo this rent would consume 252% of the median local household income ($21k/yr) — very limited rent-growth headroom before tenants either downsize or default.
Forward outlook
- Local home prices are declining (-3.0%/yr); year-one equity from $691 of loan paydown is wiped out by about $3k of value loss. Plan a longer hold.
- Lucas County population projected at -16% by 2050 — secular population decline; favor cash flow + early exit over multi-decade hold.
- At projected returns (-3.0% appreciation + 3.0% rent growth), your $28k cash investment doubles in ~1 year — after that, you're playing with house money.
Negotiation context
- It's been on market 103 days — a 9% lower offer ($91k) is reasonable based on typical stale-listing flexibility.
- Current owner paid $71k; 41% above their basis — modest negotiation headroom, anchor on the comps not their cost.
Risks & watch-outs
- Watch-outs: built in 1912 — expect roof / HVAC / electrical / plumbing capex.
Questions for the listing agent
- It's been on market 103 days. Have you received any prior offers? Is the seller open to a 9% concession, seller financing, or rate buy-down credit?
- Built in 1912 — when were the roof, HVAC, electrical panel, plumbing, and water heater last replaced?
- Why hasn't it sold? Are there any deal-killer items the seller is aware of (foundation, flood, title, zoning, code violations)?
- Is there a deadline driving the sale (1031 exchange, divorce, estate, relocation)? That informs how much negotiation room exists.
- Schools are D-rated, which usually means shorter tenancies and higher turnover. Who's the typical renter profile here, and what's been the actual vacancy rate?
- Crime grade is F in this area — have there been break-ins, vandalism, or insurance claims at this property in the last 3 years? What carrier currently insures it and at what premium?
- The area grade is low — what's the realistic commute time and amenity access for the typical tenant pool here? Any planned neighborhood developments (good or bad) we should know about?
- What's the average days-on-market for RENTAL listings here right now (not sales)? A rising rental-DOM trend means longer vacancies and softer asking-rent achievability than the comps imply.
- What's the recent tenant-quality profile in this submarket — average credit score on applications, eviction rate, late-payment / NSF rate, and stable-employment percentage? A property-management company in the area should have these aggregated.
- How much new for-sale + rental construction is in the pipeline within 1–3 miles? Heavy new supply typically softens prices + rents 12–24 months out; constrained supply supports both.
Investment metrics
- 1% rule
- 4.50% ✓
- Cap rate
- 40.27%
- Cash-on-cash
- 121.34%
- DSCR
- 6.40
- GRM
- 1.9
CMA / ARV
- ARV (median comp)
- $232,373
- List price
- $100,000
- Delta
- -56.97%
- Verdict
- UNDERPRICED
- Comps
- 20 within 1.0 mi
Show comp detail 7 sales within ~0.75 mi
| Address | Dist | Beds/Ba | Sqft | Sold | Price | $/sf | Match |
|---|---|---|---|---|---|---|---|
| 2238 Scottwood Ave | 0.06mi | 4/3.5 | 3,527 (+3%) | 10mo | $315,777 | $90 | 76 |
| 2244 Scottwood Ave | 0.07mi | 4/2.5 | 3,234 (-6%) | 15mo | $365,000 | $113 | 71 |
| 2040 Glenwood Ave | 0.31mi | 5/3.0 (+1) | 3,338 (-3%) | 7mo | $215,000 | $64 | 64 |
| 629 Virginia St | 0.09mi | 5/3.5 (+1) | 3,802 (+11%) | 1mo | $195,000 | $51 | 64 |
| 2267 Robinwood Ave | 0.19mi | 5/3.5 (+1) | 3,670 (+7%) | 8mo | $346,750 | $94 | 60 |
| 2309 Robinwood Ave | 0.21mi | 4/2.5 | 3,812 (+11%) | 18mo | $279,900 | $73 | 53 |
| 2815 Collingwood Blvd | 0.73mi | 5/3.5 (+1) | 3,949 (+15%) | 6mo | $279,000 | $71 | 23 |
Match score weights: distance 35% · size 25% · config 20% · recency 20%. Top-matched comps best support the ARV.
Projected returns pro-forma
-3.0% appreciation · 3.0% rent growth · sell at horizon
- IRR
- —
- Equity multiple
- 6.86×
- Total profit
- $164,215
- Equity at exit
- $14,910
- IRR
- —
- Equity multiple
- 14.41×
- Total profit
- $375,557
- Equity at exit
- $8,646
Cash invested: $28,000 (down + closing). Projections, not guarantees.
Landlord ↔ Tenant lean methodology
- Overall (STATE)
- 73 Landlord-Friendly
- State Ohio
- 73 Landlord-Friendly · R+6
- County
- — inherits STATE
- City
- — inherits STATE
ZIP-level market 43620
- Home prices YoY
- -33.0%
- Active inventory
- 22
- Price-to-rent
- 1.9×
Monthly cashflow live
- Estimated rent
- $4,500 medium interval (Pro) →
- Mortgage (P&I)
- −$524
- Tax from tax record
- −$158 /mo · $1,891/yr
- Insurance
- −$42
- HOA
- −$0
- Vacancy / Maint / Mgmt
- −$945
- Net cashflow
- $2,831
Break-even live
Sensitivity live
| Price | -10% $2,888 | -5% $2,860 | +0% $2,831 | +5% $2,803 | +10% $2,775 |
|---|---|---|---|---|---|
| Rent | -10% $2,476 | -5% $2,654 | +0% $2,831 | +5% $3,009 | +10% $3,187 |
| Rate | -1.0pp $2,882 | -0.5pp $2,857 | base $2,831 | +0.5pp $2,805 | +1.0pp $2,779 |
UW: 25.0% down · 7.5% · 30yr · 1.5% tax · 5.0% vac · 8.0% maint · 8.0% mgmt
Financing live
Cash to close
- Down payment
- $25,000
- Closing costs
- $3,000
- Reserves months
- —
- Total cash needed
- —
Loan-product check · same deal, 3 products live
Conventional
25% down · 7.5% · 30yr
- Down + closing
- —
- Monthly P&I
- —
- Monthly cashflow
- —
- DSCR
- —
- Eligible?
- —
Personal DTI + credit; lowest rate.
DSCR
20% down · 8.5% · 30yr
- Down + closing
- —
- Monthly P&I
- —
- Monthly cashflow
- —
- DSCR
- —
- Eligible?
- —
No personal income docs; deal must DSCR.
Hard money
10% down · 12.0% · 12mo
- Down + closing
- —
- Monthly P&I
- —
- Monthly cashflow
- —
- DSCR
- —
- Eligible?
- —
Short-term bridge; refi at stabilization.
Rent comps 1 comps
| Address | Beds | Baths | Sqft | Rent | $/sqft | DOM | Units | Dist |
|---|---|---|---|---|---|---|---|---|
| 335 N Superior St Toledo, OH | 3.0 | 2.0 | 3600 | $4,500 | $1.25 | 45d | 1 | 1.44mi |
Listing history 20 events
-
2026-06-21days on market $100,000 Active 103 DOM
-
2026-06-18days on market $100,000 Active 100 DOM
-
2026-06-17days on market $100,000 Active 99 DOM
-
2026-06-16days on market $100,000 Active 98 DOM
-
2026-06-15days on market $100,000 Active 97 DOM
-
2026-06-14days on market $100,000 Active 95 DOM
-
2026-06-10days on market $100,000 Active 92 DOM
-
2026-06-09days on market $100,000 Active 91 DOM
-
2026-06-08days on market $100,000 Active 90 DOM
-
2026-06-07days on market $100,000 Active 89 DOM
-
2026-06-05days on market $100,000 Active 86 DOM
-
2026-06-03days on market $100,000 Active 85 DOM
-
2026-06-02days on market $100,000 Active 84 DOM
-
2026-06-01days on market $100,000 Active 83 DOM
-
2026-05-31days on market $100,000 Active 82 DOM
-
2026-05-30days on market $100,000 Active 81 DOM
-
2026-03-10$100,000 Active 352-char remark
Show marketing remark (352 chars)
Grand home being sold as-is, CASH only, proof of funds required for showing. House and garage roofs need repairs, possible replacement, front porch and overhangs need to be replaced, plumbing and electrical need update-repair, needs new heating system. All offers subject to approval of City of Toledo; verification of funds for repairs to be verified.
-
2026-02-20historical $100,000 352-char remark
Show marketing remark (352 chars)
Grand home being sold as-is, CASH only, proof of funds required for showing. House and garage roofs need repairs, possible replacement, front porch and overhangs need to be replaced, plumbing and electrical need update-repair, needs new heating system. All offers subject to approval of City of Toledo; verification of funds for repairs to be verified.
-
1987-04-01soldstatus $71,000
-
1968-07-29soldstatus $21,000
ⓘ Source: listings_history table (triggers on properties + properties_extension) + one-shot
backfill from property_details.listing_events for pre-trigger history.
Tax reassessment forecast OH · Partial reset (capped growth)
- Current annual tax
- $1,891 · $158/mo
- Projected year-2 tax
- $1,891 · $158/mo
- Expected delta
- $0/yr ($0/mo · -0.0%)
ⓘ Screening estimate from a state-policy table — verify with the county assessor before closing.
Climate risk First Street
- Flood 1/10 Low FEMA zone X (unshaded) · 0% chance over 30 yrs
- Wildfire 1/10 Low
- Heat 3/10 Moderate 7 d/yr ≥100°F today · 16 d/yr by 30 yrs out
- Wind 2/10 Low
- Air quality 2/10 Low 1 unhealthy d/yr today · 3 by 30 yrs out
Nearby sold comps map
Loading sold comps map…
Walkable amenities ~0.75 mi
Loading nearby amenities…
Taxation est. · year 1
- Rental income
- $54,000
- − Mortgage interest
- −$5,602
- − Property taxes
- −$1,891
- − Insurance
- −$500
- − Repairs & maintenance
- −$4,320
- − Management
- −$4,320
- − Depreciation
- −$2,909
- Taxable income
- $34,459
- Est. tax owed @ 24.0%
- −$8,270
- After-tax cash flow
- $25,706/yr
For passive investors: Depreciation is non-cash, so a rental often shows a tax loss while cash-flowing — sheltering income. Rental losses are passive: they offset passive income freely, and up to $25,000/yr can offset ordinary (W-2) income if you actively participate and your MAGI is under $100k (phasing out to $0 by $150k); unused losses carry forward. On sale, claimed depreciation is recaptured at up to 25%, and gains may owe capital-gains tax (a 1031 exchange can defer both). Figures are a year-1 estimate at your 24.0% rate — not tax advice; consult a CPA.
Schools (NCES district)
- District
- Toledo City
- NCES district ID
- 3904490
- Math proficiency
- 15% ▼ -16.00%
- Reading proficiency
- 24% ▼ -13.00%
- Median HH income
- $32,137
- Composite
- 15.76/100
- National rank
- #9276
- State rank
- #634 of 656 in OH
Livability — Toledo
- Score
- 66/100
- State rank
- #645
- US rank
- #11442
Category grades
Schools grade is shown separately in the Schools card above.
Census & demographics
- Census place
- Toledo, OH
- County
- Lucas · 437,818 people
- City population
- 280,811
- Metro
- Toledo, OH
- Population (ZIP)
- 5,039
- Household income
- $21,405
- Rent vs Own
- Severe rent burden
- 2.1
Population outlook (Lucas County) Hauer SSP2
- Today (2025)
- 420,751 people
- By 2030
- 410,187 · -2.5%
- By 2040
- 384,019 · -8.7%
- By 2050
- 355,125 · -15.6%
- By 2075
- 291,683 · -30.7%
- By 2100
- 233,670 · -44.5%
Race, ethnicity, and origin ACS 2023
- Neighborhood character
- Diverse neighborhood (Simpson 0.60)
- Race & ethnicity
- Black 51% White 36% Hispanic / Latino 9% Two or more races 7%
- Hispanic origin (detail)
- Mexican 8% Puerto Rican 1%
- Common ancestry
- Romanian 4% Lithuanian 2% Italian 2%
- Foreign-born
- 2% · Canada
- Languages at home
- 98% English-only · Other Indo-European 1% Tagalog/Filipino 1%
Political lean MEDSL · Lucas
- 2024 margin
- D (+12.6) · D 55.8% · R 43.2%
- 2008→2024 swing
- -18.9pp toward R · 2008: 31.4pp · 2024: 12.6pp
- All cycles
- 2024: D+12.6 2020: D+16.8 2016: D+17.4 2012: D+30.4 2008: D+31.4
Not yet ingested
- Civics
- —
Market trends
- HPI YoY
- ▼ -63.87%
- Current HPI
- 129.7922
- Rent YoY
- —
- Metro
- —
- State GDP YoY
- ▲ 1.98%
- F500 in state
- 48
Industry mix (Fortune 500 HQ in OH)
| Industry | F500 HQs | Revenue |
|---|---|---|
| Insurance | 3 | $145B |
|
||
| Industrial Machinery | 3 | $49B |
|
||
| Financial Services | 3 | $24B |
|
||
| Consumer Goods | 2 | $93B |
|
||
| Aerospace / Defense | 2 | $47B |
|
||
| Utilities | 2 | $33B |
|
||
Price history
+376.2% since first listed4 events — show timeline
- 2026-03-10 Listed $100,000 NORIS
- 2026-02-20 Coming Soon $100,000 NORIS
- 1987-04-01 Sold (Public Records) $71,000 Public Records
- 1968-07-29 Sold (Public Records) $21,000 Public Records
Property tax history
+4.2%/yrLatest (2025): $1,891 · -0.7% YoY. Source: county tax records.
Cash-flow waterfall
monthlySold comps — $/sqft
last 12 mo · ≤1 miLoading sold comps…