4224 NW 30th Ter · Gainesville, FL
Flood risk 1/10 · Minimal
- FEMA flood zone
- X (unshaded)
- Chance of flooding over 30 yrs
- 0.0%
- Est. flood insurance / yr
- $507 – $1,088
Fire risk 2/10 · Minimal
- Est. fire insurance / yr
- $947 – $1,759
Heat risk 8/10 · Major
- Hot days now (above 107°F)
- 7 days/yr
- Hot days in 30 yrs
- 19 days/yr
Wind risk 9/10 · Severe
- Chance of severe wind over 30 yrs
- 99.0%
Air-quality risk 3/10 · Minor
- Unhealthy air days now
- 4 days/yr
- Unhealthy air days in 30 yrs
- 4 days/yr
Risk factors via First Street. Map © Google.
Why this score? — see what drove the F grade
The composite is a weighted blend of 9 inputs, each scored 0–100. Each bar is that input's sub-score; the figure is the points it added to the 100-point composite (weight × sub-score).
- Cash flow +8.2/30.0
- ARV discount +7.5/15.0
- Schools +4.3/10.0
- Livability +4.0/5.0
- Rent growth +3.6/5.0
- 1% rule +2.5/10.0
- Condition / age +2.5/5.0
- DSCR +2.2/10.0
- Appreciation +0.0/10.0
$230,000
🖨 Deal sheet (PDF) 📄 Offer letter ✓ Due diligence
Listing remarks MLS
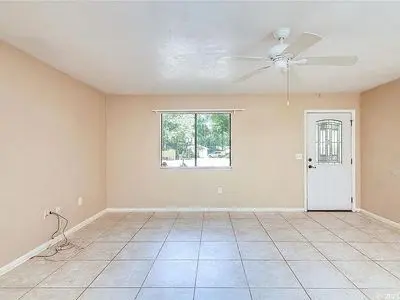
Nestled on a gorgeous culdesac lot in Springtree, find this adorable home that is ready for you to make your own, with a little love this can be the perfect place, this 2 bed 1 bath PLUS BONUS ROOM house features a BRAND NEW ROOF that has been paid for and in process of being done, along with an amazingly over sized lot. Attached GARAGE/CARPORT. Location is Key! Right in the heart of NW Gainesville. Minutes to I-75, 441, and a very easy drive to UF, Shands and the VA.
Key facts
- Sturdy foundations
- Kitchen
- Living room
Tags
Property features AI
Exterior
- Home design: Built in 1995; Single-family property
- Construction: Built in 1995
- Exterior features: Located in the Springtree subdivision
Neighborhood map
What this means for you Summary
Snapshot
- This is a 2-bed/1.0-bath single-family listed at $230k.
Deal economics
- At list price, monthly cash flow is $-219 ($-3k/yr) — negative.
- To cash-flow at today's rent, offer at most $191k (16.8% below list).
- To meet the 1% rule (rent ≥ 1% of price), the offer needs to be $172k (25.2% below list).
- Recommended offer: $172k (25.2% below list) — sets the bar for 1% rule.
Location & tenants
- Location reads 81/100 on livability (#97 in FL, #1,480 nationally) — a professional / high-income tenant draw. Strengths: amenities A+, commute A+, cost of living A+; Watch: employment D+, crime F.
- Alachua (urban): math 49% / reading 54% proficiency, ranked #30 of 73 in FL (top 41%) — acceptable for families but not a draw, mixed tenant base, ~2y average lease.
- Market conditions: Rents rising fast (+4.4%/yr); 260 active listings in the ZIP; 1 comparable units currently listed for rent nearby; solid renter incomes; 1,774 units permitted in Alachua County in 2024 (984 in 5+ unit buildings).
Forward outlook
- Local home prices are declining (-3.0%/yr); year-one equity from $2k of loan paydown is wiped out by about $7k of value loss. Plan a longer hold.
- Alachua County population projected at +26% by 2050 — long-run rental-demand tailwind backs the buy-and-hold thesis.
Negotiation context
- Only 6 days on market — expect competitive offers; lowballing is unlikely to land.
- 5 sale attempts since 21y ago with the ask held roughly flat each time — persistent listings suggest the price (not the market) is what's stuck; bring a comps-based counter.
- Current owner paid $200k; 15% above their basis — modest negotiation headroom, anchor on the comps not their cost.
Risks & watch-outs
- Climate carrying-cost: severe wind risk, 99% chance of damaging wind over 30y; extreme-heat days projected 7→19/yr by 2055 (HVAC capex compounding) — expect insurance premiums to compound above CPI over the hold.
Questions for the listing agent
- What do current leases actually rent for vs. the listed asking? Can we see a recent rent roll and the last 12 months of T-12 income?
- Is there a deadline driving the sale (1031 exchange, divorce, estate, relocation)? That informs how much negotiation room exists.
- Schools are B-rated — typically a magnet for longer-tenancy family renters. What's the average tenant stay here, and is there a school-zone premium baked into asking?
- Crime grade is F in this area — have there been break-ins, vandalism, or insurance claims at this property in the last 3 years? What carrier currently insures it and at what premium?
- The area grade is low — what's the realistic commute time and amenity access for the typical tenant pool here? Any planned neighborhood developments (good or bad) we should know about?
- What's the average days-on-market for RENTAL listings here right now (not sales)? A rising rental-DOM trend means longer vacancies and softer asking-rent achievability than the comps imply.
- What's the recent tenant-quality profile in this submarket — average credit score on applications, eviction rate, late-payment / NSF rate, and stable-employment percentage? A property-management company in the area should have these aggregated.
- How much new for-sale + rental construction is in the pipeline within 1–3 miles? Heavy new supply typically softens prices + rents 12–24 months out; constrained supply supports both.
Investment metrics
- 1% rule
- 0.75% ✗
- Cap rate
- 5.15%
- Cash-on-cash
- -4.07%
- DSCR
- 0.82
- GRM
- 11.1
CMA / ARV
No comps found within radius.
Projected returns pro-forma
-3.0% appreciation · 4.41% rent growth · sell at horizon
- IRR
- -21.6%
- Equity multiple
- 0.24×
- Total profit
- $-48,701
- Equity at exit
- $34,294
- IRR
- -12.3%
- Equity multiple
- 0.23×
- Total profit
- $-49,811
- Equity at exit
- $19,886
Cash invested: $64,400 (down + closing). Projections, not guarantees.
Landlord ↔ Tenant lean methodology
- Overall (STATE)
- 87 Strongly Landlord-Friendly
- State Florida
- 87 Strongly Landlord-Friendly · R+3
- County
- — inherits STATE
- City
- — inherits STATE
ZIP-level market 32605
- Home prices YoY
- -34.2%
- Rents YoY
- 4.4%
- Active inventory
- 260
- Price-to-rent
- 11.1×
Monthly cashflow live
- Estimated rent
- $1,720 medium interval (Pro) →
- Mortgage (P&I)
- −$1,206
- Tax from tax record
- −$276 /mo · $3,306/yr
- Insurance
- −$96
- HOA
- −$0
- Vacancy / Maint / Mgmt
- −$361
- Net cashflow
- $-219
Break-even live
Sensitivity live
| Price | -10% $-88 | -5% $-154 | +0% $-219 | +5% $-284 | +10% $-349 |
|---|---|---|---|---|---|
| Rent | -10% $-355 | -5% $-287 | +0% $-219 | +5% $-151 | +10% $-83 |
| Rate | -1.0pp $-103 | -0.5pp $-160 | base $-219 | +0.5pp $-278 | +1.0pp $-339 |
UW: 25.0% down · 7.5% · 30yr · 1.5% tax · 5.0% vac · 8.0% maint · 8.0% mgmt
Financing live
Cash to close
- Down payment
- $57,500
- Closing costs
- $6,900
- Reserves months
- —
- Total cash needed
- —
Loan-product check · same deal, 3 products live
Conventional
25% down · 7.5% · 30yr
- Down + closing
- —
- Monthly P&I
- —
- Monthly cashflow
- —
- DSCR
- —
- Eligible?
- —
Personal DTI + credit; lowest rate.
DSCR
20% down · 8.5% · 30yr
- Down + closing
- —
- Monthly P&I
- —
- Monthly cashflow
- —
- DSCR
- —
- Eligible?
- —
No personal income docs; deal must DSCR.
Hard money
10% down · 12.0% · 12mo
- Down + closing
- —
- Monthly P&I
- —
- Monthly cashflow
- —
- DSCR
- —
- Eligible?
- —
Short-term bridge; refi at stabilization.
Rent comps 1 comps
| Address | Beds | Baths | Sqft | Rent | $/sqft | DOM | Units | Dist |
|---|---|---|---|---|---|---|---|---|
| 2220 NW 55th Blvd Gainesville, FL | 2.0 | 1.0 | 928 | $1,465 | $1.58 | 21d | 1 | 1.22mi |
Listing history 6 events
-
2026-06-18days on market $230,000 Active 6 DOM
-
2026-06-17days on market $230,000 Active 5 DOM
-
2026-06-16days on market $230,000 Active 4 DOM
-
2026-06-15days on market $230,000 Active 3 DOM
-
2026-06-13remarks 179-char remark
-
2026-06-13$230,000 Active 1 DOM
ⓘ Source: listings_history table (triggers on properties + properties_extension) + one-shot
backfill from property_details.listing_events for pre-trigger history.
Tax reassessment forecast FL · Resets to sale price
- Current annual tax
- $3,306 · $276/mo
- Projected year-2 tax
- $3,306 · $276/mo
- Expected delta
- $0/yr ($0/mo · 0.0%)
ⓘ Screening estimate from a state-policy table — verify with the county assessor before closing.
Climate risk First Street
- Flood 1/10 Low FEMA zone X (unshaded) · 0% chance over 30 yrs
- Wildfire 2/10 Low
- Heat 8/10 Severe 7 d/yr ≥107°F today · 19 d/yr by 30 yrs out
- Wind 9/10 Extreme 99% chance of damaging wind over 30 yrs
- Air quality 3/10 Moderate 4 unhealthy d/yr today · 4 by 30 yrs out
Nearby sold comps map
Loading sold comps map…
Walkable amenities ~0.75 mi
Loading nearby amenities…
Taxation est. · year 1
- Rental income
- $20,641
- − Mortgage interest
- −$12,884
- − Property taxes
- −$3,306
- − Insurance
- −$1,150
- − Repairs & maintenance
- −$1,651
- − Management
- −$1,651
- − Depreciation
- −$6,691
- Taxable loss
- −$6,692
- Est. tax savings @ 24.0%
- +$1,606
- After-tax cash flow
- $-1,017/yr
For passive investors: Depreciation is non-cash, so a rental often shows a tax loss while cash-flowing — sheltering income. Rental losses are passive: they offset passive income freely, and up to $25,000/yr can offset ordinary (W-2) income if you actively participate and your MAGI is under $100k (phasing out to $0 by $150k); unused losses carry forward. On sale, claimed depreciation is recaptured at up to 25%, and gains may owe capital-gains tax (a 1031 exchange can defer both). Figures are a year-1 estimate at your 24.0% rate — not tax advice; consult a CPA.
Schools (NCES district)
- District
- Alachua
- NCES district ID
- 1200030
- Math proficiency
- 49% ▼ -9.00%
- Reading proficiency
- 54% ▼ -3.00%
- Median HH income
- $42,683
- Composite
- 43.31/100
- National rank
- #3038
- State rank
- #30 of 73 in FL
Livability — Gainesville
- Score
- 81/100
- State rank
- #97
- US rank
- #1480
Category grades
Schools grade is shown separately in the Schools card above.
Census & demographics
- Census place
- Gainesville, FL
- County
- Alachua County · 218,005 people
- City population
- 188,348
- Metro
- Gainesville, FL
- Population (ZIP)
- 24,689
- Household income
- $86,714
- Rent vs Own
- Severe rent burden
- 586.0
Population outlook (Alachua County) Hauer SSP2
- Today (2025)
- 289,834 people
- By 2030
- 305,873 · +5.5%
- By 2040
- 335,246 · +15.7%
- By 2050
- 364,719 · +25.8%
- By 2075
- 436,665 · +50.7%
- By 2100
- 482,920 · +66.6%
Race, ethnicity, and origin ACS 2023
- Neighborhood character
- Predominantly White (67%)
- Race & ethnicity
- White 67% Hispanic / Latino 12% Black 12% Two or more races 12% Asian 4%
- Hispanic origin (detail)
- Mexican 2% Puerto Rican 2% Cuban 2%
- Common ancestry
- Slovak 5% Romanian 4% Lithuanian 2%
- Foreign-born
- 10% · Canada, China, Vietnam
- Languages at home
- 84% English-only · Spanish 6% Chinese 2% Other Indo-European 2%
Political lean MEDSL · Alachua
- 2024 margin
- Strong D (+21.0) · D 59.7% · R 38.8% · Other 1.5%
- 2008→2024 swing
- -0.6pp no change · 2008: 21.6pp · 2024: 21.0pp
- All cycles
- 2024: D+21.0 2020: D+27.2 2016: D+22.5 2012: D+17.3 2008: D+21.6
Not yet ingested
- Civics
- —
Market trends
- HPI YoY
- ▼ -142.48%
- Current HPI
- 274.157
- Rent YoY
- ▲ 4.41%
- Metro
- Gainesville, FL
- State GDP YoY
- ▲ 3.28%
- F500 in state
- 36
Industry mix (Fortune 500 HQ in FL)
| Industry | F500 HQs | Revenue |
|---|---|---|
| Industrial Technology | 2 | $29B |
|
||
| Insurance | 2 | $17B |
|
||
| Retail | 1 | $60B |
|
||
| Technology Distribution | 1 | $58B |
|
||
| Homebuilding | 1 | $35B |
|
||
| Technology Manufacturing | 1 | $35B |
|
||
Price history
+499.0% since first listed15 events — show timeline
- 2026-06-13 Listed $230,000 FSBO.com
- 2021-10-04 Sold (Public Records) $200,000 Public Records
- 2021-09-17 Sold (MLS) $200,000 Stellar MLS as Distributed by MLS Grid
- 2021-07-31 Listing Removed — Stellar MLS as Distributed by MLS Grid
- 2021-07-16 Listed $199,900 Stellar MLS as Distributed by MLS Grid
- 2009-01-17 Listing Removed — Stellar MLS as Distributed by MLS Grid
- 2009-01-17 Listing Removed — Stellar MLS as Distributed by MLS Grid
- 2005-12-07 Sold (Public Records) $144,000 Public Records
- 2005-12-05 Sold (MLS) $144,000 Stellar MLS as Distributed by MLS Grid
- 2005-11-14 Listed $149,500 Stellar MLS as Distributed by MLS Grid
- 2005-11-14 Listed $149,500 Stellar MLS as Distributed by MLS Grid
- 2005-11-14 Listed $149,500 Stellar MLS as Distributed by MLS Grid
- 1995-09-01 Sold (Public Records) $59,900 Public Records
- 1984-06-01 Sold (Public Records) $46,500 Public Records
- 1980-05-01 Sold (Public Records) $38,400 Public Records
Property tax history
+5.8%/yrLatest (2025): $3,306 · +4.2% YoY. Source: county tax records.
Cash-flow waterfall
monthlySold comps — $/sqft
last 12 mo · ≤1 miLoading sold comps…