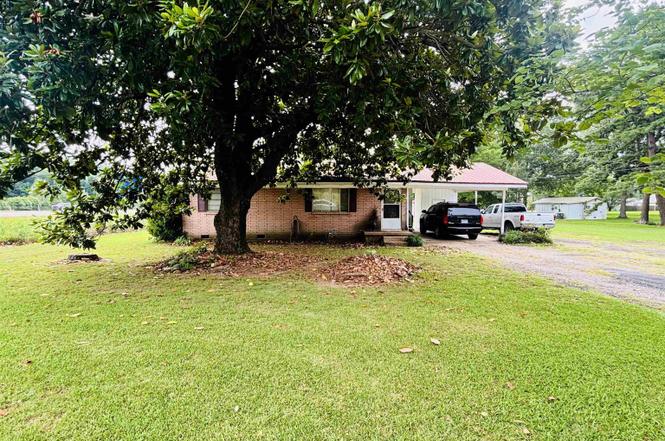
916 N Hickory St · Bald Knob, AR
Flood risk 3/10 · Minor
- FEMA flood zone
- A
- Chance of flooding over 30 yrs
- 0.2%
- Est. flood insurance / yr
- $1,009 – $1,996
Fire risk 3/10 · Minor
- Est. fire insurance / yr
- $1,499 – $2,785
Heat risk 6/10 · Moderate
- Hot days now (above 109°F)
- 7 days/yr
- Hot days in 30 yrs
- 19 days/yr
Wind risk 3/10 · Minor
- Chance of severe wind over 30 yrs
- 6.0%
Air-quality risk 1/10 · Minimal
- Unhealthy air days now
- 0 days/yr
- Unhealthy air days in 30 yrs
- 0 days/yr
Risk factors via First Street. Map © Google.
Why this score? — see what drove the C grade
The composite is a weighted blend of 9 inputs, each scored 0–100. Each bar is that input's sub-score; the figure is the points it added to the 100-point composite (weight × sub-score).
- Cash flow +17.6/30.0
- ARV discount +12.3/15.0
- Appreciation +6.7/10.0
- DSCR +5.5/10.0
- 1% rule +3.4/10.0
- Livability +2.9/5.0
- Schools +2.6/10.0
- Rent growth +2.5/5.0
- Condition / age +2.5/5.0
$115,000
🖨 Deal sheet (PDF) 📄 Offer letter ✓ Due diligence
Listing remarks MLS
Move in ready!! Structurally sound. Great for starter home or income property. House is within walking distance to all Bald Knob Schools. Sits on almost 2 acres within city limits. Inside walls, doors, trim, and cabinets painted in January 2016. Beautiful, original hardwood floors in bedrooms, living room and hallway. Selling family has owned since constructed in 1962. There is plenty of land to add on to the house, or to build more houses.
Key facts
- Convenient location
- Room to stretch out
- 1.12 acre lot
Tags
Property features AI
Finance
- Financial info: Accepts VA, FHA, Conventional loans and cash
Exterior
- Parking: Carport for 1 car
- Utilities: Public sewer; Public water; Municipal electric service (Entergy); Natural gas
- Home design: Single-family property; Brick and metal/vinyl siding exterior
- Construction: Crawl space foundation; Metal roof
- Exterior features: Level lot; Paved road access; Inside city limits
Interior
- Kitchen: Free-standing stove
- Flooring: Vinyl flooring
- Bathrooms: 1 full bathroom
- Heating & cooling: Central electric cooling; Floor/wall furnace; Gas space heater
- Interior features: Washer connection; Dryer connection (electric); Electric water heater; Formica kitchen countertops; Paneling walls
- Laundry & utility: Washer hookup; Dryer hookup (electric)
Neighborhood map
What this means for you Summary
Snapshot
- This is a 3-bed/1.0-bath single-family listed at $115k.
Deal economics
- At list price, monthly cash flow is $-35 ($-423/yr) — negative.
- To cash-flow at today's rent, offer at most $109k (5.4% below list).
- To meet the 1% rule (rent ≥ 1% of price), the offer needs to be $97k (15.5% below list).
- Recommended offer: $97k (15.5% below list) — sets the bar for 1% rule.
Location & tenants
- Location reads 57/100 on livability (#340 in AR) — a working-class tenant base; expect higher turnover. Strengths: cost of living A+, housing A+; Watch: crime F, amenities F, commute F.
- Bald Knob School District (rural): math 33% / reading 31% proficiency, ranked #144 of 238 in AR (top 60%) — families likely to look elsewhere, expect single-tenant / working-renter base with shorter leases.
- Zoned schools: H.L. Lubker Elementary School (math 39% / reading 28%, grade F, #270 of 454 statewide, top 60%, 482 students, 63% FRL); Bald Knob Middle School (math 36% / reading 32%, grade F, #127 of 201 statewide, top 64%, 258 students, 58% FRL); Bald Knob High School (math 22% / reading 32%, grade F, #164 of 292 statewide, top 61%, 366 students, 54% FRL) — zoned schools at 58% FRL track the district average.
- Market conditions: 34 active listings in the ZIP; 219 units permitted in White County in 2024 (36 in 5+ unit buildings).
Forward outlook
- In year one you build about $5k of equity ($795 loan paydown + $4k appreciation (3.4% local appreciation)).
- White County population projected at +7% by 2050 — modest demand growth; plan on rents tracking national, not racing it.
- At projected returns (3.4% appreciation + 3.0% rent growth), your $32k cash investment doubles in ~7 years — after that, you're playing with house money.
- By year 8, paydown + projected appreciation supports a ~$35k cash-out refi (75% LTV) — recoverable capital for the next deal without selling this one.
Negotiation context
- Only 9 days on market — expect competitive offers; lowballing is unlikely to land.
- 3 sale attempts since 10y ago with the ask held roughly flat each time — persistent listings suggest the price (not the market) is what's stuck; bring a comps-based counter.
- Current owner paid $45k; list at $115k implies a 156% gain — meaningful room to come down on a strong offer.
Risks & watch-outs
- Watch-outs: flood insurance adds $125/mo.
- Climate carrying-cost: in FEMA flood zone A (mandatory federal flood insurance); extreme-heat days projected 7→19/yr by 2055 (HVAC capex compounding) — expect insurance premiums to compound above CPI over the hold.
Questions for the listing agent
- What do current leases actually rent for vs. the listed asking? Can we see a recent rent roll and the last 12 months of T-12 income?
- Built in 1965 — when were the roof, HVAC, electrical panel, plumbing, and water heater last replaced?
- What's the actual annual flood-insurance premium (NFIP or private), and is the property in a SFHA with mandatory coverage?
- Is there a deadline driving the sale (1031 exchange, divorce, estate, relocation)? That informs how much negotiation room exists.
- Schools are F-rated, which usually means shorter tenancies and higher turnover. Who's the typical renter profile here, and what's been the actual vacancy rate?
- Crime grade is F in this area — have there been break-ins, vandalism, or insurance claims at this property in the last 3 years? What carrier currently insures it and at what premium?
- What's the average days-on-market for RENTAL listings here right now (not sales)? A rising rental-DOM trend means longer vacancies and softer asking-rent achievability than the comps imply.
- What's the recent tenant-quality profile in this submarket — average credit score on applications, eviction rate, late-payment / NSF rate, and stable-employment percentage? A property-management company in the area should have these aggregated.
- How much new for-sale + rental construction is in the pipeline within 1–3 miles? Heavy new supply typically softens prices + rents 12–24 months out; constrained supply supports both.
Investment metrics
- 1% rule
- 0.84% ✗
- Cap rate
- 7.23%
- Cash-on-cash
- 3.35%
- DSCR
- 1.15
- GRM
- 9.9
CMA / ARV
- ARV (on-the-fly)
- $128,744
- Comps found
- 12
Show comp detail 12 sales within ~0.75 mi
| Address | Dist | Beds/Ba | Sqft | Sold | Price | $/sf | Match |
|---|---|---|---|---|---|---|---|
| 106 Brown St St | 0.33mi | 3/1.0 | 1,108 (+4%) | 2mo | $130,000 | $117 | 76 |
| 504 Richardson | 0.27mi | 2/1.0 (-1) | 1,008 (-5%) | 1mo | $42,500 | $42 | 73 |
| 806 Walker St | 0.21mi | 3/1.0 | 1,136 (+7%) | 8mo | $138,000 | $121 | 72 |
| 209 Brown St | 0.31mi | 3/1.0 | 1,084 (+2%) | 17mo | $128,000 | $118 | 69 |
| 801 Upchurch | 0.13mi | 3/2.0 | 1,216 (+14%) | 16mo | $151,000 | $124 | 53 |
| 203 N Elm St | 0.48mi | 3/1.0 | 1,158 (+9%) | 13mo | $74,000 | $64 | 52 |
| 305 N Main St | 0.40mi | 2/1.0 (-1) | 1,206 (+13%) | 7mo | $148,000 | $123 | 48 |
| 406 N Main St | 0.35mi | 3/2.0 | 1,200 (+13%) | 22mo | $141,000 | $118 | 40 |
| 1266 Highway 258 | 0.63mi | 2/1.0 (-1) | 1,200 (+13%) | 6mo | $150,000 | $125 | 39 |
| 102 Arch St | 0.39mi | 2/1.0 (-1) | 930 (-13%) | 21mo | $119,000 | $128 | 38 |
| 105 Pasco St | 0.73mi | 3/2.0 | 1,214 (+14%) | 0mo | $163,800 | $135 | 38 |
| 102 S Collison Ave | 0.65mi | 2/1.0 (-1) | 976 (-8%) | 17mo | $105,000 | $108 | 36 |
Match score weights: distance 35% · size 25% · config 20% · recency 20%. Top-matched comps best support the ARV.
Projected returns pro-forma
3.37% appreciation · 3.0% rent growth · sell at horizon
- IRR
- 7.4%
- Equity multiple
- 1.43×
- Total profit
- $13,894
- Equity at exit
- $54,122
- IRR
- 9.9%
- Equity multiple
- 2.55×
- Total profit
- $49,888
- Equity at exit
- $85,335
Cash invested: $32,200 (down + closing). Projections, not guarantees.
Landlord ↔ Tenant lean methodology
- Overall (STATE)
- 92 Strongly Landlord-Friendly
- State Arkansas
- 92 Strongly Landlord-Friendly · R+14
- County
- — inherits STATE
- City
- — inherits STATE
ZIP-level market 72010
- Home prices YoY
- 1.7%
- Active inventory
- 34
- Price-to-rent
- 9.9×
Monthly cashflow live
- Estimated rent
- $971 medium interval (Pro) →
- Mortgage (P&I)
- −$603
- Tax from tax record
- −$26 /mo · $318/yr
- Insurance
- −$48
- Flood insurance flood zone
- −$125 /mo · $1,502/yr
- HOA
- −$0
- Vacancy / Maint / Mgmt
- −$204
- Net cashflow
- $-35
Break-even live
Sensitivity live
| Price | -10% $30 | -5% $-3 | +0% $-35 | +5% $-68 | +10% $-100 |
|---|---|---|---|---|---|
| Rent | -10% $-112 | -5% $-74 | +0% $-35 | +5% $3 | +10% $41 |
| Rate | -1.0pp $23 | -0.5pp $-6 | base $-35 | +0.5pp $-65 | +1.0pp $-95 |
UW: 25.0% down · 7.5% · 30yr · 1.5% tax · 5.0% vac · 8.0% maint · 8.0% mgmt
Financing live
Cash to close
- Down payment
- $28,750
- Closing costs
- $3,450
- Reserves months
- —
- Total cash needed
- —
Loan-product check · same deal, 3 products live
Conventional
25% down · 7.5% · 30yr
- Down + closing
- —
- Monthly P&I
- —
- Monthly cashflow
- —
- DSCR
- —
- Eligible?
- —
Personal DTI + credit; lowest rate.
DSCR
20% down · 8.5% · 30yr
- Down + closing
- —
- Monthly P&I
- —
- Monthly cashflow
- —
- DSCR
- —
- Eligible?
- —
No personal income docs; deal must DSCR.
Hard money
10% down · 12.0% · 12mo
- Down + closing
- —
- Monthly P&I
- —
- Monthly cashflow
- —
- DSCR
- —
- Eligible?
- —
Short-term bridge; refi at stabilization.
Listing history 8 events
-
2026-06-21days on market $115,000 Active 9 DOM
-
2026-06-19statusdays on market $115,000 Active 7 DOM
-
2026-06-18days on market $115,000 New Listing 6 DOM
-
2026-06-17days on market $115,000 New Listing 5 DOM
-
2026-06-16days on market $115,000 New Listing 4 DOM
-
2026-06-15days on market $115,000 New Listing 3 DOM
-
2026-06-13remarks 364-char remark
-
2026-06-13$115,000 New Listing 1 DOM
ⓘ Source: listings_history table (triggers on properties + properties_extension) + one-shot
backfill from property_details.listing_events for pre-trigger history.
Tax reassessment forecast AR · Resets to sale price
- Current annual tax
- $318 · $26/mo
- Projected year-2 tax
- $736 · $61/mo
- Expected delta
- +$418/yr (+$35/mo · 131.6%)
ⓘ Screening estimate from a state-policy table — verify with the county assessor before closing.
Climate risk First Street
- Flood 3/10 Moderate FEMA zone A · 20% chance over 30 yrs
- Wildfire 3/10 Moderate
- Heat 6/10 Major 7 d/yr ≥109°F today · 19 d/yr by 30 yrs out
- Wind 3/10 Moderate 6% chance of damaging wind over 30 yrs
- Air quality 1/10 Low 0 unhealthy d/yr today · 0 by 30 yrs out
Nearby sold comps map
Loading sold comps map…
Walkable amenities ~0.75 mi
Loading nearby amenities…
Taxation est. · year 1
- Rental income
- $11,657
- − Mortgage interest
- −$6,442
- − Property taxes
- −$318
- − Insurance
- −$2,078
- − Repairs & maintenance
- −$933
- − Management
- −$933
- − Depreciation
- −$3,345
- Taxable loss
- −$2,391
- Est. tax savings @ 24.0%
- +$574
- After-tax cash flow
- $150/yr
For passive investors: Depreciation is non-cash, so a rental often shows a tax loss while cash-flowing — sheltering income. Rental losses are passive: they offset passive income freely, and up to $25,000/yr can offset ordinary (W-2) income if you actively participate and your MAGI is under $100k (phasing out to $0 by $150k); unused losses carry forward. On sale, claimed depreciation is recaptured at up to 25%, and gains may owe capital-gains tax (a 1031 exchange can defer both). Figures are a year-1 estimate at your 24.0% rate — not tax advice; consult a CPA.
Schools (NCES district)
- District
- Bald Knob School District
- NCES district ID
- 0502700
- Math proficiency
- 33% ▼ -5.00%
- Reading proficiency
- 31% ▼ -1.00%
- Median HH income
- $35,076
- Composite
- 26.45/100
- National rank
- #7218
- State rank
- #144 of 238 in AR
Livability — Bald Knob
- Score
- 57/100
- State rank
- #340
- US rank
- #21701
Category grades
Schools grade is shown separately in the Schools card above.
Census & demographics
- Census place
- Bald Knob, AR
- Population (ZIP)
- 5,283
Population outlook (White County) Hauer SSP2
- Today (2025)
- 82,310 people
- By 2030
- 83,861 · +1.9%
- By 2040
- 86,492 · +5.1%
- By 2050
- 88,246 · +7.2%
- By 2075
- 91,307 · +10.9%
- By 2100
- 91,548 · +11.2%
Race, ethnicity, and origin ACS 2023
- Neighborhood character
- Predominantly White (89%)
- Race & ethnicity
- White 89% Hispanic / Latino 6% Two or more races 4%
- Hispanic origin (detail)
- Mexican 6%
- Common ancestry
- Iranian 1% Italian 1% Serbian 1%
- Foreign-born
- 1% · Canada
- Languages at home
- 96% English-only · Spanish 4%
Political lean MEDSL · White
- 2024 margin
- Solid R (+61.2) · D 18.3% · R 79.5% · Other 2.2%
- 2008→2024 swing
- -14.0pp toward R · 2008: -47.2pp · 2024: -61.2pp
- All cycles
- 2024: R+61.2 2020: R+58.9 2016: R+57.9 2012: R+53.7 2008: R+47.2
Not yet ingested
- Civics
- —
Market trends
- HPI YoY
- ▲ 3.37%
- Current HPI
- 206.1058
- Rent YoY
- —
- Metro
- —
- State GDP YoY
- ▲ 3.80%
- F500 in state
- 10
Industry mix (Fortune 500 HQ in AR)
| Industry | F500 HQs | Revenue |
|---|---|---|
| Retail | 1 | $681B |
|
||
| Food / Agriculture | 1 | $53B |
|
||
| Retail / Energy | 1 | $22B |
|
||
| Transportation / Logistics | 1 | $12B |
|
||
| Energy | 1 | $4B |
|
||
Price history
+130.5% since first listed7 events — show timeline
- 2026-06-12 Listed $115,000 CARMLS
- 2016-05-17 Sold (Public Records) $45,000 Public Records
- 2016-05-16 Sold (MLS) $45,000 CARMLS
- 2016-04-21 Pending — CARMLS
- 2016-03-28 Relisted — CARMLS
- 2016-02-29 Pending — CARMLS
- 2016-02-01 Listed $49,900 CARMLS
Property tax history
+0.0%/yrLatest (2020): $318 · +0.0% YoY. Source: county tax records.
Cash-flow waterfall
monthlySold comps — $/sqft
last 12 mo · ≤1 miLoading sold comps…