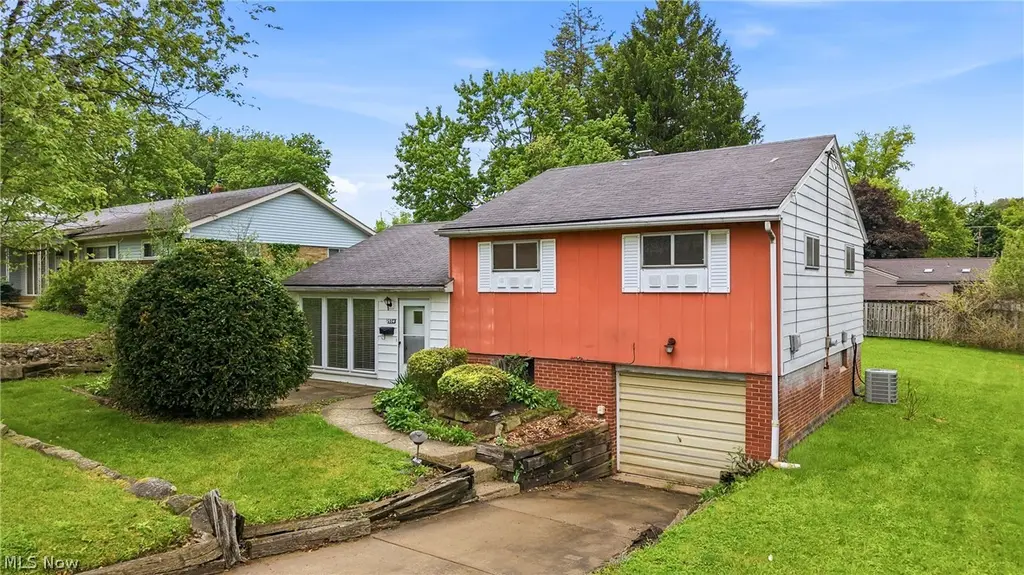
2534 Sierra Dr · Youngstown, OH
Flood risk 6/10 · Moderate
- FEMA flood zone
- X (unshaded)
- Chance of flooding over 30 yrs
- 0.74%
- Est. flood insurance / yr
- $473 – $860
Fire risk 1/10 · Minimal
- Est. fire insurance / yr
- $713 – $1,323
Heat risk 3/10 · Minor
- Hot days now (above 98°F)
- 7 days/yr
- Hot days in 30 yrs
- 18 days/yr
Wind risk 1/10 · Minimal
- Chance of severe wind over 30 yrs
- —
Air-quality risk 2/10 · Minimal
- Unhealthy air days now
- 1 days/yr
- Unhealthy air days in 30 yrs
- 2 days/yr
Risk factors via First Street. Map © Google.
Why this score? — see what drove the B grade
The composite is a weighted blend of 9 inputs, each scored 0–100. Each bar is that input's sub-score; the figure is the points it added to the 100-point composite (weight × sub-score).
- Cash flow +28.5/30.0
- ARV discount +15.0/15.0
- DSCR +10.0/10.0
- 1% rule +7.2/10.0
- Livability +4.0/5.0
- Rent growth +2.5/5.0
- Condition / age +2.5/5.0
- Schools +0.9/10.0
- Appreciation +0.0/10.0
$125,000
🖨 Deal sheet (PDF) 📄 Offer letter ✓ Due diligence
Listing remarks
Here’s your chance to own a classic mid-century gem and make it completely your own! Located on Youngstown’s West side, this charming 3-bedroom home offers over 1,500 square feet of living space filled with character, space, and endless potential. A welcoming concrete front patio sets the tone as you arrive at the home. Step inside through the slate entryway and into a spacious living room with built-ins and dining area featuring newer vinyl windows, including three dramatic floor-to-ceiling windows that flood the space with natural light. A newer sliding glass door leads effortlessly to the large screened back porch- the perfect spot for morning coffee, quiet evenings, or enter
Key facts
- Dining area
- Slate entryway
- Concrete front patio
Tags
Property features AI
Finance
- Other:
- Financial info:
- HOA & community:
Exterior
- Parking: 1-car garage; Driveway
- Security:
- Utilities: Public water; Public sewer
- Home design: Aluminum siding and brick exterior; Block foundation
- Construction: Asphalt/fiberglass roof
- Exterior features: Rear enclosed porch; Front porch; Patio
Interior
- Kitchen:
- Bedrooms: Total of 6 rooms (includes bedrooms and living spaces)
- Flooring:
- Bathrooms: 1 full bathroom
- Heating & cooling: Central air; Ceiling fan(s); Forced-air gas heating
- Interior features: Partially finished basement
- Laundry & utility: Laundry located in the basement
Neighborhood map
What this means for you Summary
Snapshot
- This is a 3-bed/1.0-bath single-family listed at $125k.
Deal economics
- At list price, monthly cash flow is $408 ($5k/yr) — positive.
- The deal already cash-flows at list — no discount required.
- Meets the 1% rule at list price ($2k rent vs $125k).
- Cap rate 10.2% vs local median 7.0% in Youngstown — top-decile yield for the area; either an underpriced asset or a hidden risk that comps aren't pricing in. Stress-test before assuming the spread holds.
Location & tenants
- Location reads 81/100 on livability (#99 in OH, #1,506 nationally) — a professional / high-income tenant draw. Strengths: amenities A+, commute A+, cost of living A+; Watch: crime F, employment F.
- Youngstown City (urban): math 8% / reading 17% proficiency, ranked #649 of 656 in OH (top 99%) — low school quality limits family demand, transient renter base, plan for 1-2y turnover; 88% free/reduced lunch — lower-income household profile, screen leases tightly.
- Market conditions: 80 active listings in the ZIP; 2 comparable units currently listed for rent nearby; 147 units permitted in Mahoning County in 2024 (0 in 5+ unit buildings).
- This rent runs 32% of the median local income ($57k/yr) — at the standard rent-burdened threshold; future hikes will face affordability resistance.
Forward outlook
- Local home prices are declining (-3.0%/yr); year-one equity from $864 of loan paydown is wiped out by about $4k of value loss. Plan a longer hold.
- Mahoning County population projected at -14% by 2050 — secular population decline; favor cash flow + early exit over multi-decade hold.
- At projected returns (-3.0% appreciation + 3.0% rent growth), your $35k cash investment doubles in ~9 years — after that, you're playing with house money.
Negotiation context
- Only 6 days on market — expect competitive offers; lowballing is unlikely to land.
Risks & watch-outs
- Watch-outs: built in 1957 — expect roof / HVAC / electrical / plumbing capex.
- Climate carrying-cost: major flood risk — expect insurance premiums to compound above CPI over the hold.
Questions for the listing agent
- Built in 1957 — when were the roof, HVAC, electrical panel, plumbing, and water heater last replaced?
- Is there a deadline driving the sale (1031 exchange, divorce, estate, relocation)? That informs how much negotiation room exists.
- Crime grade is F in this area — have there been break-ins, vandalism, or insurance claims at this property in the last 3 years? What carrier currently insures it and at what premium?
- What's the average days-on-market for RENTAL listings here right now (not sales)? A rising rental-DOM trend means longer vacancies and softer asking-rent achievability than the comps imply.
- What's the recent tenant-quality profile in this submarket — average credit score on applications, eviction rate, late-payment / NSF rate, and stable-employment percentage? A property-management company in the area should have these aggregated.
- How much new for-sale + rental construction is in the pipeline within 1–3 miles? Heavy new supply typically softens prices + rents 12–24 months out; constrained supply supports both.
Investment metrics
- 1% rule
- 1.22% ✓
- Cap rate
- 10.21%
- Cash-on-cash
- 13.98%
- DSCR
- 1.62
- GRM
- 6.8
CMA / ARV
- ARV (on-the-fly)
- $228,096
- Comps found
- 12
Show comp detail 12 sales within ~0.75 mi
| Address | Dist | Beds/Ba | Sqft | Sold | Price | $/sf | Match |
|---|---|---|---|---|---|---|---|
| 3042 Straley Ln | 0.29mi | 3/1.5 | 1,798 (+1%) | 11mo | $215,000 | $120 | 74 |
| 3928 S Schenley Ave | 0.32mi | 3/2.5 | 1,688 (-5%) | 6mo | $252,500 | $150 | 65 |
| 3206 Hermosa Dr | 0.49mi | 3/2.0 | 1,742 (-2%) | 6mo | $245,000 | $141 | 65 |
| 2243 Coleman Dr | 0.25mi | 4/2.0 (+1) | 1,684 (-6%) | 7mo | $176,500 | $105 | 65 |
| 2827 S Schenley Ave | 0.45mi | 4/1.5 (+1) | 1,817 (+2%) | 7mo | $173,000 | $95 | 63 |
| 2216 Coral Sea Dr | 0.66mi | 3/1.5 | 1,792 (+1%) | 6mo | $219,900 | $123 | 61 |
| 4096 Bob O Link Dr | 0.65mi | 4/1.5 (+1) | 1,776 (-0%) | 7mo | $285,000 | $160 | 57 |
| 4042 Baymar Dr | 0.37mi | 3/1.5 | 1,542 (-14%) | 7mo | $222,000 | $144 | 53 |
| 3911 Arden Blvd | 0.75mi | 3/2.5 | 1,678 (-6%) | 2mo | $214,800 | $128 | 48 |
| 2674 Brunswick Rd | 0.74mi | 4/1.0 (+1) | 1,900 (+7%) | 4mo | $244,000 | $128 | 46 |
| 424 Flagler Ln | 0.70mi | 3/1.0 | 1,584 (-11%) | 16mo | $140,000 | $88 | 35 |
| 4020 Shelby Rd | 0.70mi | 3/2.0 | 1,538 (-14%) | 12mo | $213,000 | $138 | 31 |
Match score weights: distance 35% · size 25% · config 20% · recency 20%. Top-matched comps best support the ARV.
Projected returns pro-forma
-3.0% appreciation · 3.0% rent growth · sell at horizon
- IRR
- 4.2%
- Equity multiple
- 1.16×
- Total profit
- $5,704
- Equity at exit
- $18,638
- IRR
- 13.7%
- Equity multiple
- 2.10×
- Total profit
- $38,346
- Equity at exit
- $10,808
Cash invested: $35,000 (down + closing). Projections, not guarantees.
Landlord ↔ Tenant lean methodology
- Overall (STATE)
- 73 Landlord-Friendly
- State Ohio
- 73 Landlord-Friendly · R+6
- County
- — inherits STATE
- City
- — inherits STATE
ZIP-level market 44511
- Home prices YoY
- -12.6%
- Active inventory
- 80
- Price-to-rent
- 6.8×
Monthly cashflow live
- Estimated rent
- $1,528 medium interval (Pro) →
- Mortgage (P&I)
- −$656
- Tax from tax record
- −$91 /mo · $1,096/yr
- Insurance
- −$52
- HOA
- −$0
- Vacancy / Maint / Mgmt
- −$321
- Net cashflow
- $408
Break-even live
Sensitivity live
| Price | -10% $479 | -5% $443 | +0% $408 | +5% $372 | +10% $337 |
|---|---|---|---|---|---|
| Rent | -10% $287 | -5% $348 | +0% $408 | +5% $468 | +10% $529 |
| Rate | -1.0pp $471 | -0.5pp $440 | base $408 | +0.5pp $375 | +1.0pp $343 |
UW: 25.0% down · 7.5% · 30yr · 1.5% tax · 5.0% vac · 8.0% maint · 8.0% mgmt
Financing live
Cash to close
- Down payment
- $31,250
- Closing costs
- $3,750
- Reserves months
- —
- Total cash needed
- —
Loan-product check · same deal, 3 products live
Conventional
25% down · 7.5% · 30yr
- Down + closing
- —
- Monthly P&I
- —
- Monthly cashflow
- —
- DSCR
- —
- Eligible?
- —
Personal DTI + credit; lowest rate.
DSCR
20% down · 8.5% · 30yr
- Down + closing
- —
- Monthly P&I
- —
- Monthly cashflow
- —
- DSCR
- —
- Eligible?
- —
No personal income docs; deal must DSCR.
Hard money
10% down · 12.0% · 12mo
- Down + closing
- —
- Monthly P&I
- —
- Monthly cashflow
- —
- DSCR
- —
- Eligible?
- —
Short-term bridge; refi at stabilization.
Rent comps 2 comps
| Address | Beds | Baths | Sqft | Rent | $/sqft | DOM | Units | Dist |
|---|---|---|---|---|---|---|---|---|
| 2529 Bainbridge Ave Youngstown, OH | 3.0 | 2.0 | 1692 | $1,500 | $0.89 | 45d | 1 | 1.30mi |
| 2433 Bainbridge Ave Youngstown, OH | 3.0 | 1.0 | 1640 | $1,500 | $0.91 | 22d | 1 | 1.39mi |
Listing history 1 events
-
2026-05-21$125,000 Active
ⓘ Source: listings_history table (triggers on properties + properties_extension) + one-shot
backfill from property_details.listing_events for pre-trigger history.
Tax reassessment forecast OH · Partial reset (capped growth)
- Current annual tax
- $1,096 · $91/mo
- Projected year-2 tax
- $1,523 · $127/mo
- Expected delta
- +$427/yr (+$36/mo · 38.9%)
ⓘ Screening estimate from a state-policy table — verify with the county assessor before closing.
Climate risk First Street
- Flood 6/10 Major FEMA zone X (unshaded) · 74% chance over 30 yrs
- Wildfire 1/10 Low
- Heat 3/10 Moderate 7 d/yr ≥98°F today · 18 d/yr by 30 yrs out
- Wind 1/10 Low
- Air quality 2/10 Low 1 unhealthy d/yr today · 2 by 30 yrs out
Nearby sold comps map
Loading sold comps map…
Walkable amenities ~0.75 mi
Loading nearby amenities…
Taxation est. · year 1
- Rental income
- $18,331
- − Mortgage interest
- −$7,002
- − Property taxes
- −$1,096
- − Insurance
- −$625
- − Repairs & maintenance
- −$1,466
- − Management
- −$1,466
- − Depreciation
- −$3,636
- Taxable income
- $3,039
- Est. tax owed @ 24.0%
- −$729
- After-tax cash flow
- $4,165/yr
For passive investors: Depreciation is non-cash, so a rental often shows a tax loss while cash-flowing — sheltering income. Rental losses are passive: they offset passive income freely, and up to $25,000/yr can offset ordinary (W-2) income if you actively participate and your MAGI is under $100k (phasing out to $0 by $150k); unused losses carry forward. On sale, claimed depreciation is recaptured at up to 25%, and gains may owe capital-gains tax (a 1031 exchange can defer both). Figures are a year-1 estimate at your 24.0% rate — not tax advice; consult a CPA.
Schools (NCES district)
- District
- Youngstown City
- NCES district ID
- 3904516
- Math proficiency
- 8% ▼ -15.00%
- Reading proficiency
- 17% ▼ -10.00%
- Median HH income
- $25,257
- Composite
- 9.29/100
- National rank
- #9858
- State rank
- #649 of 656 in OH
Livability — Youngstown
- Score
- 81/100
- State rank
- #99
- US rank
- #1506
Category grades
Schools grade is shown separately in the Schools card above.
Census & demographics
- Census place
- Youngstown, OH
- County
- Mahoning County · 84,956 people
- City population
- 28,503
- Metro
- Youngstown-Warren-Boardman, OH-PA
- Population (ZIP)
- 18,909
- Household income
- $56,880
- Rent vs Own
- Severe rent burden
- 336.0
Population outlook (Mahoning County) Hauer SSP2
- Today (2025)
- 223,932 people
- By 2030
- 218,387 · -2.5%
- By 2040
- 205,367 · -8.3%
- By 2050
- 193,606 · -13.5%
- By 2075
- 173,694 · -22.4%
- By 2100
- 151,147 · -32.5%
Race, ethnicity, and origin ACS 2023
- Neighborhood character
- Majority White (64%)
- Race & ethnicity
- White 64% Black 23% Hispanic / Latino 8% Two or more races 7% Native American 1%
- Hispanic origin (detail)
- Mexican 2% Puerto Rican 4%
- Common ancestry
- Romanian 5% Lithuanian 1% Slovak 1%
- Foreign-born
- 1% · Canada
- Languages at home
- 96% English-only · Spanish 3%
Political lean MEDSL · Mahoning
- 2024 margin
- Lean R (+9.4) · D 44.9% · R 54.4%
- 2008→2024 swing
- -36.1pp toward R · 2008: 26.6pp · 2024: -9.4pp
- All cycles
- 2024: R+9.4 2020: R+1.9 2016: D+3.0 2012: D+27.7 2008: D+26.6
Not yet ingested
- Civics
- —
Market trends
- HPI YoY
- ▼ -40.81%
- Current HPI
- 283.9088
- Rent YoY
- —
- Metro
- Youngstown-Warren-Boardman, OH-PA
- State GDP YoY
- ▲ 1.98%
- F500 in state
- 48
Industry mix (Fortune 500 HQ in OH)
| Industry | F500 HQs | Revenue |
|---|---|---|
| Insurance | 3 | $145B |
|
||
| Industrial Machinery | 3 | $49B |
|
||
| Financial Services | 3 | $24B |
|
||
| Consumer Goods | 2 | $93B |
|
||
| Aerospace / Defense | 2 | $47B |
|
||
| Utilities | 2 | $33B |
|
||
Price history
1 event — show timeline
- 2026-05-21 Listed $125,000 MLSNOW
Property tax history
+2.0%/yrLatest (2025): $1,096 · -13.0% YoY. Source: county tax records.
Cash-flow waterfall
monthlySold comps — $/sqft
last 12 mo · ≤1 miLoading sold comps…