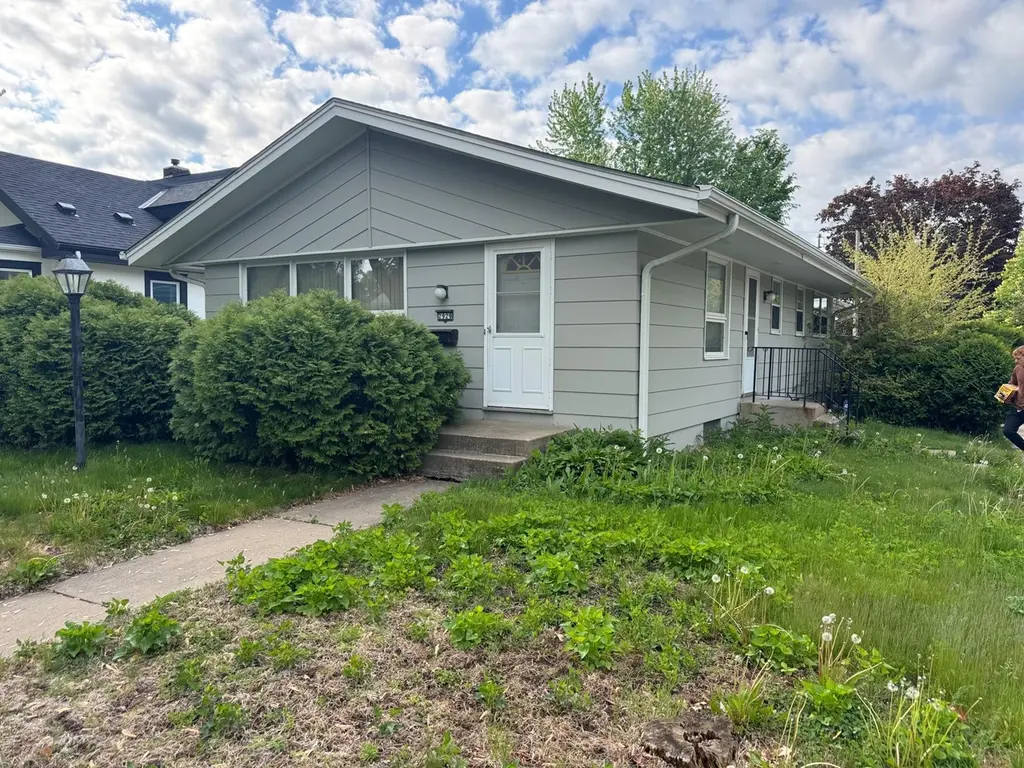
2929 18th Ave N · Minneapolis, MN
Flood risk 1/10 · Minimal
- FEMA flood zone
- X (unshaded)
- Chance of flooding over 30 yrs
- 0.0%
- Est. flood insurance / yr
- $473 – $860
Fire risk 1/10 · Minimal
- Est. fire insurance / yr
- $888 – $1,650
Heat risk 2/10 · Minimal
- Hot days now (above 99°F)
- 7 days/yr
- Hot days in 30 yrs
- 14 days/yr
Wind risk 2/10 · Minimal
- Chance of severe wind over 30 yrs
- —
Air-quality risk 2/10 · Minimal
- Unhealthy air days now
- 1 days/yr
- Unhealthy air days in 30 yrs
- 1 days/yr
Risk factors via First Street. Map © Google.
Why this score? — see what drove the D grade
The composite is a weighted blend of 9 inputs, each scored 0–100. Each bar is that input's sub-score; the figure is the points it added to the 100-point composite (weight × sub-score).
- Cash flow +13.1/30.0
- ARV discount +7.5/15.0
- Rent growth +4.3/5.0
- DSCR +3.9/10.0
- Livability +3.9/5.0
- 1% rule +3.6/10.0
- Schools +3.5/10.0
- Condition / age +2.5/5.0
- Appreciation +0.0/10.0
$225,000
🖨 Deal sheet (PDF) 📄 Offer letter ✓ Due diligence
Listing remarks
Charming one-level home built in 1970 with an attached 2-car garage, located just a few doors from beautiful Theodore Wirth Park near the corner of Xerxes Ave N and 18th Ave N. Lovingly owned by the same owner for many years, this home offers an incredible opportunity for updates and personalization. The spacious main level features 1,283 square feet with a kitchen dining area that opens to an ample living room, creating a comfortable and functional layout. Down the hall are three main-level bedrooms with hardwood floors and a full bathroom. The unfinished basement offers a large blank canvas with the potential for approximately 2,200 finished square feet total. The living room and hallway
Key facts
- 5,227 sq ft lot
- 2 garage spots
- Built 1970
Property features AI
Finance
- Other: Above-grade finished area and main level finished area approximately 1,283 square feet; Below-grade area approximately 1,283 (finished area totals shown); Total building area about 2,566
- Financial info: Property is free and clear
Exterior
- Parking: Attached 2-car garage
- Security: Security system
- Utilities: City water (connected); City sewer (connected); Electric service with circuit breakers, 100 amp; Electric fuel for some systems
- Home design: Residential property; One-level living; Entry/main level is the main floor
- Construction: Block foundation; Asphalt roof (over 8 years old)
- Exterior features: Wood exterior; Full wood fencing; City view; Lot about 0.12 acre
Interior
- Kitchen: Kitchen with window; Informal dining / kitchen-dining layout
- Bedrooms: 3 bedrooms on one level; Main-level bedroom — 16 x 12; Main-level bedroom — 13 x 12; Main-level bedroom — 11 x 11
- Bathrooms: Main-floor full bathroom (1 full bath)
- Heating & cooling: Forced-air heating; Central air conditioning
- Interior features: Natural woodwork; Security system; City view; Unfinished basement
- Laundry & utility: Washer/dryer hookup; Washer; Dryer; Gas water heater; Laundry located in basement
Neighborhood map
What this means for you Summary
Snapshot
- This is a 3-bed/1.0-bath single-family listed at $225k.
Deal economics
- At list price, monthly cash flow is $-8 ($-101/yr) — negative.
- To cash-flow at today's rent, offer at most $224k (0.7% below list).
- To meet the 1% rule (rent ≥ 1% of price), the offer needs to be $194k (13.7% below list).
- Recommended offer: $194k (13.7% below list) — sets the bar for 1% rule.
- Cap rate 6.2% vs local median 3.1% in Minneapolis — top-decile yield for the area; either an underpriced asset or a hidden risk that comps aren't pricing in. Stress-test before assuming the spread holds.
Location & tenants
- Location reads 78/100 on livability (#110 in MN, #2,525 nationally) — a middle-class / working-renter tenant base. Strengths: amenities A+, commute A+, housing A+; Watch: cost of living C-, crime F.
- Minneapolis Public School District (urban): math 35% / reading 46% proficiency, ranked #217 of 301 in MN (top 72%) — families likely to look elsewhere, expect single-tenant / working-renter base with shorter leases.
- Zoned schools: Bethune Elementary (math 2% / reading 12%, grade F, #842 of 857 statewide, top 99%, 276 students, 90% FRL); Franklin Middle (math 2% / reading 8%, grade F, #255 of 258 statewide, top 100%, 287 students, 89% FRL); Henry High (reading 70%, 858 students, 80% FRL) — zoned schools average 86% FRL vs 58% district-wide (28 pts higher); higher-poverty schools than district average — tighter screening recommended.
- Zoned-school proficiency averages 6% at this address vs 40% district-wide (-34 pts) — the specific schools serving this property underperform the Minneapolis Public School District average; the district grade overstates school quality for this exact location.
- Market conditions: Rents rising fast (+7.3%/yr); 133 active listings in the ZIP; 40 comparable units currently listed for rent nearby; rentals at typical pace (median 17d on market — plan ~3-4 weeks tenant-placement turnaround); 4,651 units permitted in Hennepin County in 2024 (2,443 in 5+ unit buildings).
- This rent runs 39% of the median local income ($60k/yr) — at the standard rent-burdened threshold; future hikes will face affordability resistance.
Forward outlook
- Local home prices are declining (-3.0%/yr); year-one equity from $2k of loan paydown is wiped out by about $7k of value loss. Plan a longer hold.
- Hennepin County population projected at +30% by 2050 — long-run rental-demand tailwind backs the buy-and-hold thesis.
Negotiation context
- Only 5 days on market — expect competitive offers; lowballing is unlikely to land.
Questions for the listing agent
- What do current leases actually rent for vs. the listed asking? Can we see a recent rent roll and the last 12 months of T-12 income?
- Built in 1970 — when were the roof, HVAC, electrical panel, plumbing, and water heater last replaced?
- Is there a deadline driving the sale (1031 exchange, divorce, estate, relocation)? That informs how much negotiation room exists.
- Crime grade is F in this area — have there been break-ins, vandalism, or insurance claims at this property in the last 3 years? What carrier currently insures it and at what premium?
- The area grade is low — what's the realistic commute time and amenity access for the typical tenant pool here? Any planned neighborhood developments (good or bad) we should know about?
- What's the average days-on-market for RENTAL listings here right now (not sales)? A rising rental-DOM trend means longer vacancies and softer asking-rent achievability than the comps imply.
- What's the recent tenant-quality profile in this submarket — average credit score on applications, eviction rate, late-payment / NSF rate, and stable-employment percentage? A property-management company in the area should have these aggregated.
- How much new for-sale + rental construction is in the pipeline within 1–3 miles? Heavy new supply typically softens prices + rents 12–24 months out; constrained supply supports both.
Investment metrics
- 1% rule
- 0.86% ✗
- Cap rate
- 6.25%
- Cash-on-cash
- -0.16%
- DSCR
- 0.99
- GRM
- 9.7
CMA / ARV
No comps found within radius.
Projected returns pro-forma
-3.0% appreciation · 7.35% rent growth · sell at horizon
- IRR
- -11.8%
- Equity multiple
- 0.55×
- Total profit
- $-28,096
- Equity at exit
- $33,548
- IRR
- 2.7%
- Equity multiple
- 1.23×
- Total profit
- $14,783
- Equity at exit
- $19,454
Cash invested: $63,000 (down + closing). Projections, not guarantees.
Landlord ↔ Tenant lean methodology
- Overall (CITY)
- 34 Tenant-Leaning
- State Minnesota
- 46 Balanced · D+2
- County
- — inherits STATE
- City Minneapolis
- 34 Tenant-Leaning · D+50
ZIP-level market 55411
- Home prices YoY
- -8.7%
- Rents YoY
- 7.3%
- Active inventory
- 133
- Price-to-rent
- 9.7×
Monthly cashflow live
- Estimated rent
- $1,943 high interval (Pro) →
- Mortgage (P&I)
- −$1,180
- Tax from tax record
- −$269 /mo · $3,234/yr
- Insurance
- −$94
- HOA
- −$0
- Vacancy / Maint / Mgmt
- −$408
- Net cashflow
- $-8
Break-even live
Sensitivity live
| Price | -10% $119 | -5% $55 | +0% $-8 | +5% $-72 | +10% $-136 |
|---|---|---|---|---|---|
| Rent | -10% $-162 | -5% $-85 | +0% $-8 | +5% $68 | +10% $145 |
| Rate | -1.0pp $105 | -0.5pp $49 | base $-8 | +0.5pp $-67 | +1.0pp $-126 |
UW: 25.0% down · 7.5% · 30yr · 1.5% tax · 5.0% vac · 8.0% maint · 8.0% mgmt
Financing live
Cash to close
- Down payment
- $56,250
- Closing costs
- $6,750
- Reserves months
- —
- Total cash needed
- —
Loan-product check · same deal, 3 products live
Conventional
25% down · 7.5% · 30yr
- Down + closing
- —
- Monthly P&I
- —
- Monthly cashflow
- —
- DSCR
- —
- Eligible?
- —
Personal DTI + credit; lowest rate.
DSCR
20% down · 8.5% · 30yr
- Down + closing
- —
- Monthly P&I
- —
- Monthly cashflow
- —
- DSCR
- —
- Eligible?
- —
No personal income docs; deal must DSCR.
Hard money
10% down · 12.0% · 12mo
- Down + closing
- —
- Monthly P&I
- —
- Monthly cashflow
- —
- DSCR
- —
- Eligible?
- —
Short-term bridge; refi at stabilization.
Rent comps 40 comps
| Address | Beds | Baths | Sqft | Rent | $/sqft | DOM | Units | Dist |
|---|---|---|---|---|---|---|---|---|
| 1816 Zephyr Pl Minneapolis, MN | 3.0 | 1.0 | 1120 | $2,050 | $1.83 | 45d | 1 | 0.15mi |
| 2411 Golden Valley Rd Unit 2 Minneapolis, MN | 4.0 | 2.0 | 1200 | $2,395 | $2.00 | 16d | 1 | 0.33mi |
| 1649 Russell Ave N Unit 2 Minneapolis, MN | 3.0 | 1.0 | 1011 | $1,700 | $1.68 | 22d | 1 | 0.35mi |
| 1649 Russell Ave N Unit 2 Minneapolis, MN | 3.0 | 1.0 | 1011 | $1,650 | $1.63 | 0d | 1 | 0.35mi |
| 2211 Queen Ave N Unit 1 Minneapolis, MN | 3.0 | 1.0 | 983 | $1,695 | $1.72 | 19d | 1 | 0.48mi |
| 2356 N Thomas Ave Unit 2 Minneapolis, MN | 3.0 | 1.0 | 1000 | $1,800 | $1.80 | 45d | 1 | 0.49mi |
| 1239 Sheridan Ave N Minneapolis, MN | 1.0–2.0 | 1.0 | 795 | $1,250 | $1.57 | 6d | 4 | 0.54mi |
| 2419 Plymouth Ave N Minneapolis, MN | 2.0–3.0 | 1.0 | 836 | $1,795 | $2.15 | 6d | 2 | 0.55mi |
| 1255 Queen Ave N Minneapolis, MN | 1.0–2.0 | 1.0 | 633 | $1,419 | $2.24 | 5d | 4 | 0.62mi |
| 1507 N Newton Ave Unit 2 Minneapolis, MN | 4.0 | 1.0 | 1068 | $1,499 | $1.40 | 45d | 1 | 0.64mi |
| 2323 26th Ave N Minneapolis, MN | 2.0 | 1.0 | 807 | $1,717 | $2.13 | 16d | 3 | 0.64mi |
| 2000 W Broadway Ave Minneapolis, MN | 2.0 | 1.0 | 952 | $1,350 | $1.42 | 9d | 4 | 0.67mi |
| 2324 Logan Ave N Minneapolis, MN | 4.0 | 1.5 | 1400 | $2,300 | $1.64 | 46d | 1 | 0.75mi |
| 2600 France Ave N Unit 2600 Minneapolis, MN | 2.0 | 1.5 | 1100 | $1,599 | $1.45 | 6d | 1 | 0.77mi |
| 1429 Knox Ave N Unit 1429 Minneapolis, MN | 4.0 | 1.0 | 1260 | $1,995 | $1.58 | 45d | 1 | 0.82mi |
| 816 Queen Ave N Minneapolis, MN | 3.0 | 1.0 | 1200 | $1,895 | $1.58 | 45d | 1 | 0.88mi |
| 1016 N Newton Ave Unit 4 Minneapolis, MN | 3.0 | 1.0 | 1009 | $1,895 | $1.88 | 45d | 1 | 0.90mi |
| 1237 Knox Ave N Unit 1237 Minneapolis, MN | 3.0 | 1.0 | 1196 | $1,900 | $1.59 | 6d | 1 | 0.91mi |
| 1523 22nd Ave N Minneapolis, MN | 3.0 | 1.0 | 943 | $1,695 | $1.80 | 16d | 1 | 0.91mi |
| 1510 N 22nd Ave #1 Minneapolis, MN | 3.0 | 1.0 | 1500 | $1,875 | $1.25 | 23d | 1 | 0.93mi |
| 1510 N 22nd Ave #1 Minneapolis, MN | 3.0 | 1.0 | 1500 | $1,875 | $1.25 | 6d | 1 | 0.93mi |
| 1030 Knox Ave N Apt 2 Minneapolis, MN | 4.0 | 1.0 | 900 | $2,099 | $2.33 | 45d | 1 | 1.04mi |
| 1407 N Girard Ave Unit 2 Minneapolis, MN | 2.0 | 1.0 | 1472 | $1,900 | $1.29 | 19d | 1 | 1.05mi |
| 2947 Morgan Ave N Minneapolis, MN | 2.0 | 1.0 | 1106 | $1,950 | $1.76 | 1d | 1 | 1.11mi |
| 2947 Morgan Ave N Minneapolis, MN | 2.0 | 1.0 | 1106 | $1,950 | $1.76 | 16d | 1 | 1.11mi |
| 519 Penn Ave N Minneapolis, MN | 4.0 | 2.0 | 1500 | $2,195 | $1.46 | 9d | 1 | 1.12mi |
| 519 Penn Ave N Minneapolis, MN | 4.0 | 2.0 | 1500 | $2,195 | $1.46 | 16d | 1 | 1.12mi |
| 519 Penn Ave N Minneapolis, MN | 4.0 | 2.0 | 1500 | $2,195 | $1.46 | 0d | 1 | 1.12mi |
| 2124 Fremont Ave N Minneapolis, MN | 2.0 | 1.0 | 1050 | $1,580 | $1.50 | 4d | 1 | 1.13mi |
| 2703 Humboldt Ave N Minneapolis, MN | 3.0 | 1.0 | 1218 | $1,450 | $1.19 | 23d | 1 | 1.18mi |
| 3114 Morgan Ave N Minneapolis, MN | 4.0 | 2.0 | 1362 | $2,000 | $1.47 | 16d | 1 | 1.22mi |
| 2226 Glenwood Ave Unit 1 Minneapolis, MN | 3.0 | 1.0 | 1100 | $1,399 | $1.27 | 1d | 1 | 1.25mi |
| 2212 Glenwood Ave Unit 1 Minneapolis, MN | 2.0 | 1.0 | 950 | $1,299 | $1.37 | 45d | 1 | 1.26mi |
| 2620 Emerson Ave N Minneapolis, MN | 3.0 | 1.0 | 877 | $1,900 | $2.17 | 1d | 1 | 1.32mi |
| 1901 4th Ave N Minneapolis, MN | 3.0 | 2.0 | 1300 | $1,300 | $1.00 | 26d | 1 | 1.32mi |
| 835 W Broadway Ave Minneapolis, MN | 1.0–2.0 | 1.0–2.0 | 849 | $2,150 | $2.53 | 5d | 7 | 1.34mi |
| 3255 N Logan Ave Unit 2 Minneapolis, MN | 2.0 | 1.0 | 900 | $995 | $1.11 | 19d | 1 | 1.36mi |
| 3105 N Girard Ave Unit 2 Minneapolis, MN | 4.0 | 1.0 | 1250 | $2,300 | $1.84 | 26d | 1 | 1.43mi |
| 1611 Glenwood Ave #1 Minneapolis, MN | 3.0 | 2.0 | 918 | $1,945 | $2.12 | 1d | 1 | 1.45mi |
| 3315 James Ave N Minneapolis, MN | 4.0 | 1.0 | 1400 | $2,100 | $1.50 | 6d | 1 | 1.47mi |
Listing history 6 events
-
2026-06-04status $225,000 Pending 5 DOM
-
2026-06-03days on market $225,000 Active 5 DOM
-
2026-06-02days on market $225,000 Active 4 DOM
-
2026-06-01days on market $225,000 Active 3 DOM
-
2026-05-31days on market $225,000 Active 2 DOM
-
2026-05-28historical $225,000
ⓘ Source: listings_history table (triggers on properties + properties_extension) + one-shot
backfill from property_details.listing_events for pre-trigger history.
Tax reassessment forecast MN · Partial reset (capped growth)
- Current annual tax
- $3,234 · $269/mo
- Projected year-2 tax
- $3,234 · $269/mo
- Expected delta
- $0/yr ($0/mo · 0.0%)
ⓘ Screening estimate from a state-policy table — verify with the county assessor before closing.
Climate risk First Street
- Flood 1/10 Low FEMA zone X (unshaded) · 0% chance over 30 yrs
- Wildfire 1/10 Low
- Heat 2/10 Low 7 d/yr ≥99°F today · 14 d/yr by 30 yrs out
- Wind 2/10 Low
- Air quality 2/10 Low 1 unhealthy d/yr today · 1 by 30 yrs out
Nearby sold comps map
Loading sold comps map…
Walkable amenities ~0.75 mi
Loading nearby amenities…
Taxation est. · year 1
- Rental income
- $23,313
- − Mortgage interest
- −$12,603
- − Property taxes
- −$3,234
- − Insurance
- −$1,125
- − Repairs & maintenance
- −$1,865
- − Management
- −$1,865
- − Depreciation
- −$6,545
- Taxable loss
- −$3,925
- Est. tax savings @ 24.0%
- +$942
- After-tax cash flow
- $841/yr
For passive investors: Depreciation is non-cash, so a rental often shows a tax loss while cash-flowing — sheltering income. Rental losses are passive: they offset passive income freely, and up to $25,000/yr can offset ordinary (W-2) income if you actively participate and your MAGI is under $100k (phasing out to $0 by $150k); unused losses carry forward. On sale, claimed depreciation is recaptured at up to 25%, and gains may owe capital-gains tax (a 1031 exchange can defer both). Figures are a year-1 estimate at your 24.0% rate — not tax advice; consult a CPA.
Schools (NCES district)
- District
- Minneapolis Public School District
- NCES district ID
- 2721240
- Math proficiency
- 35% ▼ -7.00%
- Reading proficiency
- 46% ▼ -1.00%
- Median HH income
- $50,521
- Composite
- 34.92/100
- National rank
- #5067
- State rank
- #217 of 301 in MN
Livability — Minneapolis
- Score
- 78/100
- State rank
- #110
- US rank
- #2525
Category grades
Schools grade is shown separately in the Schools card above.
Census & demographics
- Census place
- Minneapolis, MN
- County
- Hennepin County · 1,150,272 people
- City population
- 417,555
- Metro
- Minneapolis-St. Paul-Bloomington, MN-WI
- Population (ZIP)
- 27,741
- Household income
- $60,225
- Rent vs Own
- Severe rent burden
- 1826.0
Population outlook (Hennepin County) Hauer SSP2
- Today (2025)
- 1,405,227 people
- By 2030
- 1,492,650 · +6.2%
- By 2040
- 1,660,157 · +18.1%
- By 2050
- 1,823,498 · +29.8%
- By 2075
- 2,221,283 · +58.1%
- By 2100
- 2,509,976 · +78.6%
Race, ethnicity, and origin ACS 2023
- Neighborhood character
- Diverse neighborhood (Simpson 0.68)
- Race & ethnicity
- Black 49% White 23% Two or more races 11% Hispanic / Latino 11% Asian 9%
- Hispanic origin (detail)
- Mexican 7% Puerto Rican 1%
- Common ancestry
- Portuguese 3% Lithuanian 2% Italian 1%
- Foreign-born
- 19% · Canada, Guatemala
- Languages at home
- 68% English-only · Other Asian/Pacific 8% Spanish 8%
Political lean MEDSL · Hennepin
- 2024 margin
- Solid D (+42.6) · D 70.2% · R 27.5% · Other 2.3%
- 2008→2024 swing
- +14.0pp toward D · 2008: 28.6pp · 2024: 42.6pp
- All cycles
- 2024: D+42.6 2020: D+43.2 2016: D+35.3 2012: D+27.1 2008: D+28.6
Not yet ingested
- Civics
- —
Market trends
- HPI YoY
- ▼ -33.91%
- Current HPI
- 356.6758
- Rent YoY
- ▲ 7.35%
- Metro
- Minneapolis-St. Paul-Bloomington, MN-WI
- State GDP YoY
- ▲ 2.41%
- F500 in state
- 34
Industry mix (Fortune 500 HQ in MN)
| Industry | F500 HQs | Revenue |
|---|---|---|
| Healthcare | 2 | $407B |
|
||
| Retail | 2 | $150B |
|
||
| Consumer Goods | 2 | $32B |
|
||
| Industrial Machinery | 2 | $6B |
|
||
| Agriculture | 1 | $40B |
|
||
| Healthcare / Medical Devices | 1 | $32B |
|
||
Price history
1 event — show timeline
- 2026-05-28 Coming Soon $225,000 NORTHSTARMLS as Distributed by MLS Grid
Property tax history
+7.3%/yrLatest (2025): $3,234 · +6.0% YoY. Source: county tax records.
Cash-flow waterfall
monthlySold comps — $/sqft
last 12 mo · ≤1 miLoading sold comps…