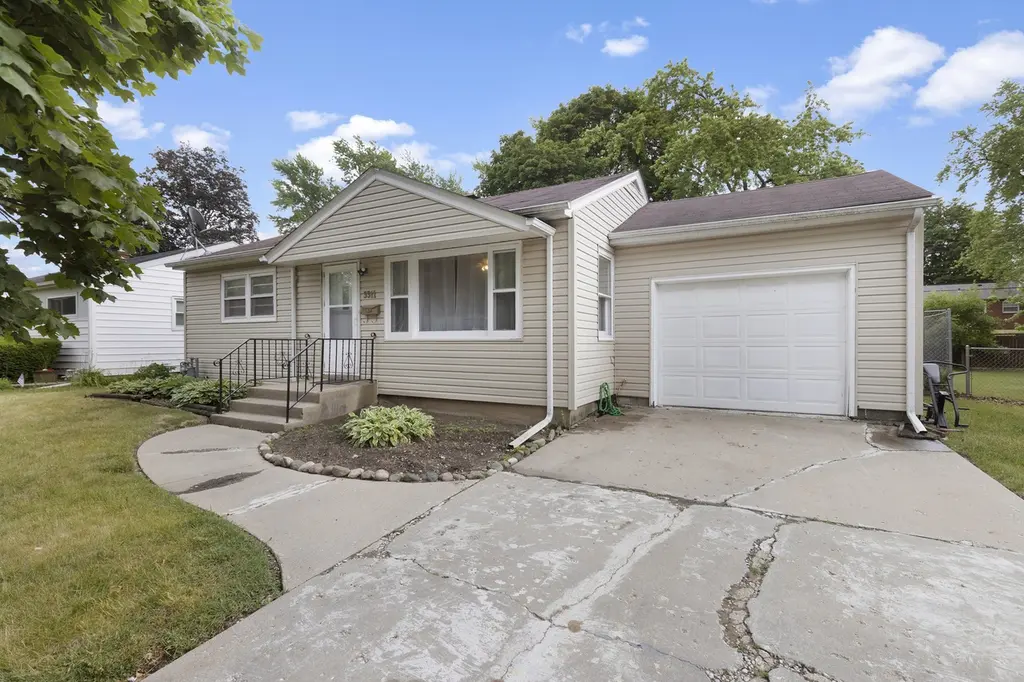
3311 Constance Dr · Rockford, IL
Flood risk 1/10 · Minimal
- FEMA flood zone
- X (unshaded)
- Chance of flooding over 30 yrs
- 0.0%
- Est. flood insurance / yr
- $473 – $860
Fire risk 1/10 · Minimal
- Est. fire insurance / yr
- $804 – $1,492
Heat risk 2/10 · Minimal
- Hot days now (above 101°F)
- 7 days/yr
- Hot days in 30 yrs
- 15 days/yr
Wind risk 2/10 · Minimal
- Chance of severe wind over 30 yrs
- —
Air-quality risk 2/10 · Minimal
- Unhealthy air days now
- 1 days/yr
- Unhealthy air days in 30 yrs
- 2 days/yr
Risk factors via First Street. Map © Google.
Why this score? — see what drove the D+ grade
The composite is a weighted blend of 9 inputs, each scored 0–100. Each bar is that input's sub-score; the figure is the points it added to the 100-point composite (weight × sub-score).
- ARV discount +15.0/15.0
- Cash flow +13.9/30.0
- Rent growth +4.5/5.0
- 1% rule +4.3/10.0
- DSCR +4.2/10.0
- Livability +3.1/5.0
- Condition / age +2.5/5.0
- Schools +1.2/10.0
- Appreciation +0.0/10.0
$144,900
🖨 Deal sheet 📄 Offer letter ✓ Due diligence
Listing remarks MLS
Charming 1-bedroom, 1-bath home featuring a 1-car garage, spacious yard, and full basement for added storage or flexible living space. Enjoy a large outdoor area perfect for entertaining, gardening, or relaxing. The basement offers endless possibilities for a recreation room, home office, workout area, or additional storage. A great opportunity for first-time buyers, downsizers, or investors alike!
Key facts
- Spacious yard
- Recreation room
- Workout area
Tags
Property features AI
Exterior
- Parking: Attached 1-car garage
- Utilities: Public water; Public sewer
- Home design: Single-family residence (house); Residential property
- Exterior features: Shingle roof; Public water; Public sewer
Interior
- Kitchen: Gas cooktop; Refrigerator
- Bathrooms: 1 full bathroom (main level)
- Heating & cooling: Forced air heating (natural gas); Central air conditioning
- Interior features: Gas cooktop; Refrigerator; Gas water heater; Full basement
Neighborhood map
What this means for you Summary
Snapshot
- This is a 2-bed/1.0-bath single-family listed at $145k.
Deal economics
- At list price, monthly cash flow is $16 ($192/yr) — positive.
- The deal already cash-flows at list — no discount required.
- To meet the 1% rule (rent ≥ 1% of price), the offer needs to be $135k (6.6% below list).
- Recommended offer: $135k (6.6% below list) — sets the bar for 1% rule.
Location & tenants
- Location reads 62/100 on livability (#876 in IL) — a middle-class / working-renter tenant base. Strengths: cost of living A+, housing A+, health & safety A+; Watch: schools F, crime F, amenities F.
- Rockford SD 205 (urban): math 12% / reading 16% proficiency, ranked #533 of 620 in IL (top 86%) — low school quality limits family demand, transient renter base, plan for 1-2y turnover; 73% free/reduced lunch — lower-income household profile, screen leases tightly.
- Market conditions: Rents rising fast (+8.1%/yr); 114 active listings in the ZIP; 6 comparable units currently listed for rent nearby; rentals at typical pace (median 21d on market — plan ~3-4 weeks tenant-placement turnaround); 285 units permitted in Winnebago County in 2024 (0 in 5+ unit buildings).
Forward outlook
- Local home prices are declining (-3.0%/yr); year-one equity from $1k of loan paydown is wiped out by about $4k of value loss. Plan a longer hold.
- Winnebago County population projected at -20% by 2050 — secular population decline; favor cash flow + early exit over multi-decade hold.
Negotiation context
- Only 7 days on market — expect competitive offers; lowballing is unlikely to land.
- 2 sale attempts with the ask held roughly flat each time — persistent listings suggest the price (not the market) is what's stuck; bring a comps-based counter.
- Current owner paid $80k; list at $145k implies a 81% gain — meaningful room to come down on a strong offer.
Risks & watch-outs
- Watch-outs: built in 1958 — expect roof / HVAC / electrical / plumbing capex.
Questions for the listing agent
- Built in 1958 — when were the roof, HVAC, electrical panel, plumbing, and water heater last replaced?
- Is there a deadline driving the sale (1031 exchange, divorce, estate, relocation)? That informs how much negotiation room exists.
- Schools are F-rated, which usually means shorter tenancies and higher turnover. Who's the typical renter profile here, and what's been the actual vacancy rate?
- Crime grade is F in this area — have there been break-ins, vandalism, or insurance claims at this property in the last 3 years? What carrier currently insures it and at what premium?
- The area grade is low — what's the realistic commute time and amenity access for the typical tenant pool here? Any planned neighborhood developments (good or bad) we should know about?
- What's the average days-on-market for RENTAL listings here right now (not sales)? A rising rental-DOM trend means longer vacancies and softer asking-rent achievability than the comps imply.
- What's the recent tenant-quality profile in this submarket — average credit score on applications, eviction rate, late-payment / NSF rate, and stable-employment percentage? A property-management company in the area should have these aggregated.
- How much new for-sale + rental construction is in the pipeline within 1–3 miles? Heavy new supply typically softens prices + rents 12–24 months out; constrained supply supports both.
Investment metrics
- 1% rule
- 0.93% ✗
- Cap rate
- 6.43%
- Cash-on-cash
- 0.47%
- DSCR
- 1.02
- GRM
- 8.9
CMA / ARV
- ARV (on-the-fly)
- $176,757
- Comps found
- 12
Show comp detail 12 sales within ~0.75 mi
| Address | Dist | Beds/Ba | Sqft | Sold | Price | $/sf | Match |
|---|---|---|---|---|---|---|---|
| 3713 Connecticut Dr | 0.39mi | 3/1.0 (+1) | 1,320 (-1%) | 6mo | $185,000 | $140 | 71 |
| 2029 24th St | 0.63mi | 2/1.0 | 1,320 (-1%) | 6mo | $150,000 | $114 | 64 |
| 2019 Montana Ave | 0.43mi | 3/1.0 (+1) | 1,244 (-6%) | 2mo | $179,000 | $144 | 63 |
| 3519 Thelma St | 0.25mi | 3/1.5 (+1) | 1,198 (-10%) | 3mo | $175,000 | $146 | 62 |
| 4120 Yale Dr | 0.61mi | 3/1.0 (+1) | 1,295 (-3%) | 0mo | $165,500 | $128 | 62 |
| 2111 23rd St | 0.66mi | 3/1.0 (+1) | 1,320 (-1%) | 2mo | $145,730 | $110 | 61 |
| 2215 Colorado Ave | 0.41mi | 3/1.0 (+1) | 1,420 (+7%) | 4mo | $185,000 | $130 | 61 |
| 2212 Colorado Ave | 0.44mi | 3/1.0 (+1) | 1,233 (-7%) | 2mo | $160,000 | $130 | 61 |
| 2330 Colorado Ave | 0.33mi | 3/2.0 (+1) | 1,176 (-12%) | 4mo | $156,000 | $133 | 54 |
| 2015 Oregon Ave | 0.57mi | 3/1.0 (+1) | 1,249 (-6%) | 6mo | $165,000 | $132 | 53 |
| 2025 24th St | 0.63mi | 2/1.0 | 1,164 (-12%) | 3mo | $170,000 | $146 | 47 |
| 2818 Carol Pl | 0.74mi | 3/2.0 (+1) | 1,256 (-6%) | 2mo | $250,000 | $199 | 46 |
Match score weights: distance 35% · size 25% · config 20% · recency 20%. Top-matched comps best support the ARV.
Projected returns pro-forma
-3.0% appreciation · 8.0% rent growth · sell at horizon
- IRR
- -9.8%
- Equity multiple
- 0.62×
- Total profit
- $-15,250
- Equity at exit
- $21,605
- IRR
- 5.6%
- Equity multiple
- 1.51×
- Total profit
- $20,817
- Equity at exit
- $12,528
Cash invested: $40,572 (down + closing). Projections, not guarantees.
Landlord ↔ Tenant lean methodology
- Overall (STATE)
- 43 Moderately Tenant-Leaning
- State Illinois
- 43 Moderately Tenant-Leaning · D+7
- County
- — inherits STATE
- City
- — inherits STATE
ZIP-level market 61108
- Home prices YoY
- -29.2%
- Rents YoY
- 8.1%
- Active inventory
- 114
- Price-to-rent
- 8.9×
Monthly cashflow live
- Estimated rent
- $1,354 high interval (Pro) →
- Mortgage (P&I)
- −$760
- Tax from tax record
- −$233 /mo · $2,800/yr
- Insurance
- −$60
- HOA
- −$0
- Vacancy / Maint / Mgmt
- −$284
- Net cashflow
- $16
Break-even live
UW: 25.0% down · 7.5% · 30yr · 1.5% tax · 5.0% vac · 8.0% maint · 8.0% mgmt
Financing live
Cash to close
- Down payment
- $36,225
- Closing costs
- $4,347
- Reserves months
- —
- Total cash needed
- —
Loan-product check · same deal, 3 products live
Conventional
25% down · 7.5% · 30yr
- Down + closing
- —
- Monthly P&I
- —
- Monthly cashflow
- —
- DSCR
- —
- Eligible?
- —
Personal DTI + credit; lowest rate.
DSCR
20% down · 8.5% · 30yr
- Down + closing
- —
- Monthly P&I
- —
- Monthly cashflow
- —
- DSCR
- —
- Eligible?
- —
No personal income docs; deal must DSCR.
Hard money
10% down · 12.0% · 12mo
- Down + closing
- —
- Monthly P&I
- —
- Monthly cashflow
- —
- DSCR
- —
- Eligible?
- —
Short-term bridge; refi at stabilization.
Rent comps 6 comps
| Address | Beds | Baths | Sqft | Rent | $/sqft | DOM | Units | Dist |
|---|---|---|---|---|---|---|---|---|
| 2723 Silent Wood Trl Unit 2735-7 Rockford, IL | 3.0 | 1.5 | 1050 | $1,310 | $1.25 | 20d | 1 | 0.43mi |
| 3902 15th Ave Unit 3902-7 Rockford, IL | 2.0 | 1.0 | 900 | $1,375 | $1.53 | 20d | 1 | 1.07mi |
| 4960 Hinsdale Ave Rockford, IL | 2.0 | 1.0 | 900 | $1,100 | $1.22 | 43d | 1 | 1.29mi |
| 4960 Hinsdale Ave Unit 8 8 Rockford, IL | 2.0 | 1.5 | 900 | $1,100 | $1.22 | 43d | 1 | 1.29mi |
| 708 29th St Rockford, IL | 3.0 | 2.0 | 1800 | $1,600 | $0.89 | 20d | 1 | 1.35mi |
| 1202 18th St Unit 3 Rockford, IL | 3.0 | 1.0 | 1500 | $1,700 | $1.13 | 13d | 1 | 1.36mi |
Listing history 7 events
-
2026-06-19days on market $144,900 Active 7 DOM
-
2026-06-18days on market $144,900 Active 6 DOM
-
2026-06-17days on market $144,900 Active 5 DOM
-
2026-06-16days on market $144,900 Active 4 DOM
-
2026-06-15days on market $144,900 Active 3 DOM
-
2026-06-13remarks 401-char remark
-
2026-06-13$144,900 Active 1 DOM
ⓘ Source: listings_history table (triggers on properties + properties_extension) + one-shot
backfill from property_details.listing_events for pre-trigger history.
Tax reassessment forecast IL · Partial reset (capped growth)
- Current annual tax
- $2,800 · $233/mo
- Projected year-2 tax
- $3,045 · $254/mo
- Expected delta
- +$244/yr (+$20/mo · 8.7%)
ⓘ Screening estimate from a state-policy table — verify with the county assessor before closing.
Climate risk First Street
- Flood 1/10 Low FEMA zone X (unshaded) · 0% chance over 30 yrs
- Wildfire 1/10 Low
- Heat 2/10 Low 7 d/yr ≥101°F today · 15 d/yr by 30 yrs out
- Wind 2/10 Low
- Air quality 2/10 Low 1 unhealthy d/yr today · 2 by 30 yrs out
Nearby sold comps map
Loading sold comps map…
Walkable amenities ~0.75 mi
Loading nearby amenities…
Taxation est. · year 1
- Rental income
- $16,248
- − Mortgage interest
- −$8,117
- − Property taxes
- −$2,800
- − Insurance
- −$724
- − Repairs & maintenance
- −$1,300
- − Management
- −$1,300
- − Depreciation
- −$4,215
- Taxable loss
- −$2,209
- Est. tax savings @ 24.0%
- +$530
- After-tax cash flow
- $723/yr
For passive investors: Depreciation is non-cash, so a rental often shows a tax loss while cash-flowing — sheltering income. Rental losses are passive: they offset passive income freely, and up to $25,000/yr can offset ordinary (W-2) income if you actively participate and your MAGI is under $100k (phasing out to $0 by $150k); unused losses carry forward. On sale, claimed depreciation is recaptured at up to 25%, and gains may owe capital-gains tax (a 1031 exchange can defer both). Figures are a year-1 estimate at your 24.0% rate — not tax advice; consult a CPA.
Schools (NCES district)
- District
- Rockford SD 205
- NCES district ID
- 1734510
- Math proficiency
- 12% ▼ -2.00%
- Reading proficiency
- 16% ▼ -3.00%
- Median HH income
- $42,533
- Composite
- 12.21/100
- National rank
- #9649
- State rank
- #533 of 620 in IL
Livability — Rockford
- Score
- 62/100
- State rank
- #876
- US rank
- #17035
Category grades
Schools grade is shown separately in the Schools card above.
Census & demographics
- Census place
- Rockford, IL
- County
- Winnebago County · 147,297 people
- City population
- 147,297
- Metro
- Rockford, IL
- Population (ZIP)
- 30,355
- Household income
- $64,415
- Rent vs Own
- Severe rent burden
- 1199.0
Population outlook (Winnebago County) Hauer SSP2
- Today (2025)
- 271,080 people
- By 2030
- 260,684 · -3.8%
- By 2040
- 238,405 · -12.1%
- By 2050
- 216,129 · -20.3%
- By 2075
- 172,882 · -36.2%
- By 2100
- 135,336 · -50.1%
Race, ethnicity, and origin ACS 2023
- Neighborhood character
- Diverse neighborhood (Simpson 0.60)
- Race & ethnicity
- White 57% Hispanic / Latino 24% Black 11% Two or more races 10% Asian 5%
- Hispanic origin (detail)
- Mexican 18% Puerto Rican 2%
- Common ancestry
- Romanian 3% Portuguese 3% Arab 2%
- Foreign-born
- 15% · Canada, Philippines, China
- Languages at home
- 75% English-only · Spanish 16% Arabic 3% Other Asian/Pacific 2%
Political lean MEDSL · Winnebago
- 2024 margin
- Toss-up / Even · D 49.5% · R 49.0% · Other 1.5%
- 2008→2024 swing
- -12.2pp toward R · 2008: 12.8pp · 2024: 0.6pp
- All cycles
- 2024: D+0.6 2020: D+2.5 2016: R+1.2 2012: D+5.7 2008: D+12.8
Not yet ingested
- Civics
- —
Market trends
- HPI YoY
- ▼ -90.38%
- Current HPI
- 218.6339
- Rent YoY
- ▲ 8.11%
- Metro
- Rockford, IL
- State GDP YoY
- ▲ 1.59%
- F500 in state
- 60
Industry mix (Fortune 500 HQ in IL)
| Industry | F500 HQs | Revenue |
|---|---|---|
| Insurance | 4 | $201B |
|
||
| Consumer Goods | 4 | $87B |
|
||
| Industrial Machinery | 3 | $64B |
|
||
| Healthcare | 2 | $55B |
|
||
| Retail / Pharmacy | 1 | $148B |
|
||
| Agriculture / Food | 1 | $86B |
|
||
Price history
+149.8% since first listed6 events — show timeline
- 2026-06-12 Listed $144,900 NWIAR
- 2026-06-12 Listed $144,900 MRED as Distributed by MLS Grid
- 2002-12-04 Sold (Public Records) $80,000 Public Records
- 2001-08-23 Sold (Public Records) $70,000 Public Records
- 1994-07-18 Sold (Public Records) $58,000 Public Records
- 1994-07-18 Sold (Public Records) $58,000 Public Records
Property tax history
+0.6%/yrLatest (2025): $2,800 · +6.1% YoY. Source: county tax records.
Cash-flow waterfall
monthlySold comps — $/sqft
last 12 mo · ≤1 miLoading sold comps…