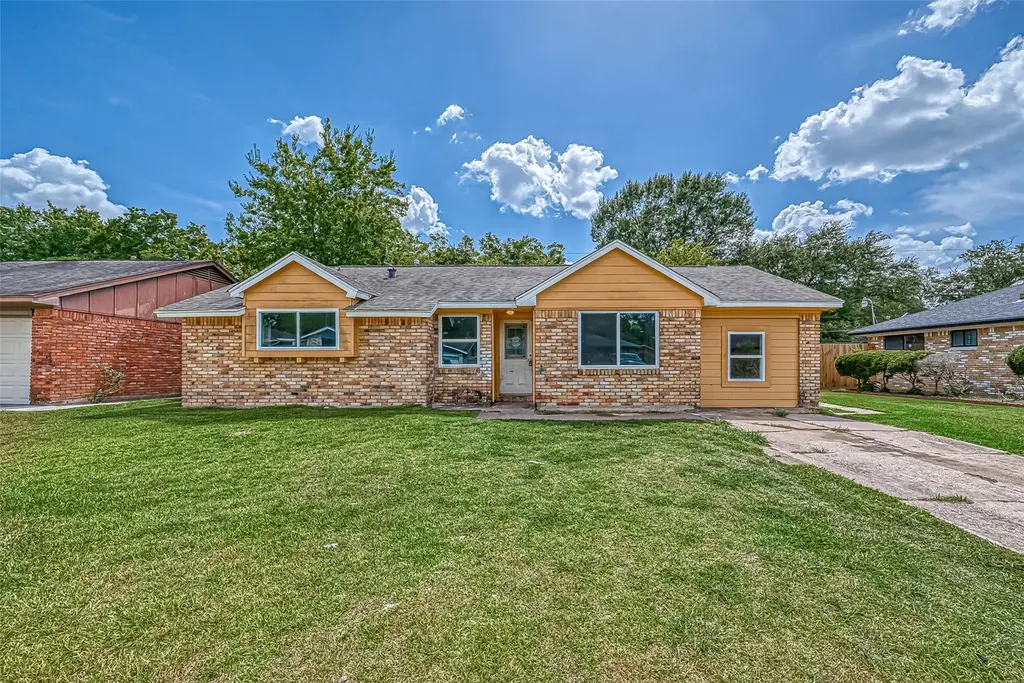
5606 Elm Springs Dr · Houston, TX
Flood risk 5/10 · Moderate
- FEMA flood zone
- X (shaded)
- Chance of flooding over 30 yrs
- 0.24%
- Est. flood insurance / yr
- $507 – $1,088
Fire risk 1/10 · Minimal
- Est. fire insurance / yr
- $1,222 – $2,270
Heat risk 9/10 · Severe
- Hot days now (above 108°F)
- 7 days/yr
- Hot days in 30 yrs
- 24 days/yr
Wind risk 9/10 · Severe
- Chance of severe wind over 30 yrs
- 99.0%
Air-quality risk 2/10 · Minimal
- Unhealthy air days now
- 1 days/yr
- Unhealthy air days in 30 yrs
- 2 days/yr
Risk factors via First Street. Map © Google.
Why this score? — see what drove the C- grade
The composite is a weighted blend of 9 inputs, each scored 0–100. Each bar is that input's sub-score; the figure is the points it added to the 100-point composite (weight × sub-score).
- Cash flow +17.2/30.0
- ARV discount +6.8/15.0
- Appreciation +6.3/10.0
- DSCR +5.4/10.0
- 1% rule +5.0/10.0
- Livability +3.7/5.0
- Rent growth +2.8/5.0
- Schools +2.7/10.0
- Condition / age +2.5/5.0
$215,000
🖨 Deal sheet 📄 Offer letter ✓ Due diligence
Listing remarks
Located in the growing South Houston area, 5606 Elm Springs Dr, Houston, TX 77048 offers a strong opportunity for both investors and first-time home buyers. Conveniently situated near Highway 288, Loop 610, Beltway 8, and I-45, the property provides easy access to Downtown Houston, the Texas Medical Center, NRG Stadium, and the University of Houston, making commuting throughout the city simple and efficient. The surrounding area continues to experience steady growth and redevelopment, with increasing demand for affordable housing and rental properties. This home would make an excellent income-producing rental investment due to its central location and accessibility to major employment hubs,
Key facts
- 6,438 sq ft lot
- Built 1961
- Listed 33 days
Tags
Property features AI
Finance
- Financial info: Lease not considered
Exterior
- Utilities: Public water; Public sewer
- Home design: Residential property; Built in 1961; Slab foundation
- Construction: Composition roof; Construction materials: Unknown
- Exterior features: Subdivision lot
Interior
- Bathrooms: 2 full bathrooms
- Heating & cooling: Central heating (electric and gas); Central air conditioning (electric and gas)
- Interior features: 5 total rooms
Neighborhood map
What this means for you Summary
Snapshot
- This is a 5-bed/2.0-bath single-family listed at $215k.
Deal economics
- At list price, monthly cash flow is $155 ($2k/yr) — positive.
- The deal already cash-flows at list — no discount required.
- To meet the 1% rule (rent ≥ 1% of price), the offer needs to be $215k (0.1% below list).
- Recommended offer: $209k (3.0% below list) — sets the bar for market timing.
- Cap rate 7.2% vs local median 3.2% in Houston — top-decile yield for the area; either an underpriced asset or a hidden risk that comps aren't pricing in. Stress-test before assuming the spread holds.
Location & tenants
- Location reads 74/100 on livability (#184 in TX, #4,771 nationally) — a middle-class / working-renter tenant base. Strengths: amenities A+, cost of living A+, housing A+; Watch: crime F.
- Houston ISD (urban): math 27% / reading 35% proficiency, ranked #593 of 826 in TX (top 72%) — families likely to look elsewhere, expect single-tenant / working-renter base with shorter leases; 71% free/reduced lunch — lower-income household profile, screen leases tightly.
- Zoned schools: Thomas Middle (math 3% / reading 13%, grade F, #1,654 of 1,662 statewide, top 100%, 526 students, 98% FRL); Sterling H S (math 16% / reading 27%, grade F, #1,377 of 1,632 statewide, top 85%, 1,421 students, 92% FRL) — zoned schools average 95% FRL vs 71% district-wide (24 pts higher); higher-poverty schools than district average — tighter screening recommended.
- Zoned-school proficiency averages 15% at this address vs 31% district-wide (-16 pts) — the specific schools serving this property underperform the Houston ISD average; the district grade overstates school quality for this exact location.
- Market conditions: Rents rising (+1.2%/yr); 303 active listings in the ZIP; 3 comparable units currently listed for rent nearby; rentals at typical pace (median 15d on market — plan ~3-4 weeks tenant-placement turnaround); 29,883 units permitted in Harris County in 2024 (8,621 in 5+ unit buildings).
Forward outlook
- In year one you build about $7k of equity ($1k loan paydown + $6k appreciation (2.6% local appreciation)).
- Harris County population projected at +47% by 2050 — long-run rental-demand tailwind backs the buy-and-hold thesis.
- At projected returns (2.6% appreciation + 1.2% rent growth), your $60k cash investment doubles in ~7 years — after that, you're playing with house money.
- By year 5, paydown + projected appreciation supports a ~$31k cash-out refi (75% LTV) — recoverable capital for the next deal without selling this one.
Negotiation context
- It's been on market 34 days — a 3% lower offer ($209k) is reasonable based on typical stale-listing flexibility.
- 9 sale attempts since 9y ago with the ask held roughly flat each time — persistent listings suggest the price (not the market) is what's stuck; bring a comps-based counter.
Risks & watch-outs
- Climate carrying-cost: moderate flood risk; severe wind risk, 99% chance of damaging wind over 30y; extreme-heat days projected 7→24/yr by 2055 (HVAC capex compounding) — expect insurance premiums to compound above CPI over the hold.
Questions for the listing agent
- It's been on market 34 days. Have you received any prior offers? Is the seller open to a 3% concession, seller financing, or rate buy-down credit?
- Built in 1961 — when were the roof, HVAC, electrical panel, plumbing, and water heater last replaced?
- Is there a deadline driving the sale (1031 exchange, divorce, estate, relocation)? That informs how much negotiation room exists.
- Schools are D-rated, which usually means shorter tenancies and higher turnover. Who's the typical renter profile here, and what's been the actual vacancy rate?
- Crime grade is F in this area — have there been break-ins, vandalism, or insurance claims at this property in the last 3 years? What carrier currently insures it and at what premium?
- What's the average days-on-market for RENTAL listings here right now (not sales)? A rising rental-DOM trend means longer vacancies and softer asking-rent achievability than the comps imply.
- What's the recent tenant-quality profile in this submarket — average credit score on applications, eviction rate, late-payment / NSF rate, and stable-employment percentage? A property-management company in the area should have these aggregated.
- How much new for-sale + rental construction is in the pipeline within 1–3 miles? Heavy new supply typically softens prices + rents 12–24 months out; constrained supply supports both.
Investment metrics
- 1% rule
- 1.00% ✗
- Cap rate
- 7.16%
- Cash-on-cash
- 3.09%
- DSCR
- 1.14
- GRM
- 8.3
CMA / ARV
- ARV (median comp)
- $211,524
- List price
- $215,000
- Delta
- 1.64%
- Verdict
- FAIR
- Comps
- 20 within 1.0 mi
Show comp detail 7 sales within ~0.75 mi
| Address | Dist | Beds/Ba | Sqft | Sold | Price | $/sf | Match |
|---|---|---|---|---|---|---|---|
| 5315 Greylog Dr | 0.36mi | 4/2.0 (-1) | 1,201 (-5%) | 18mo | $180,000 | $150 | 55 |
| 5746 Lakefield Dr | 0.59mi | 4/2.0 (-1) | 1,313 (+4%) | 8mo | $165,000 | $126 | 54 |
| 5762 Lakefield Dr | 0.60mi | 4/2.0 (-1) | 1,218 (-4%) | 18mo | $175,000 | $144 | 46 |
| 5126 Denoron Court Ct | 0.71mi | 4/2.0 (-1) | 1,301 (+3%) | 14mo | $140,000 | $108 | 45 |
| 5527 Lakefield Dr | 0.66mi | 4/2.5 (-1) | 1,400 (+11%) | 2mo | $240,000 | $171 | 43 |
| 5747 Groveton St | 0.67mi | 4/2.0 (-1) | 1,216 (-4%) | 21mo | $195,000 | $160 | 40 |
| 9310 St Lo Rd | 0.70mi | 4/2.0 (-1) | 1,099 (-13%) | 13mo | $169,000 | $154 | 29 |
Match score weights: distance 35% · size 25% · config 20% · recency 20%. Top-matched comps best support the ARV.
Projected returns pro-forma
2.61% appreciation · 1.17% rent growth · sell at horizon
- IRR
- 8.3%
- Equity multiple
- 1.46×
- Total profit
- $27,571
- Equity at exit
- $92,008
- IRR
- 10.1%
- Equity multiple
- 2.41×
- Total profit
- $85,061
- Equity at exit
- $138,270
Cash invested: $60,200 (down + closing). Projections, not guarantees.
Landlord ↔ Tenant lean methodology
- Overall (STATE)
- 87 Strongly Landlord-Friendly
- State Texas
- 87 Strongly Landlord-Friendly · R+5
- County
- — inherits STATE
- City
- — inherits STATE
ZIP-level market 77048
- Home prices YoY
- 1.0%
- Rents YoY
- 1.2%
- Active inventory
- 303
- Price-to-rent
- 8.3×
Monthly cashflow live
- Estimated rent
- $2,147 medium interval (Pro) →
- Mortgage (P&I)
- −$1,127
- Tax from tax record
- −$324 /mo · $3,892/yr
- Insurance
- −$90
- HOA
- −$0
- Vacancy / Maint / Mgmt
- −$451
- Net cashflow
- $155
Break-even live
UW: 25.0% down · 7.5% · 30yr · 1.5% tax · 5.0% vac · 8.0% maint · 8.0% mgmt
Financing live
Cash to close
- Down payment
- $53,750
- Closing costs
- $6,450
- Reserves months
- —
- Total cash needed
- —
Loan-product check · same deal, 3 products live
Conventional
25% down · 7.5% · 30yr
- Down + closing
- —
- Monthly P&I
- —
- Monthly cashflow
- —
- DSCR
- —
- Eligible?
- —
Personal DTI + credit; lowest rate.
DSCR
20% down · 8.5% · 30yr
- Down + closing
- —
- Monthly P&I
- —
- Monthly cashflow
- —
- DSCR
- —
- Eligible?
- —
No personal income docs; deal must DSCR.
Hard money
10% down · 12.0% · 12mo
- Down + closing
- —
- Monthly P&I
- —
- Monthly cashflow
- —
- DSCR
- —
- Eligible?
- —
Short-term bridge; refi at stabilization.
Rent comps 3 comps
| Address | Beds | Baths | Sqft | Rent | $/sqft | DOM | Units | Dist |
|---|---|---|---|---|---|---|---|---|
| 5425 E Orem Dr Houston, TX | 1.0–4.0 | 1.0–2.0 | 1040 | $1,661 | $1.60 | 4d | 13 | 0.93mi |
| 9509 Merle St Unit 9509A Houston, TX | 4.0 | 2.5 | 1404 | $1,500 | $1.07 | 43d | 1 | 1.00mi |
| 6505 Wide Meadow Dr Houston, TX | 3.0–4.0 | 2.0–2.5 | 1696 | $2,695 | $1.59 | 15d | 1 | 1.30mi |
Listing history 35 events
-
2026-06-18days on market $215,000 Active 34 DOM
-
2026-06-17days on market $215,000 Active 33 DOM
-
2026-06-16days on market $215,000 Active 32 DOM
-
2026-06-15days on market $215,000 Active 31 DOM
-
2026-06-13days on market $215,000 Active 29 DOM
-
2026-06-10days on market $215,000 Active 25 DOM
-
2026-06-08days on market $215,000 Active 24 DOM
-
2026-06-07days on market $215,000 Active 23 DOM
-
2026-06-04days on market $215,000 Active 20 DOM
-
2026-06-01days on market $215,000 Active 17 DOM
-
2026-05-31days on market $215,000 Active 16 DOM
-
2026-05-15$215,000 Active 975-char remark
-
2024-07-24historical
-
2024-07-05historical $1,800
-
2024-06-25$1,800
-
2024-06-25historical $1,800
-
2024-06-20price $1,800
-
2024-06-19$195,000 Active
-
2024-06-19historical
-
2024-06-06$1,850
-
2024-06-05historical $1,850
-
2024-05-21$205,000 Active
-
2024-05-01$1,850
-
2024-05-01historical $1,870
-
2024-04-03$1,870
-
2020-12-28soldstatus
-
2020-12-25soldstatus Sold
-
2020-12-12status Pending
-
2020-11-19$120,000 Active
-
2017-09-05soldstatus
-
2017-08-25soldstatus Sold
-
2017-07-28status Pending
-
2017-07-11status Option Pending
-
2017-06-05$80,000 Active
-
1988-01-02soldstatus
ⓘ Source: listings_history table (triggers on properties + properties_extension) + one-shot
backfill from property_details.listing_events for pre-trigger history.
Tax reassessment forecast TX · Resets to sale price
- Current annual tax
- $3,892 · $324/mo
- Projected year-2 tax
- $3,934 · $328/mo
- Expected delta
- +$42/yr (+$4/mo · 1.1%)
ⓘ Screening estimate from a state-policy table — verify with the county assessor before closing.
Climate risk First Street
- Flood 5/10 Major FEMA zone X (shaded) · 24% chance over 30 yrs
- Wildfire 1/10 Low
- Heat 9/10 Extreme 7 d/yr ≥108°F today · 24 d/yr by 30 yrs out
- Wind 9/10 Extreme 99% chance of damaging wind over 30 yrs
- Air quality 2/10 Low 1 unhealthy d/yr today · 2 by 30 yrs out
Nearby sold comps map
Loading sold comps map…
Walkable amenities ~0.75 mi
Loading nearby amenities…
Taxation est. · year 1
- Rental income
- $25,769
- − Mortgage interest
- −$12,043
- − Property taxes
- −$3,892
- − Insurance
- −$1,075
- − Repairs & maintenance
- −$2,062
- − Management
- −$2,062
- − Depreciation
- −$6,255
- Taxable loss
- −$1,619
- Est. tax savings @ 24.0%
- +$389
- After-tax cash flow
- $2,249/yr
For passive investors: Depreciation is non-cash, so a rental often shows a tax loss while cash-flowing — sheltering income. Rental losses are passive: they offset passive income freely, and up to $25,000/yr can offset ordinary (W-2) income if you actively participate and your MAGI is under $100k (phasing out to $0 by $150k); unused losses carry forward. On sale, claimed depreciation is recaptured at up to 25%, and gains may owe capital-gains tax (a 1031 exchange can defer both). Figures are a year-1 estimate at your 24.0% rate — not tax advice; consult a CPA.
Schools (NCES district)
- District
- Houston ISD
- NCES district ID
- 4823640
- Math proficiency
- 27% ▼ -18.00%
- Reading proficiency
- 35% ▼ -6.00%
- Median HH income
- $46,054
- Composite
- 26.63/100
- National rank
- #7173
- State rank
- #593 of 826 in TX
Livability — Houston
- Score
- 74/100
- State rank
- #184
- US rank
- #4771
Category grades
Schools grade is shown separately in the Schools card above.
Census & demographics
- Census place
- Houston, TX
- County
- Harris County · 4,702,590 people
- City population
- 3,226,434
- Metro
- Houston-The Woodlands-Sugar Land, TX
- Population (ZIP)
- 21,151
- Household income
- $56,747
- Rent vs Own
- Severe rent burden
- 1117.0
Population outlook (Harris County) Hauer SSP2
- Today (2025)
- 5,571,493 people
- By 2030
- 6,089,821 · +9.3%
- By 2040
- 7,142,806 · +28.2%
- By 2050
- 8,185,864 · +46.9%
- By 2075
- 10,574,329 · +89.8%
- By 2100
- 12,109,958 · +117.4%
Race, ethnicity, and origin ACS 2023
- Neighborhood character
- Predominantly Black (69%)
- Race & ethnicity
- Black 69% Hispanic / Latino 24% Two or more races 6% Asian 3% White 2%
- Hispanic origin (detail)
- Mexican 17% Puerto Rican 1%
- Foreign-born
- 12% · Canada, Vietnam
- Languages at home
- 76% English-only · Spanish 20% Tagalog/Filipino 2% Vietnamese 1%
Political lean MEDSL · Harris
- 2024 margin
- Lean D (+5.5) · D 52.0% · R 46.4% · Other 1.6%
- 2008→2024 swing
- +3.9pp toward D · 2008: 1.6pp · 2024: 5.5pp
- All cycles
- 2024: D+5.5 2020: D+13.3 2016: D+12.4 2012: D+0.1 2008: D+1.6
Not yet ingested
- Civics
- —
Market trends
- HPI YoY
- ▲ 2.61%
- Current HPI
- 266.4468
- Rent YoY
- ▲ 1.17%
- Metro
- Houston-The Woodlands-Sugar Land, TX
- State GDP YoY
- ▲ 3.95%
- F500 in state
- 110
Industry mix (Fortune 500 HQ in TX)
| Industry | F500 HQs | Revenue |
|---|---|---|
| Energy | 16 | $1,198B |
|
||
| Technology | 5 | $198B |
|
||
| Engineering / Construction | 4 | $72B |
|
||
| Energy Services | 3 | $60B |
|
||
| Utilities | 3 | $41B |
|
||
| Healthcare | 2 | $330B |
|
||
Price history
+168.8% since first listed24 events — show timeline
- 2026-05-15 Listed $215,000 HARMLS
- 2024-07-24 Listing Removed — HARMLS
- 2024-07-05 Rental Removed $1,800 HARMLS
- 2024-06-25 Listed for Rent $1,800 HARMLS
- 2024-06-25 Rental Removed $1,800 HARMLS
- 2024-06-20 Price Changed $1,800 HARMLS
- 2024-06-19 Listing Removed — HARMLS
- 2024-06-19 Listed $195,000 HARMLS
- 2024-06-06 Listed for Rent $1,850 HARMLS
- 2024-06-05 Rental Removed $1,850 HARMLS
- 2024-05-21 Listed $205,000 HARMLS
- 2024-05-01 Listed for Rent $1,850 HARMLS
- 2024-05-01 Rental Removed $1,870 HARMLS
- 2024-04-03 Listed for Rent $1,870 HARMLS
- 2020-12-28 Sold (Public Records) — Public Records
- 2020-12-25 Sold (MLS) — HARMLS
- 2020-12-12 Pending — HARMLS
- 2020-11-19 Listed $120,000 HARMLS
- 2017-09-05 Sold (Public Records) — Public Records
- 2017-08-25 Sold (MLS) — HARMLS
- 2017-07-28 Pending — HARMLS
- 2017-07-11 Pending — HARMLS
- 2017-06-05 Listed $80,000 HARMLS
- 1988-01-02 Sold (Public Records) — Public Records
Property tax history
+10.3%/yrLatest (2025): $3,892 · +4.7% YoY. Source: county tax records.
Cash-flow waterfall
monthlySold comps — $/sqft
last 12 mo · ≤1 miLoading sold comps…