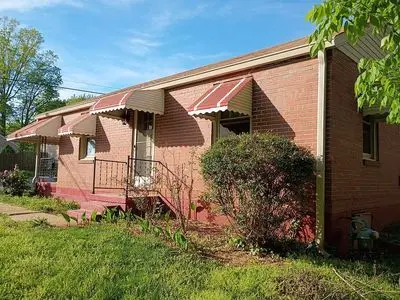
151 Breckenbridge St · Lynchburg, VA
Flood risk 7/10 · Major
- FEMA flood zone
- X (unshaded)
- Chance of flooding over 30 yrs
- 0.99%
- Est. flood insurance / yr
- $507 – $1,088
Fire risk 2/10 · Minimal
- Est. fire insurance / yr
- $666 – $1,236
Heat risk 6/10 · Moderate
- Hot days now (above 102°F)
- 7 days/yr
- Hot days in 30 yrs
- 18 days/yr
Wind risk 2/10 · Minimal
- Chance of severe wind over 30 yrs
- 3.0%
Air-quality risk 2/10 · Minimal
- Unhealthy air days now
- 0 days/yr
- Unhealthy air days in 30 yrs
- 1 days/yr
Risk factors via First Street. Map © Google.
Why this score? — see what drove the B grade
The composite is a weighted blend of 9 inputs, each scored 0–100. Each bar is that input's sub-score; the figure is the points it added to the 100-point composite (weight × sub-score).
- Cash flow +27.1/30.0
- ARV discount +15.0/15.0
- DSCR +9.4/10.0
- 1% rule +6.7/10.0
- Livability +4.5/5.0
- Schools +4.0/10.0
- Rent growth +2.8/5.0
- Condition / age +2.5/5.0
- Appreciation +0.0/10.0
$99,999
🖨 Deal sheet (PDF) 📄 Offer letter ✓ Due diligence
Listing remarks
Calling all investors, flippers, and savvy buyers! This 2-bedroom, 1-bath home offers a fantastic opportunity to add value with a little TLC. Situated on a slab foundation, this property features convenient one-level living and plenty of potential for renovation and customization. Its prime location near several colleges, universities, and major medical facilities makes it an attractive option for long-term rental income, student housing, traveling healthcare professionals, or a starter home for an owner-occupant willing to put in some work. With strong demand for housing in the area, this property presents an excellent opportunity to build equity and generate future returns. Whether you're
Key facts
- Slab foundation
- One-level living
- Prime location
Tags
Property features AI
Exterior
- Home design: Built in 1952
- Construction: Living area approximately 835
- Exterior features: Located in the Lynchburg College subdivision
Neighborhood map
What this means for you Summary
Snapshot
- This is a 2-bed/1.0-bath single-family listed at $100k.
Deal economics
- At list price, monthly cash flow is $218 ($3k/yr) — positive.
- The deal already cash-flows at list — no discount required.
- Meets the 1% rule at list price ($1k rent vs $100k).
- Cap rate 9.7% vs local median 4.0% in Lynchburg — top-decile yield for the area; either an underpriced asset or a hidden risk that comps aren't pricing in. Stress-test before assuming the spread holds.
Location & tenants
- Location reads 91/100 on livability (#1 in VA, #58 nationally) — a professional / high-income tenant draw. Strengths: amenities A+, commute A+, cost of living A+; Watch: crime C-, employment D+.
- Lynchburg City Public School District (urban): math 36% / reading 61% proficiency, ranked #104 of 131 in VA (top 79%) — families likely to look elsewhere, expect single-tenant / working-renter base with shorter leases; 61% free/reduced lunch — lower-income household profile, screen leases tightly.
- Market conditions: Rents rising (+1.1%/yr); 216 active listings in the ZIP; 27 comparable units currently listed for rent nearby; rentals at typical pace (median 22d on market — plan ~3-4 weeks tenant-placement turnaround); 41% of comp listings sitting > 30 days — soft ceiling on asking rent; lower-income renter base — watch delinquency; 472 units permitted in Lynchburg city in 2024 (240 in 5+ unit buildings).
- This rent runs 33% of the median local income ($42k/yr) — at the standard rent-burdened threshold; future hikes will face affordability resistance.
Forward outlook
- Local home prices are declining (-3.0%/yr); year-one equity from $691 of loan paydown is wiped out by about $3k of value loss. Plan a longer hold.
- Lynchburg County population projected at +37% by 2050 — long-run rental-demand tailwind backs the buy-and-hold thesis.
Negotiation context
- Only 1 days on market — expect competitive offers; lowballing is unlikely to land.
- Current owner paid $72k; 38% above their basis — modest negotiation headroom, anchor on the comps not their cost.
Risks & watch-outs
- Watch-outs: flood insurance adds $66/mo; built in 1952 — expect roof / HVAC / electrical / plumbing capex.
- Climate carrying-cost: major flood risk; extreme-heat days projected 7→18/yr by 2055 (HVAC capex compounding) — expect insurance premiums to compound above CPI over the hold.
Questions for the listing agent
- Built in 1952 — when were the roof, HVAC, electrical panel, plumbing, and water heater last replaced?
- What's the actual annual flood-insurance premium (NFIP or private), and is the property in a SFHA with mandatory coverage?
- Is there a deadline driving the sale (1031 exchange, divorce, estate, relocation)? That informs how much negotiation room exists.
- Schools are A-rated — typically a magnet for longer-tenancy family renters. What's the average tenant stay here, and is there a school-zone premium baked into asking?
- What's the average days-on-market for RENTAL listings here right now (not sales)? A rising rental-DOM trend means longer vacancies and softer asking-rent achievability than the comps imply.
- What's the recent tenant-quality profile in this submarket — average credit score on applications, eviction rate, late-payment / NSF rate, and stable-employment percentage? A property-management company in the area should have these aggregated.
- How much new for-sale + rental construction is in the pipeline within 1–3 miles? Heavy new supply typically softens prices + rents 12–24 months out; constrained supply supports both.
Investment metrics
- 1% rule
- 1.17% ✓
- Cap rate
- 9.70%
- Cash-on-cash
- 12.18%
- DSCR
- 1.54
- GRM
- 7.1
CMA / ARV
- ARV (on-the-fly)
- $167,835
- Comps found
- 12
Show comp detail 12 sales within ~0.75 mi
| Address | Dist | Beds/Ba | Sqft | Sold | Price | $/sf | Match |
|---|---|---|---|---|---|---|---|
| 209 College Dr | 0.06mi | 3/1.0 (+1) | 853 (+2%) | 3mo | $154,900 | $182 | 86 |
| 3400 College Dr | 0.11mi | 2/1.0 | 802 (-4%) | 6mo | $169,900 | $212 | 83 |
| 623 Hood St | 0.20mi | 2/1.0 | 775 (-7%) | 9mo | $143,000 | $185 | 71 |
| 3211 Richmond St | 0.25mi | 2/1.0 | 755 (-10%) | 2mo | $179,900 | $238 | 70 |
| 490 Oakley Ave | 0.40mi | 2/1.0 | 896 (+7%) | 7mo | $155,000 | $173 | 64 |
| 1200 Brandon Rd | 0.69mi | 2/1.0 | 846 (+1%) | 6mo | $169,900 | $201 | 61 |
| 3508 Joel St | 0.52mi | 2/1.0 | 786 (-6%) | 8mo | $190,000 | $242 | 59 |
| 411 Newberne St | 0.39mi | 2/2.0 | 927 (+11%) | 2mo | $200,000 | $216 | 57 |
| 612 Thomas Rd | 0.60mi | 2/1.0 | 742 (-11%) | 2mo | $105,000 | $142 | 52 |
| 1012 N Grand Ave | 0.69mi | 2/1.0 | 884 (+6%) | 8mo | $149,900 | $170 | 52 |
| 718 Kenbridge Rd | 0.73mi | 2/1.0 | 742 (-11%) | 3mo | $176,696 | $238 | 45 |
| 701 Mansfield Ave | 0.67mi | 3/2.0 (+1) | 910 (+9%) | 5mo | $182,000 | $200 | 40 |
Match score weights: distance 35% · size 25% · config 20% · recency 20%. Top-matched comps best support the ARV.
Projected returns pro-forma
-3.0% appreciation · 1.15% rent growth · sell at horizon
- IRR
- -4.3%
- Equity multiple
- 0.84×
- Total profit
- $-4,445
- Equity at exit
- $14,910
- IRR
- 3.1%
- Equity multiple
- 1.20×
- Total profit
- $5,639
- Equity at exit
- $8,646
Cash invested: $28,000 (down + closing). Projections, not guarantees.
Landlord ↔ Tenant lean methodology
- Overall (STATE)
- 55 Moderately Landlord-Leaning
- State Virginia
- 55 Moderately Landlord-Leaning · D+2
- County
- — inherits STATE
- City
- — inherits STATE
ZIP-level market 24501
- Rents YoY
- 1.1%
- Active inventory
- 216
- Price-to-rent
- 7.1×
Monthly cashflow live
- Estimated rent
- $1,172 high interval (Pro) →
- Mortgage (P&I)
- −$524
- Tax from tax record
- −$75 /mo · $906/yr
- Insurance
- −$42
- Flood insurance flood zone
- −$66 /mo · $798/yr
- HOA
- −$0
- Vacancy / Maint / Mgmt
- −$246
- Net cashflow
- $218
Break-even live
Sensitivity live
| Price | -10% $274 | -5% $246 | +0% $218 | +5% $190 | +10% $161 |
|---|---|---|---|---|---|
| Rent | -10% $125 | -5% $172 | +0% $218 | +5% $264 | +10% $310 |
| Rate | -1.0pp $268 | -0.5pp $243 | base $218 | +0.5pp $192 | +1.0pp $166 |
UW: 25.0% down · 7.5% · 30yr · 1.5% tax · 5.0% vac · 8.0% maint · 8.0% mgmt
Financing live
Cash to close
- Down payment
- $25,000
- Closing costs
- $3,000
- Reserves months
- —
- Total cash needed
- —
Loan-product check · same deal, 3 products live
Conventional
25% down · 7.5% · 30yr
- Down + closing
- —
- Monthly P&I
- —
- Monthly cashflow
- —
- DSCR
- —
- Eligible?
- —
Personal DTI + credit; lowest rate.
DSCR
20% down · 8.5% · 30yr
- Down + closing
- —
- Monthly P&I
- —
- Monthly cashflow
- —
- DSCR
- —
- Eligible?
- —
No personal income docs; deal must DSCR.
Hard money
10% down · 12.0% · 12mo
- Down + closing
- —
- Monthly P&I
- —
- Monthly cashflow
- —
- DSCR
- —
- Eligible?
- —
Short-term bridge; refi at stabilization.
Rent comps 27 comps
| Address | Beds | Baths | Sqft | Rent | $/sqft | DOM | Units | Dist |
|---|---|---|---|---|---|---|---|---|
| 202 Macon St Lynchburg, VA | 2.0 | 1.0 | 645 | $1,195 | $1.85 | 44d | 1 | 0.12mi |
| 540 Monticello Ave Unit B Lynchburg, VA | 2.0 | 1.0 | 900 | $995 | $1.11 | 21d | 1 | 0.26mi |
| 106 Yeardley Ave Unit B Lynchburg, VA | 3.0 | 1.0 | 1060 | $895 | $0.84 | 21d | 1 | 0.54mi |
| 1218 Shirley Rd Lynchburg, VA | 2.0 | 1.0 | 742 | $950 | $1.28 | 21d | 1 | 0.62mi |
| 803 Mansfield Ave Lynchburg, VA | 2.0 | 1.0 | 900 | $1,300 | $1.44 | 21d | 1 | 0.69mi |
| 216 Kenyon St Lynchburg, VA | 2.0 | 1.0 | 1114 | $995 | $0.89 | 44d | 1 | 0.74mi |
| 2121 Langhorne Rd Unit 1103756SF 1BR/1BA Lynchburg, VA | 1.0 | 1.0 | 756 | $1,225 | $1.62 | 21d | 1 | 0.75mi |
| 2121 Langhorne Rd Unit 11041092SF 2BR/2BA Lynchburg, VA | 2.0 | 2.0 | 1092 | $1,495 | $1.37 | 21d | 1 | 0.75mi |
| 2245 Landover Pl Lynchburg, VA | 1.0–3.0 | 1.0–1.5 | 925 | $870 | $0.94 | 44d | 2 | 0.77mi |
| 2121 Langhorne Rd Lynchburg, VA | 1.0 | 1.0 | 983 | $1,475 | $1.50 | 44d | 1 | 0.78mi |
| 905 Centerdale St Lynchburg, VA | 2.0 | 1.0 | 780 | $895 | $1.15 | 14d | 1 | 0.86mi |
| 318 Wadsworth St Lynchburg, VA | 3.0 | 1.0 | 943 | $995 | $1.06 | 21d | 1 | 0.89mi |
| 317 Grove St Unit A Lynchburg, VA | 2.0 | 1.0 | 900 | $895 | $0.99 | 44d | 1 | 0.91mi |
| 2734 Fort Ave Lynchburg, VA | 1.0–2.0 | 1.0–2.0 | 875 | $1,450 | $1.66 | 44d | 1 | 0.96mi |
| 4067 Fort Ave Unit 3 Lynchburg, VA | 2.0 | 1.0 | 950 | $995 | $1.05 | 21d | 1 | 0.98mi |
| 4300 Tremont St Lynchburg, VA | 3.0 | 1.0 | 1122 | $1,200 | $1.07 | 44d | 1 | 1.02mi |
| 4647 Ferncliff Dr Lynchburg, VA | 2.0 | 2.0 | 1034 | $1,800 | $1.74 | 44d | 1 | 1.02mi |
| 2107 Park Ave Unit 4 Lynchburg, VA | 2.0 | 1.0 | 800 | $785 | $0.98 | 14d | 1 | 1.03mi |
| 2021 Rose Ln Lynchburg, VA | 2.0 | 1.0 | 836 | $1,095 | $1.31 | 21d | 1 | 1.07mi |
| 4607 Fairmont Ave Lynchburg, VA | 3.0 | 1.0 | 1001 | $1,650 | $1.65 | 21d | 1 | 1.07mi |
| 1625 Shaffer St Lynchburg, VA | 2.0 | 1.0 | 895 | $850 | $0.95 | 44d | 1 | 1.19mi |
| 1320 Saint Cloud Ave Lynchburg, VA | 3.0 | 1.0 | 960 | $1,550 | $1.61 | 45d | 1 | 1.19mi |
| 1400 Weeping Willow Dr Apt A Lynchburg, VA | 1.0–3.0 | 1.0–2.0 | 1003 | $1,286 | $1.28 | 14d | 12 | 1.22mi |
| 1705 1st St Unit A Lynchburg, VA | 2.0 | 1.0 | 1100 | $1,395 | $1.27 | 21d | 1 | 1.25mi |
| 2336 Aragon St Lynchburg, VA | 2.0 | 1.0 | 1042 | $995 | $0.95 | 14d | 1 | 1.31mi |
| 1401 Kemper St Lynchburg, VA | 2.0–3.0 | 2.0 | 1118 | $707 | $0.63 | 21d | 6 | 1.42mi |
| 1009 Lindsay St Lynchburg, VA | 3.0 | 2.0 | 1050 | $1,800 | $1.71 | 44d | 1 | 1.43mi |
Listing history 15 events
-
2026-06-13remarks 699-char remark
-
2026-06-13pricestatusdays on market $99,999 Pending 1 DOM
-
2026-06-10days on market $147,000 Active 15 DOM
-
2026-06-09days on market $147,000 Active 14 DOM
-
2026-06-08days on market $147,000 Active 13 DOM
-
2026-06-07days on market $147,000 Active 12 DOM
-
2026-06-03days on market $147,000 Active 8 DOM
-
2026-06-02days on market $147,000 Active 7 DOM
-
2026-06-01days on market $147,000 Active 6 DOM
-
2026-05-31days on market $147,000 Active 5 DOM
-
2026-05-30days on market $147,000 Active 4 DOM
-
2026-05-26$147,000 Active
-
2019-07-24soldstatus $72,500
-
1979-08-09soldstatus $29,900
-
1953-01-10soldstatus $8,500
ⓘ Source: listings_history table (triggers on properties + properties_extension) + one-shot
backfill from property_details.listing_events for pre-trigger history.
Tax reassessment forecast VA · Resets to sale price
- Current annual tax
- $906 · $75/mo
- Projected year-2 tax
- $906 · $75/mo
- Expected delta
- $0/yr ($0/mo · 0.0%)
ⓘ Screening estimate from a state-policy table — verify with the county assessor before closing.
Climate risk First Street
- Flood 7/10 Severe FEMA zone X (unshaded) · 99% chance over 30 yrs
- Wildfire 2/10 Low
- Heat 6/10 Major 7 d/yr ≥102°F today · 18 d/yr by 30 yrs out
- Wind 2/10 Low 3% chance of damaging wind over 30 yrs
- Air quality 2/10 Low 0 unhealthy d/yr today · 1 by 30 yrs out
Nearby sold comps map
Loading sold comps map…
Walkable amenities ~0.75 mi
Loading nearby amenities…
Taxation est. · year 1
- Rental income
- $14,063
- − Mortgage interest
- −$5,601
- − Property taxes
- −$906
- − Insurance
- −$1,297
- − Repairs & maintenance
- −$1,125
- − Management
- −$1,125
- − Depreciation
- −$2,909
- Taxable income
- $1,099
- Est. tax owed @ 24.0%
- −$264
- After-tax cash flow
- $2,350/yr
For passive investors: Depreciation is non-cash, so a rental often shows a tax loss while cash-flowing — sheltering income. Rental losses are passive: they offset passive income freely, and up to $25,000/yr can offset ordinary (W-2) income if you actively participate and your MAGI is under $100k (phasing out to $0 by $150k); unused losses carry forward. On sale, claimed depreciation is recaptured at up to 25%, and gains may owe capital-gains tax (a 1031 exchange can defer both). Figures are a year-1 estimate at your 24.0% rate — not tax advice; consult a CPA.
Schools (NCES district)
- District
- Lynchburg City Public School District
- NCES district ID
- 5102340
- Math proficiency
- 36% ▼ -38.00%
- Reading proficiency
- 61% ▼ -8.00%
- Median HH income
- $39,097
- Composite
- 40.4/100
- National rank
- #3730
- State rank
- #104 of 131 in VA
Livability — Lynchburg
- Score
- 91/100
- State rank
- #1
- US rank
- #58
Category grades
Schools grade is shown separately in the Schools card above.
Census & demographics
- Census place
- Lynchburg, VA
- County
- Lynchburg City · 97,036 people
- City population
- 97,036
- Metro
- Lynchburg, VA
- Population (ZIP)
- 25,006
- Household income
- $42,222
- Rent vs Own
- Severe rent burden
- 1717.0
Population outlook (Lynchburg County) Hauer SSP2
- Today (2025)
- 87,977 people
- By 2030
- 93,626 · +6.4%
- By 2040
- 106,145 · +20.7%
- By 2050
- 120,783 · +37.3%
- By 2075
- 162,249 · +84.4%
- By 2100
- 191,358 · +117.5%
Race, ethnicity, and origin ACS 2023
- Neighborhood character
- Diverse neighborhood (Simpson 0.55)
- Race & ethnicity
- White 58% Black 34% Two or more races 4% Hispanic / Latino 3%
- Common ancestry
- Slovak 1% Italian 1% Serbian 1%
- Foreign-born
- 3% · Canada
- Languages at home
- 96% English-only · Spanish 2%
Political lean MEDSL · Lynchburg
- 2024 margin
- Lean R (+7.9) · D 45.4% · R 53.3% · Other 1.3%
- 2008→2024 swing
- -3.9pp toward R · 2008: -4.0pp · 2024: -7.9pp
- All cycles
- 2024: R+7.9 2020: D+2.6 2016: R+9.0 2012: R+10.6 2008: R+4.0
Not yet ingested
- Civics
- —
Market trends
- HPI YoY
- ▼ -131.06%
- Current HPI
- 223.6839
- Rent YoY
- ▲ 1.15%
- Metro
- Lynchburg, VA
- State GDP YoY
- ▲ 2.40%
- F500 in state
- 50
Industry mix (Fortune 500 HQ in VA)
| Industry | F500 HQs | Revenue |
|---|---|---|
| Aerospace / Defense | 4 | $236B |
|
||
| Technology / Defense | 3 | $32B |
|
||
| Financial Services | 2 | $176B |
|
||
| Utilities | 2 | $27B |
|
||
| Insurance | 2 | $25B |
|
||
| Technology | 2 | $15B |
|
||
Price history
+1629.4% since first listed4 events — show timeline
- 2026-05-26 Listed $147,000 FSBO.com
- 2019-07-24 Sold (Public Records) $72,500 Public Records
- 1979-08-09 Sold (Public Records) $29,900 Public Records
- 1953-01-10 Sold (Public Records) $8,500 Public Records
Property tax history
+2.3%/yrLatest (2025): $906 · +7.2% YoY. Source: county tax records.
Cash-flow waterfall
monthlySold comps — $/sqft
last 12 mo · ≤1 miLoading sold comps…