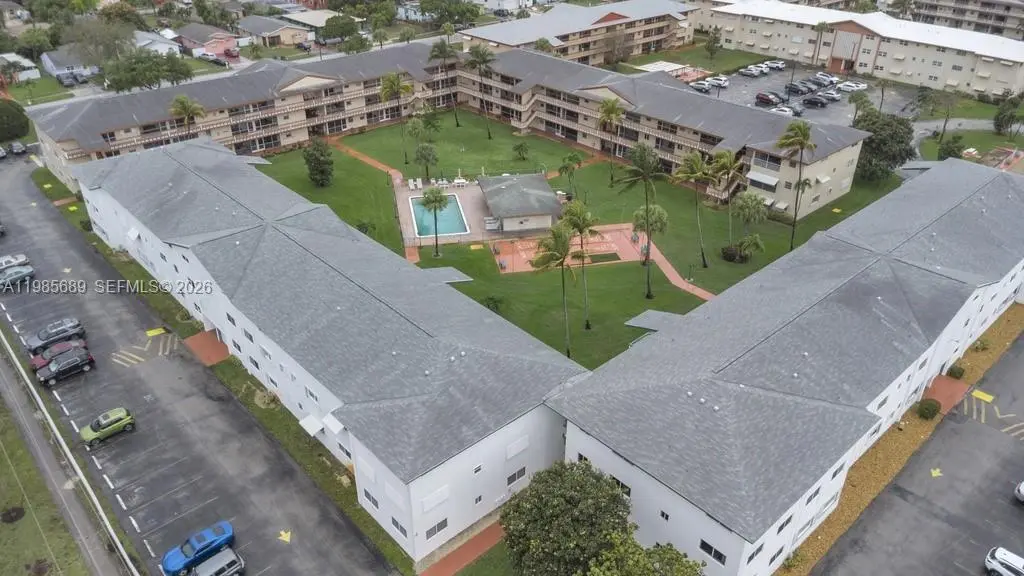
5300 Washington St Unit J218 · Hollywood, FL
Flood risk 1/10 · Minimal
- FEMA flood zone
- X (shaded)
- Chance of flooding over 30 yrs
- 0.0%
- Est. flood insurance / yr
- $507 – $1,088
Fire risk 1/10 · Minimal
- Est. fire insurance / yr
- $947 – $1,759
Heat risk 10/10 · Severe
- Hot days now (above 105°F)
- 7 days/yr
- Hot days in 30 yrs
- 26 days/yr
Wind risk 10/10 · Severe
- Chance of severe wind over 30 yrs
- 99.0%
Air-quality risk 2/10 · Minimal
- Unhealthy air days now
- 2 days/yr
- Unhealthy air days in 30 yrs
- 2 days/yr
Risk factors via First Street. Map © Google.
Why this score? — see what drove the C grade
The composite is a weighted blend of 9 inputs, each scored 0–100. Each bar is that input's sub-score; the figure is the points it added to the 100-point composite (weight × sub-score).
- Cash flow +18.0/30.0
- 1% rule +10.0/10.0
- ARV discount +7.5/15.0
- DSCR +5.7/10.0
- Schools +4.1/10.0
- Livability +3.8/5.0
- Condition / age +3.8/5.0
- Rent growth +3.1/5.0
- Appreciation +0.0/10.0
$99,000
🖨 Deal sheet 📄 Offer letter ✓ Due diligence
Listing remarks
This property features a one-bedroom layout with one and a half bathrooms, complemented by an updated kitchen and bathrooms. It boasts tile flooring, impact-resistant windows, and a tankless hot water heater. The sale includes furniture, and the screened-in balcony offers a view of the pool area. The association provides a range of amenities, including a heated pool, BBQ facilities, a community room, a gym, a party room, and more
Key facts
- View of the pool
- Updated kitchen
- Screened-in balcony
Tags
Property features AI
Finance
- Financial info: Pets not allowed
- HOA & community: Monthly association fee; Association fee includes management, amenities, common areas, internet, legal/accounting, grounds and structure maintenance, pool(s), recreation facilities, reserve fund, roof, sewer, security, trash, and water; Association amenities include billiard room, clubhouse, community kitchen, fitness center, laundry, pool, trash service, and elevator(s); Senior community
Exterior
- Parking: Assigned parking; Guest parking; One parking space
- Security: Complex fenced; Phone entry
- Utilities: Public water; Public sewer
- Home design: Attached property; 3 stories; Entry on level 2
- Construction: Block construction; Resale property
- Exterior features: Enclosed porch; Porch with screened area; Association heated pool; Association pool
Interior
- Kitchen: Electric range; Refrigerator
- Bedrooms: Bedroom on main level
- Flooring: Tile
- Bathrooms: 1 full bathroom; 1 half bathroom
- Heating & cooling: Central heating (electric); Central air conditioning (electric); Ceiling fan(s)
- Interior features: Impact glass windows; Furnished; Walk-in closet(s)
- Laundry & utility: Common area laundry; Electric water heater
Neighborhood map
What this means for you Summary
Snapshot
- This is a 1-bed/1.5-bath condo listed at $99k. Condition is rated good.
Deal economics
- At list price, monthly cash flow is $86 ($1k/yr) — positive.
- The deal already cash-flows at list — no discount required.
- Meets the 1% rule at list price ($2k rent vs $99k).
- Recommended offer: $90k (9.0% below list) — sets the bar for market timing.
- Cap rate 7.3% vs local median 3.2% in Hollywood — top-decile yield for the area; either an underpriced asset or a hidden risk that comps aren't pricing in. Stress-test before assuming the spread holds.
Location & tenants
- Location reads 76/100 on livability (#232 in FL, #3,548 nationally) — a middle-class / working-renter tenant base. Strengths: commute A+, housing A+, crime B+; Watch: amenities D.
- Broward (suburban): math 42% / reading 53% proficiency, ranked #46 of 73 in FL (top 63%) — families likely to look elsewhere, expect single-tenant / working-renter base with shorter leases.
- Market conditions: Rents rising (+2.4%/yr); 529 active listings in the ZIP; 40 comparable units currently listed for rent nearby; rentals at typical pace (median 15d on market — plan ~3-4 weeks tenant-placement turnaround); 2,111 units permitted in Broward County in 2024 (1,265 in 5+ unit buildings).
Forward outlook
- Local home prices are declining (-3.0%/yr); year-one equity from $684 of loan paydown is wiped out by about $3k of value loss. Plan a longer hold.
- Broward County population projected at +34% by 2050 — long-run rental-demand tailwind backs the buy-and-hold thesis.
Negotiation context
- It's been on market 91 days — a 9% lower offer ($90k) is reasonable based on typical stale-listing flexibility.
Risks & watch-outs
- Watch-outs: HOA is 33% of rent.
- Climate carrying-cost: severe wind risk, 99% chance of damaging wind over 30y; extreme-heat days projected 7→26/yr by 2055 (HVAC capex compounding) — expect insurance premiums to compound above CPI over the hold.
Questions for the listing agent
- It's been on market 91 days. Have you received any prior offers? Is the seller open to a 9% concession, seller financing, or rate buy-down credit?
- Built in 1969 — when were the roof, HVAC, electrical panel, plumbing, and water heater last replaced?
- What does the HOA fee cover, when was the last increase, and are there any pending special assessments or reserve-fund shortfalls?
- Any open or pending special assessments — roof, HVAC, plumbing, elevator, façade? What's the per-unit balance and payoff schedule, and is the seller paying it off at close or rolling it to the buyer?
- Why hasn't it sold? Are there any deal-killer items the seller is aware of (foundation, flood, title, zoning, code violations)?
- Is there a deadline driving the sale (1031 exchange, divorce, estate, relocation)? That informs how much negotiation room exists.
- What's the average days-on-market for RENTAL listings here right now (not sales)? A rising rental-DOM trend means longer vacancies and softer asking-rent achievability than the comps imply.
- What's the recent tenant-quality profile in this submarket — average credit score on applications, eviction rate, late-payment / NSF rate, and stable-employment percentage? A property-management company in the area should have these aggregated.
- How much new apartment / multifamily construction is in the pipeline within 1–3 miles? Heavy new supply (>2% of stock underway) typically softens rents 12–24 months out; light construction supports rent growth.
Investment metrics
- 1% rule
- 1.68% ✓
- Cap rate
- 7.33%
- Cash-on-cash
- 3.71%
- DSCR
- 1.17
- GRM
- 5.0
CMA / ARV
No comps found within radius.
Projected returns pro-forma
-3.0% appreciation · 2.41% rent growth · sell at horizon
- IRR
- -11.2%
- Equity multiple
- 0.60×
- Total profit
- $-11,200
- Equity at exit
- $14,761
- IRR
- -2.9%
- Equity multiple
- 0.81×
- Total profit
- $-5,237
- Equity at exit
- $8,560
Cash invested: $27,720 (down + closing). Projections, not guarantees.
Landlord ↔ Tenant lean methodology
- Overall (STATE)
- 87 Strongly Landlord-Friendly
- State Florida
- 87 Strongly Landlord-Friendly · R+3
- County
- — inherits STATE
- City
- — inherits STATE
ZIP-level market 33021
- Rents YoY
- 2.4%
- Active inventory
- 529
- Price-to-rent
- 5.0×
Monthly cashflow live
- Estimated rent
- $1,665 high interval (Pro) →
- Mortgage (P&I)
- −$519
- Tax est. 1.5%
- −$124 /mo · $1,485/yr
- Insurance
- −$41
- HOA
- −$545
- Vacancy / Maint / Mgmt
- −$350
- Net cashflow
- $86
Break-even live
UW: 25.0% down · 7.5% · 30yr · 1.5% tax · 5.0% vac · 8.0% maint · 8.0% mgmt
Financing live
Cash to close
- Down payment
- $24,750
- Closing costs
- $2,970
- Reserves months
- —
- Total cash needed
- —
Loan-product check · same deal, 3 products live
Conventional
25% down · 7.5% · 30yr
- Down + closing
- —
- Monthly P&I
- —
- Monthly cashflow
- —
- DSCR
- —
- Eligible?
- —
Personal DTI + credit; lowest rate.
DSCR
20% down · 8.5% · 30yr
- Down + closing
- —
- Monthly P&I
- —
- Monthly cashflow
- —
- DSCR
- —
- Eligible?
- —
No personal income docs; deal must DSCR.
Hard money
10% down · 12.0% · 12mo
- Down + closing
- —
- Monthly P&I
- —
- Monthly cashflow
- —
- DSCR
- —
- Eligible?
- —
Short-term bridge; refi at stabilization.
Rent comps 40 comps
| Address | Beds | Baths | Sqft | Rent | $/sqft | DOM | Units | Dist |
|---|---|---|---|---|---|---|---|---|
| 5500 Washington St Hollywood, FL | 1.0–3.0 | 1.0–2.0 | 1000 | $1,590 | $1.59 | 3d | 18 | 0.15mi |
| 4917 Washington St Hollywood, FL | 1.0 | 1.0 | 600 | $1,300 | $2.17 | 7d | 1 | 0.21mi |
| 5821 Washington St Hollywood, FL | 1.0 | 1.0 | 650 | $1,775 | $2.73 | 24d | 2 | 0.41mi |
| 5835 Washington St #52 Hollywood, FL | 1.0 | 1.0 | 650 | $1,600 | $2.46 | 5d | 1 | 0.44mi |
| 5835 Washington St #52 Hollywood, FL | 1.0 | 1.0 | 650 | $1,625 | $2.50 | 10d | 1 | 0.44mi |
| 5901 Washington St #247 Hollywood, FL | 1.0 | 1.0 | 650 | $1,650 | $2.54 | 7d | 1 | 0.45mi |
| 5901 Washington St #247 Hollywood, FL | 1.0 | 1.0 | 650 | $1,600 | $2.46 | 24d | 1 | 0.45mi |
| 5685 Flagler St Unit 2 Hollywood, FL | 2.0 | 1.0 | 420 | $1,900 | $4.52 | 3d | 1 | 0.45mi |
| 5685 Flagler St Unit 2 Hollywood, FL | 2.0 | 1.0 | 420 | $1,900 | $4.52 | 14d | 1 | 0.45mi |
| 5740 Mayo St #4 Hollywood, FL | 2.0 | 1.0 | 550 | $1,895 | $3.45 | 24d | 1 | 0.52mi |
| 5981 Washington St #219 Hollywood, FL | 1.0 | 1.0 | 450 | $1,500 | $3.33 | 24d | 1 | 0.52mi |
| 900 Tallwood Ave #207 Hollywood, FL | 1.0 | 1.0 | 640 | $1,575 | $2.46 | 20d | 1 | 0.53mi |
| 5230 Hollywood Blvd Hollywood, FL | 1.0–4.0 | 1.0–2.0 | 956 | $1,500 | $1.57 | 24d | 1 | 0.54mi |
| 5112 Hollywood Blvd Hollywood, FL | 1.0–2.0 | 1.0 | 727 | $1,600 | $2.20 | 19d | 2 | 0.54mi |
| 5112 Hollywood Blvd #3 Hollywood, FL | 1.0 | 1.0 | 650 | $1,550 | $2.38 | 16d | 1 | 0.54mi |
| 5420 Hollywood Blvd Unit 208 Hollywood, FL | 1.0 | 1.0 | 700 | $1,775 | $2.54 | 3d | 1 | 0.56mi |
| 5420 Hollywood Blvd Unit 208 Hollywood, FL | 1.0 | 1.0 | 700 | $1,775 | $2.54 | 4d | 1 | 0.56mi |
| 5141 Hollywood Blvd Unit 209 Hollywood, FL | 2.0 | 1.0 | 700 | $2,175 | $3.11 | 3d | 1 | 0.59mi |
| 5141 Hollywood Blvd Apt 206 Hollywood, FL | 1.0 | 1.0 | 700 | $1,825 | $2.61 | 3d | 1 | 0.60mi |
| 4933 Hollywood Blvd Unit 5420-202 Hollywood, FL | 1.0 | 1.0 | 650 | $1,750 | $2.69 | 22d | 1 | 0.61mi |
| 4933 Hollywood Blvd Unit 5141-206 Hollywood, FL | 1.0 | 1.0 | 650 | $1,750 | $2.69 | 24d | 1 | 0.61mi |
| 5849 Wiley St Hollywood, FL | 1.0 | 1.0 | 350 | $1,475 | $4.21 | 24d | 1 | 0.61mi |
| 5401 SW 20th St Unit B West Park, FL | 1.0 | 1.0 | 600 | $1,500 | $2.50 | 24d | 1 | 0.64mi |
| 5931 Wiley St Unit 5931 Hollywood, FL | 1.0 | 1.0 | 650 | $1,600 | $2.46 | 24d | 1 | 0.68mi |
| 5819 Polk St Apt 2 Hollywood, FL | 1.0 | 1.0 | 682 | $1,559 | $2.29 | 7d | 1 | 0.89mi |
| 5819 Polk St Unit 4 Hollywood, FL | 1.0 | 1.0 | 602 | $1,425 | $2.37 | 15d | 1 | 0.89mi |
| 4130 SW 19th St Unit 3 West Park, FL | 1.0 | 1.0 | 450 | $1,400 | $3.11 | 20d | 1 | 0.91mi |
| 504 N 57th Ave Unit N Hollywood, FL | 1.0 | 1.0 | 496 | $1,575 | $3.18 | 20d | 1 | 0.93mi |
| 532 S Crescent Dr Unit 106 Hollywood, FL | — | 1.0 | 550 | $1,425 | $2.59 | 14d | 1 | 0.96mi |
| 315 S Crescent Dr Hollywood, FL | — | 1.0 | 544 | $1,425 | $2.62 | 15d | 1 | 0.98mi |
| 1 Main St Miramar, FL | 3.0 | 1.0–3.0 | 1023 | $2,273 | $2.22 | 1d | 36 | 1.00mi |
| 3711 Van Buren St #2 Hollywood, FL | 1.0 | 1.0 | 660 | $1,550 | $2.35 | 24d | 1 | 1.04mi |
| 5807 SW 25th St West Park, FL | — | 1.0 | 500 | $1,495 | $2.99 | 7d | 1 | 1.05mi |
| 6025 Polk St Apt 8 Hollywood, FL | 1.0 | 1.0 | 700 | $1,400 | $2.00 | 24d | 1 | 1.07mi |
| 6031 Polk St Unit 4 Hollywood, FL | 1.0 | 1.0 | 644 | $1,425 | $2.21 | 24d | 1 | 1.09mi |
| 3601 Van Buren St Hollywood, FL | 1.0–2.0 | 1.0–2.0 | 941 | $1,725 | $1.83 | 3d | 3 | 1.11mi |
| 6014 Fillmore St Hollywood, FL | 1.0 | 1.0 | 420 | $1,449 | $3.45 | 14d | 1 | 1.12mi |
| 6014 Fillmore St Hollywood, FL | 1.0 | 1.0 | 640 | $1,449 | $2.26 | 24d | 1 | 1.12mi |
| 6014 Fillmore St Hollywood, FL | 1.0 | 1.0 | 450 | $1,425 | $3.17 | 4d | 1 | 1.12mi |
| 6014 Fillmore St Unit 4E Hollywood, FL | 1.0 | 1.0 | 420 | $1,399 | $3.33 | 7d | 1 | 1.12mi |
HOA detail condo
- Monthly dues
- $545 · $6,540/yr
- Likely covers
- waterpoolgym
- Assessments
- None detected in remarks — confirm with the listing agent.
Listing history 15 events
-
2026-06-18days on market $99,000 Active 91 DOM
-
2026-06-17days on market $99,000 Active 90 DOM
-
2026-06-16days on market $99,000 Active 89 DOM
-
2026-06-15days on market $99,000 Active 88 DOM
-
2026-06-13days on market $99,000 Active 86 DOM
-
2026-06-09days on market $99,000 Active 82 DOM
-
2026-06-08days on market $99,000 Active 81 DOM
-
2026-06-07days on market $99,000 Active 80 DOM
-
2026-06-04days on market $99,000 Active 77 DOM
-
2026-06-03days on market $99,000 Active 76 DOM
-
2026-06-02days on market $99,000 Active 75 DOM
-
2026-06-01days on market $99,000 Active 74 DOM
-
2026-05-31days on market $99,000 Active 73 DOM
-
2026-04-30price $99,000
-
2026-03-17$110,000 Active
ⓘ Source: listings_history table (triggers on properties + properties_extension) + one-shot
backfill from property_details.listing_events for pre-trigger history.
Climate risk First Street
- Flood 1/10 Low FEMA zone X (shaded) · 0% chance over 30 yrs
- Wildfire 1/10 Low
- Heat 10/10 Extreme 7 d/yr ≥105°F today · 26 d/yr by 30 yrs out
- Wind 10/10 Extreme 99% chance of damaging wind over 30 yrs
- Air quality 2/10 Low 2 unhealthy d/yr today · 2 by 30 yrs out
Nearby sold comps map
Loading sold comps map…
Walkable amenities ~0.75 mi
Loading nearby amenities…
Taxation est. · year 1
- Rental income
- $19,974
- − Mortgage interest
- −$5,546
- − Property taxes
- −$1,485
- − Insurance
- −$495
- − Repairs & maintenance
- −$1,598
- − Management
- −$1,598
- − HOA
- −$6,540
- − Depreciation
- −$2,880
- Taxable loss
- −$167
- Est. tax savings @ 24.0%
- +$40
- After-tax cash flow
- $1,070/yr
For passive investors: Depreciation is non-cash, so a rental often shows a tax loss while cash-flowing — sheltering income. Rental losses are passive: they offset passive income freely, and up to $25,000/yr can offset ordinary (W-2) income if you actively participate and your MAGI is under $100k (phasing out to $0 by $150k); unused losses carry forward. On sale, claimed depreciation is recaptured at up to 25%, and gains may owe capital-gains tax (a 1031 exchange can defer both). Figures are a year-1 estimate at your 24.0% rate — not tax advice; consult a CPA.
Condition & rehab AI · 13 photos
This one-bedroom condo is in good condition with updated kitchens and bathrooms, and a well-maintained exterior. It offers a good return on investment with minor cosmetic updates that can significantly increase its value.
Value-add opportunities
- Both Paint exterior siding — Enhances curb appeal and value
- Both Replace ceiling fans — Improves air circulation and comfort
Renovation cost estimate screening
Value-add ROI direction
- Both Paint exterior siding — Enhances curb appeal and value ↑
- Both Replace ceiling fans — Improves air circulation and comfort ↑
ⓘ Cost ranges are severity-bucket heuristics (US national rule-of-thumb). Get contractor quotes + a written scope before underwriting a rehab budget.
Schools (NCES district)
- District
- Broward
- NCES district ID
- 1200180
- Math proficiency
- 42% ▼ -18.00%
- Reading proficiency
- 53% ▼ -5.00%
- Median HH income
- $52,139
- Composite
- 40.88/100
- National rank
- #3621
- State rank
- #46 of 73 in FL
Livability — Hollywood
- Score
- 76/100
- State rank
- #232
- US rank
- #3548
Category grades
Schools grade is shown separately in the Schools card above.
Census & demographics
- Census place
- Hollywood, FL
- County
- Broward County · 1,963,430 people
- City population
- 109,079
- Metro
- Miami-Fort Lauderdale-Pompano Beach, FL
- Population (ZIP)
- 48,464
- Household income
- $71,318
- Rent vs Own
- Severe rent burden
- 2151.0
Population outlook (Broward County) Hauer SSP2
- Today (2025)
- 2,207,033 people
- By 2030
- 2,360,704 · +7.0%
- By 2040
- 2,661,208 · +20.6%
- By 2050
- 2,946,698 · +33.5%
- By 2075
- 3,602,273 · +63.2%
- By 2100
- 3,970,984 · +79.9%
Race, ethnicity, and origin ACS 2023
- Neighborhood character
- Diverse neighborhood (Simpson 0.65)
- Race & ethnicity
- White 45% Hispanic / Latino 37% Two or more races 17% Black 13% Asian 3%
- Hispanic origin (detail)
- Puerto Rican 5% Cuban 10% Dominican 2%
- Common ancestry
- Romanian 3% Scotch-Irish 2% Hispanic 2%
- Foreign-born
- 35% · Canada, Jamaica, Dominican Republic
- Languages at home
- 53% English-only · Spanish 33% French/Haitian/Cajun 4% Russian/Polish/Slavic 2%
Political lean MEDSL · Broward
- 2024 margin
- D (+17.0) · D 58.0% · R 41.0%
- 2008→2024 swing
- -17.8pp toward R · 2008: 34.7pp · 2024: 17.0pp
- All cycles
- 2024: D+17.0 2020: D+29.8 2016: D+35.0 2012: D+34.9 2008: D+34.7
Not yet ingested
- Civics
- —
Market trends
- HPI YoY
- ▼ -404.28%
- Current HPI
- 429.7129
- Rent YoY
- ▲ 2.41%
- Metro
- Miami-Fort Lauderdale-Pompano Beach, FL
- State GDP YoY
- ▲ 3.28%
- F500 in state
- 36
Industry mix (Fortune 500 HQ in FL)
| Industry | F500 HQs | Revenue |
|---|---|---|
| Industrial Technology | 2 | $29B |
|
||
| Insurance | 2 | $17B |
|
||
| Retail | 1 | $60B |
|
||
| Technology Distribution | 1 | $58B |
|
||
| Homebuilding | 1 | $35B |
|
||
| Technology Manufacturing | 1 | $35B |
|
||
Price history
-10.0% since first listed2 events — show timeline
- 2026-04-30 Price Changed $99,000 MARMLS
- 2026-03-17 Listed $110,000 MARMLS
Cash-flow waterfall
monthlySold comps — $/sqft
last 12 mo · ≤1 miLoading sold comps…