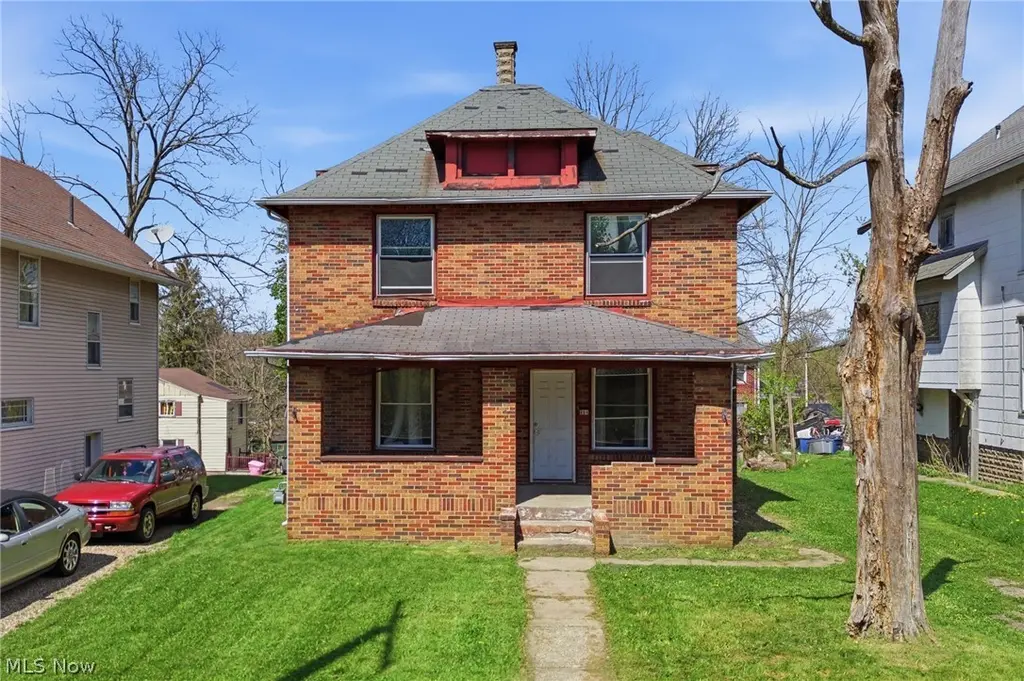
604 W 4th St · Mansfield, OH
Flood risk 1/10 · Minimal
- FEMA flood zone
- X (unshaded)
- Chance of flooding over 30 yrs
- 0.0%
- Est. flood insurance / yr
- $473 – $860
Fire risk 1/10 · Minimal
- Est. fire insurance / yr
- $713 – $1,323
Heat risk 3/10 · Minor
- Hot days now (above 96°F)
- 7 days/yr
- Hot days in 30 yrs
- 17 days/yr
Wind risk 2/10 · Minimal
- Chance of severe wind over 30 yrs
- —
Air-quality risk 2/10 · Minimal
- Unhealthy air days now
- 1 days/yr
- Unhealthy air days in 30 yrs
- 1 days/yr
Risk factors via First Street. Map © Google.
Why this score? — see what drove the C grade
The composite is a weighted blend of 9 inputs, each scored 0–100. Each bar is that input's sub-score; the figure is the points it added to the 100-point composite (weight × sub-score).
- Cash flow +29.7/30.0
- DSCR +10.0/10.0
- 1% rule +8.4/10.0
- Livability +3.8/5.0
- Rent growth +2.5/5.0
- Condition / age +2.5/5.0
- Schools +2.3/10.0
- ARV discount +0.0/15.0
- Appreciation +0.0/10.0
$79,900
🖨 Deal sheet (PDF) 📄 Offer letter ✓ Due diligence
Listing remarks MLS
Solid, income-producing opportunity with timeless character! This 2-story brick home offers a strong, durable structure built to stand the test of time—perfect for investors or future owner occupants alike. Currently occupied by a long-term tenant, providing immediate rental income and stability from day one. Inside, you’ll find a functional layout with additional potential waiting to be unlocked. The attic space offers an excellent opportunity to be finished into an additional bedroom, office, or bonus living area—adding both value and versatility. With its low-maintenance exterior, solid construction, and built-in income, this property is an ideal addition to any portfolio or a smart first investment. Don’t miss your chance to own a dependable, easy-to-manage asset with room to grow!
Key facts
- Solid construction
- Attic space
- 2 story brick home
Tags
Neighborhood map
What this means for you Summary
Snapshot
- This is a 3-bed/1.0-bath single-family listed at $80k.
Deal economics
- At list price, monthly cash flow is $292 ($3k/yr) — positive.
- The deal already cash-flows at list — no discount required.
- Meets the 1% rule at list price ($1k rent vs $80k).
- Recommended offer: $78k (3.0% below list) — sets the bar for market timing.
- Cap rate 10.7% vs local median 4.3% in Mansfield — top-decile yield for the area; either an underpriced asset or a hidden risk that comps aren't pricing in. Stress-test before assuming the spread holds.
Location & tenants
- Location reads 76/100 on livability (#224 in OH, #3,525 nationally) — a middle-class / working-renter tenant base. Strengths: commute A+, cost of living A+, housing A+; Watch: schools C-, crime D-, amenities D-.
- Mansfield City (urban): math 24% / reading 33% proficiency, ranked #590 of 656 in OH (top 90%) — low school quality limits family demand, transient renter base, plan for 1-2y turnover; 80% free/reduced lunch — lower-income household profile, screen leases tightly.
- Market conditions: 117 active listings in the ZIP; 3 comparable units currently listed for rent nearby; rentals lingering (median 45d on market — plan ~5-8 weeks vacancy on turnover, expect pricing pressure); 100% of comp listings sitting > 30 days — soft ceiling on asking rent; 145 units permitted in Richland County in 2024 (0 in 5+ unit buildings).
Forward outlook
- Local home prices are declining (-3.0%/yr); year-one equity from $552 of loan paydown is wiped out by about $2k of value loss. Plan a longer hold.
- Richland County population projected at -18% by 2050 — secular population decline; favor cash flow + early exit over multi-decade hold.
- At projected returns (-3.0% appreciation + 3.0% rent growth), your $22k cash investment doubles in ~8 years — after that, you're playing with house money.
Negotiation context
- It's been on market 58 days — a 3% lower offer ($78k) is reasonable based on typical stale-listing flexibility.
Risks & watch-outs
- Watch-outs: built in 1925 — expect roof / HVAC / electrical / plumbing capex.
Questions for the listing agent
- It's been on market 58 days. Have you received any prior offers? Is the seller open to a 3% concession, seller financing, or rate buy-down credit?
- Built in 1925 — when were the roof, HVAC, electrical panel, plumbing, and water heater last replaced?
- Is there a deadline driving the sale (1031 exchange, divorce, estate, relocation)? That informs how much negotiation room exists.
- Crime grade is D in this area — have there been break-ins, vandalism, or insurance claims at this property in the last 3 years? What carrier currently insures it and at what premium?
- What's the average days-on-market for RENTAL listings here right now (not sales)? A rising rental-DOM trend means longer vacancies and softer asking-rent achievability than the comps imply.
- What's the recent tenant-quality profile in this submarket — average credit score on applications, eviction rate, late-payment / NSF rate, and stable-employment percentage? A property-management company in the area should have these aggregated.
- How much new for-sale + rental construction is in the pipeline within 1–3 miles? Heavy new supply typically softens prices + rents 12–24 months out; constrained supply supports both.
Investment metrics
- 1% rule
- 1.34% ✓
- Cap rate
- 10.67%
- Cash-on-cash
- 15.64%
- DSCR
- 1.70
- GRM
- 6.2
CMA / ARV
- ARV (median comp)
- $60,215
- List price
- $79,900
- Delta
- 32.69%
- Verdict
- OVERPRICED
- Comps
- 20 within 1.0 mi
Show comp detail 12 sales within ~0.75 mi
| Address | Dist | Beds/Ba | Sqft | Sold | Price | $/sf | Match |
|---|---|---|---|---|---|---|---|
| 568 Garfield Pl | 0.21mi | 4/1.0 (+1) | 1,613 (-7%) | 1mo | $140,000 | $87 | 72 |
| 170 Western Ave | 0.08mi | 3/1.0 | 1,520 (-13%) | 6mo | $104,900 | $69 | 70 |
| 212 Penn Ave | 0.27mi | 4/2.0 (+1) | 1,655 (-5%) | 3mo | $121,000 | $73 | 68 |
| 657 W Fourth St | 0.10mi | 3/1.5 | 1,950 (+12%) | 9mo | $115,000 | $59 | 65 |
| 78 Glenwood Blvd | 0.53mi | 4/1.5 (+1) | 1,756 (+1%) | 4mo | $224,900 | $128 | 63 |
| 189 Westwood Ave | 0.73mi | 3/2.0 | 1,752 (+1%) | 3mo | $169,000 | $96 | 58 |
| 114 Vennum Ave | 0.69mi | 4/1.0 (+1) | 1,724 (-1%) | 4mo | $50,000 | $29 | 58 |
| 41 Western Ave | 0.32mi | 3/2.0 | 1,536 (-12%) | 10mo | $86,000 | $56 | 53 |
| 272 W 5th St | 0.60mi | 3/1.0 | 1,915 (+10%) | 6mo | $135,000 | $70 | 51 |
| 604 Sackman St | 0.32mi | 4/1.5 (+1) | 1,483 (-15%) | 10mo | $149,000 | $100 | 46 |
| 282 W 5th St | 0.51mi | 3/2.0 | 1,480 (-15%) | 5mo | $85,000 | $57 | 43 |
| 37 Linden Rd | 0.69mi | 3/1.0 | 1,488 (-14%) | 5mo | $66,000 | $44 | 40 |
Match score weights: distance 35% · size 25% · config 20% · recency 20%. Top-matched comps best support the ARV.
Projected returns pro-forma
-3.0% appreciation · 3.0% rent growth · sell at horizon
- IRR
- 6.5%
- Equity multiple
- 1.25×
- Total profit
- $5,638
- Equity at exit
- $11,913
- IRR
- 15.8%
- Equity multiple
- 2.29×
- Total profit
- $28,885
- Equity at exit
- $6,908
Cash invested: $22,372 (down + closing). Projections, not guarantees.
Landlord ↔ Tenant lean methodology
- Overall (STATE)
- 73 Landlord-Friendly
- State Ohio
- 73 Landlord-Friendly · R+6
- County
- — inherits STATE
- City
- — inherits STATE
ZIP-level market 44906
- Home prices YoY
- -23.9%
- Active inventory
- 117
- Price-to-rent
- 6.2×
Monthly cashflow live
- Estimated rent
- $1,068 medium interval (Pro) →
- Mortgage (P&I)
- −$419
- Tax est. 1.5%
- −$100 /mo · $1,198/yr
- Insurance
- −$33
- HOA
- −$0
- Vacancy / Maint / Mgmt
- −$224
- Net cashflow
- $292
Break-even live
Sensitivity live
| Price | -10% $347 | -5% $319 | +0% $292 | +5% $264 | +10% $236 |
|---|---|---|---|---|---|
| Rent | -10% $207 | -5% $249 | +0% $292 | +5% $334 | +10% $376 |
| Rate | -1.0pp $332 | -0.5pp $312 | base $292 | +0.5pp $271 | +1.0pp $250 |
UW: 25.0% down · 7.5% · 30yr · 1.5% tax · 5.0% vac · 8.0% maint · 8.0% mgmt
Financing live
Cash to close
- Down payment
- $19,975
- Closing costs
- $2,397
- Reserves months
- —
- Total cash needed
- —
Loan-product check · same deal, 3 products live
Conventional
25% down · 7.5% · 30yr
- Down + closing
- —
- Monthly P&I
- —
- Monthly cashflow
- —
- DSCR
- —
- Eligible?
- —
Personal DTI + credit; lowest rate.
DSCR
20% down · 8.5% · 30yr
- Down + closing
- —
- Monthly P&I
- —
- Monthly cashflow
- —
- DSCR
- —
- Eligible?
- —
No personal income docs; deal must DSCR.
Hard money
10% down · 12.0% · 12mo
- Down + closing
- —
- Monthly P&I
- —
- Monthly cashflow
- —
- DSCR
- —
- Eligible?
- —
Short-term bridge; refi at stabilization.
Rent comps 3 comps
| Address | Beds | Baths | Sqft | Rent | $/sqft | DOM | Units | Dist |
|---|---|---|---|---|---|---|---|---|
| 640 King St Mansfield, OH | 1.0–3.0 | 1.0 | 938 | $1,100 | $1.17 | 44d | 11 | 0.72mi |
| 243 W 1st St Mansfield, OH | 4.0 | 1.0 | 1470 | $1,195 | $0.81 | 44d | 1 | 0.84mi |
| 520 Lida St Mansfield, OH | 3.0 | 1.0 | 1300 | $850 | $0.65 | 44d | 1 | 1.07mi |
Listing history 20 events
-
2026-06-19days on market $79,900 Active 58 DOM
-
2026-06-18days on market $79,900 Active 57 DOM
-
2026-06-17days on market $79,900 Active 56 DOM
-
2026-06-16days on market $79,900 Active 55 DOM
-
2026-06-15days on market $79,900 Active 54 DOM
-
2026-06-14days on market $79,900 Active 52 DOM
-
2026-06-12days on market $79,900 Active 51 DOM
-
2026-06-09days on market $79,900 Active 48 DOM
-
2026-06-08days on market $79,900 Active 47 DOM
-
2026-06-07days on market $79,900 Active 46 DOM
-
2026-06-05days on market $79,900 Active 43 DOM
-
2026-06-03days on market $79,900 Active 42 DOM
-
2026-06-02days on market $79,900 Active 41 DOM
-
2026-06-01days on market $79,900 Active 40 DOM
-
2026-05-31days on market $79,900 Active 39 DOM
-
2026-05-30days on market $79,900 Active 38 DOM
-
2026-05-09price $84,900 820-char remark
Show marketing remark (820 chars)
Solid, income-producing opportunity with timeless character! This 2-story brick home offers a strong, durable structure built to stand the test of time—perfect for investors or future owner occupants alike. Currently occupied by a long-term tenant, providing immediate rental income and stability from day one. Inside, you’ll find a functional layout with additional potential waiting to be unlocked. The attic space offers an excellent opportunity to be finished into an additional bedroom, office, or bonus living area—adding both value and versatility. With its low-maintenance exterior, solid construction, and built-in income, this property is an ideal addition to any portfolio or a smart first investment. Don’t miss your chance to own a dependable, easy-to-manage asset with room to grow!
-
2026-04-22$90,000 Active 820-char remark
Show marketing remark (820 chars)
Solid, income-producing opportunity with timeless character! This 2-story brick home offers a strong, durable structure built to stand the test of time—perfect for investors or future owner occupants alike. Currently occupied by a long-term tenant, providing immediate rental income and stability from day one. Inside, you’ll find a functional layout with additional potential waiting to be unlocked. The attic space offers an excellent opportunity to be finished into an additional bedroom, office, or bonus living area—adding both value and versatility. With its low-maintenance exterior, solid construction, and built-in income, this property is an ideal addition to any portfolio or a smart first investment. Don’t miss your chance to own a dependable, easy-to-manage asset with room to grow!
-
2015-02-03soldstatus $84,800
-
2000-07-31soldstatus $24,000
ⓘ Source: listings_history table (triggers on properties + properties_extension) + one-shot
backfill from property_details.listing_events for pre-trigger history.
Climate risk First Street
- Flood 1/10 Low FEMA zone X (unshaded) · 0% chance over 30 yrs
- Wildfire 1/10 Low
- Heat 3/10 Moderate 7 d/yr ≥96°F today · 17 d/yr by 30 yrs out
- Wind 2/10 Low
- Air quality 2/10 Low 1 unhealthy d/yr today · 1 by 30 yrs out
Nearby sold comps map
Loading sold comps map…
Walkable amenities ~0.75 mi
Loading nearby amenities…
Taxation est. · year 1
- Rental income
- $12,816
- − Mortgage interest
- −$4,476
- − Property taxes
- −$1,198
- − Insurance
- −$400
- − Repairs & maintenance
- −$1,025
- − Management
- −$1,025
- − Depreciation
- −$2,324
- Taxable income
- $2,367
- Est. tax owed @ 24.0%
- −$568
- After-tax cash flow
- $2,930/yr
For passive investors: Depreciation is non-cash, so a rental often shows a tax loss while cash-flowing — sheltering income. Rental losses are passive: they offset passive income freely, and up to $25,000/yr can offset ordinary (W-2) income if you actively participate and your MAGI is under $100k (phasing out to $0 by $150k); unused losses carry forward. On sale, claimed depreciation is recaptured at up to 25%, and gains may owe capital-gains tax (a 1031 exchange can defer both). Figures are a year-1 estimate at your 24.0% rate — not tax advice; consult a CPA.
Schools (NCES district)
- District
- Mansfield City
- NCES district ID
- 3904429
- Math proficiency
- 24% ▼ -19.00%
- Reading proficiency
- 33% ▼ -12.00%
- Median HH income
- $32,435
- Composite
- 23.25/100
- National rank
- #7934
- State rank
- #590 of 656 in OH
Livability — Mansfield
- Score
- 76/100
- State rank
- #224
- US rank
- #3525
Category grades
Schools grade is shown separately in the Schools card above.
Census & demographics
- Census place
- Mansfield, OH
- County
- Richland · 128,966 people
- City population
- 16,349
- Metro
- Mansfield, OH
- Population (ZIP)
- 17,059
- Household income
- $51,358
- Rent vs Own
- Severe rent burden
- 13.7
Population outlook (Richland County) Hauer SSP2
- Today (2025)
- 115,577 people
- By 2030
- 111,669 · -3.4%
- By 2040
- 103,323 · -10.6%
- By 2050
- 95,135 · -17.7%
- By 2075
- 76,719 · -33.6%
- By 2100
- 57,188 · -50.5%
Race, ethnicity, and origin ACS 2023
- Neighborhood character
- Predominantly White (86%)
- Race & ethnicity
- White 86% Black 5% Two or more races 4% Asian 2% Hispanic / Latino 1%
- Common ancestry
- Slovak 3% Serbian 3% Italian 2%
- Foreign-born
- 3% · South Korea
- Languages at home
- 95% English-only · German/W. Germanic 1% Spanish 1% Other Indo-European 1%
Political lean MEDSL · Richland
- 2024 margin
- Solid R (+42.3) · D 28.4% · R 70.8%
- 2008→2024 swing
- -28.8pp toward R · 2008: -13.6pp · 2024: -42.3pp
- All cycles
- 2024: R+42.3 2020: R+39.7 2016: R+37.5 2012: R+20.1 2008: R+13.6
Not yet ingested
- Civics
- —
Market trends
- HPI YoY
- ▼ -70.59%
- Current HPI
- 224.6878
- Rent YoY
- —
- Metro
- —
- State GDP YoY
- ▲ 1.98%
- F500 in state
- 48
Industry mix (Fortune 500 HQ in OH)
| Industry | F500 HQs | Revenue |
|---|---|---|
| Insurance | 3 | $145B |
|
||
| Industrial Machinery | 3 | $49B |
|
||
| Financial Services | 3 | $24B |
|
||
| Consumer Goods | 2 | $93B |
|
||
| Aerospace / Defense | 2 | $47B |
|
||
| Utilities | 2 | $33B |
|
||
Price history
+253.8% since first listed4 events — show timeline
- 2026-05-09 Price Changed $84,900 MLSNOW
- 2026-04-22 Listed $90,000 MLSNOW
- 2015-02-03 Sold (Public Records) $84,800 Public Records
- 2000-07-31 Sold (Public Records) $24,000 Public Records
Property tax history
-18.1%/yrLatest (2025): $90 · +0.0% YoY. Source: county tax records.
Cash-flow waterfall
monthlySold comps — $/sqft
last 12 mo · ≤1 miLoading sold comps…