37102 Main Sail Ct · Captains Cove, VA
Flood risk 1/10 · Minimal
- FEMA flood zone
- X (unshaded)
- Chance of flooding over 30 yrs
- 0.0%
- Est. flood insurance / yr
- $507 – $1,088
Fire risk 4/10 · Minor
- Est. fire insurance / yr
- $666 – $1,236
Heat risk 9/10 · Severe
- Hot days now (above 100°F)
- 7 days/yr
- Hot days in 30 yrs
- 18 days/yr
Wind risk 8/10 · Major
- Chance of severe wind over 30 yrs
- 80.0%
Air-quality risk 2/10 · Minimal
- Unhealthy air days now
- 0 days/yr
- Unhealthy air days in 30 yrs
- 1 days/yr
Risk factors via First Street. Map © Google.
Why this score? — see what drove the C grade
The composite is a weighted blend of 9 inputs, each scored 0–100. Each bar is that input's sub-score; the figure is the points it added to the 100-point composite (weight × sub-score).
- Cash flow +16.0/30.0
- ARV discount +12.8/15.0
- Appreciation +5.6/10.0
- DSCR +5.0/10.0
- 1% rule +4.4/10.0
- Schools +4.3/10.0
- Livability +3.2/5.0
- Rent growth +2.5/5.0
- Condition / age +2.5/5.0
$159,900
🖨 Deal sheet 📄 Offer letter ✓ Due diligence
Listing remarks MLS
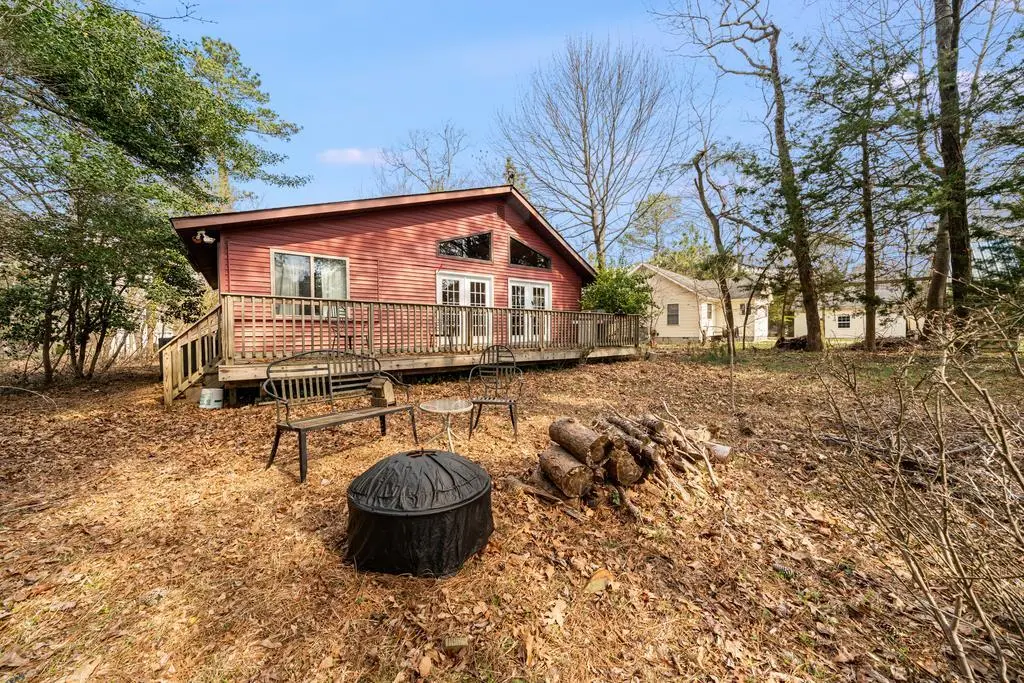
Nestled on the Golf Course in Captain's Cove Golf & Yacht Club, this cozy 2 Bedroom/2 Bath Home offers a rare opportunity to create your idea retreat! With a little over 700 sq ft, this property is perfect for those seeking a manageable footprint with BIG possibilities! Enjoy serene surroundings teeming with wildlife, lovely views of the Golf Course, and peaceful shade trees. Whether you're looking for a weekend getaway, or a renovation project to make your own, this adorable home has so much potential. With its desirable location and unique character, this is your chance to transform a hidden gem into something truly special. Captain's Cove sits on the pristine Chincoteague. Bay only 20 min to Chincoteague Island, and 45 5o OC, MD! Amazing Amenities included! Don't miss out!
Key facts
- Shade trees
- Chincoteague bay
- Amazing amenities
Tags
Neighborhood map
What this means for you Summary
Snapshot
- This is a 1-bed/1.0-bath single-family listed at $160k.
Deal economics
- At list price, monthly cash flow is $80 ($963/yr) — positive.
- The deal already cash-flows at list — no discount required.
- To meet the 1% rule (rent ≥ 1% of price), the offer needs to be $151k (5.7% below list).
- Recommended offer: $150k (6.0% below list) — sets the bar for market timing.
- Cap rate 6.9% vs local median 3.5% in Captains Cove — top-decile yield for the area; either an underpriced asset or a hidden risk that comps aren't pricing in. Stress-test before assuming the spread holds.
Location & tenants
- Location reads 63/100 on livability (#371 in VA) — a middle-class / working-renter tenant base. Strengths: crime A+, cost of living A-, housing A-; Watch: schools F, amenities F, commute F.
- Accomack County Public School District (rural): math 44% / reading 59% proficiency, ranked #99 of 131 in VA (top 76%) — acceptable for families but not a draw, mixed tenant base, ~2y average lease; 63% free/reduced lunch — lower-income household profile, screen leases tightly.
- Market conditions: 303 active listings in the ZIP; 181 units permitted in Accomack County in 2024 (0 in 5+ unit buildings).
Forward outlook
- In year one you build about $3k of equity ($1k loan paydown + $2k appreciation (1.2% local appreciation)).
- Accomack County population projected at -14% by 2050 — secular population decline; favor cash flow + early exit over multi-decade hold.
- At projected returns (1.2% appreciation + 3.0% rent growth), your $45k cash investment doubles in ~8 years — after that, you're playing with house money.
- By year 10, paydown + projected appreciation supports a ~$31k cash-out refi (75% LTV) — recoverable capital for the next deal without selling this one.
Negotiation context
- It's been on market 73 days — a 6% lower offer ($150k) is reasonable based on typical stale-listing flexibility.
Risks & watch-outs
- Climate carrying-cost: severe wind risk, 80% chance of damaging wind over 30y; extreme-heat days projected 7→18/yr by 2055 (HVAC capex compounding) — expect insurance premiums to compound above CPI over the hold.
Questions for the listing agent
- It's been on market 73 days. Have you received any prior offers? Is the seller open to a 6% concession, seller financing, or rate buy-down credit?
- What does the HOA fee cover, when was the last increase, and are there any pending special assessments or reserve-fund shortfalls?
- Why hasn't it sold? Are there any deal-killer items the seller is aware of (foundation, flood, title, zoning, code violations)?
- Is there a deadline driving the sale (1031 exchange, divorce, estate, relocation)? That informs how much negotiation room exists.
- Schools are F-rated, which usually means shorter tenancies and higher turnover. Who's the typical renter profile here, and what's been the actual vacancy rate?
- What's the average days-on-market for RENTAL listings here right now (not sales)? A rising rental-DOM trend means longer vacancies and softer asking-rent achievability than the comps imply.
- What's the recent tenant-quality profile in this submarket — average credit score on applications, eviction rate, late-payment / NSF rate, and stable-employment percentage? A property-management company in the area should have these aggregated.
- How much new for-sale + rental construction is in the pipeline within 1–3 miles? Heavy new supply typically softens prices + rents 12–24 months out; constrained supply supports both.
Investment metrics
- 1% rule
- 0.94% ✗
- Cap rate
- 6.90%
- Cash-on-cash
- 2.15%
- DSCR
- 1.10
- GRM
- 8.8
CMA / ARV
- ARV (median comp)
- $181,171
- List price
- $159,900
- Delta
- -11.74%
- Verdict
- UNDERPRICED
- Comps
- 8 within 1.0 mi
Show comp detail 1 sale within ~0.75 mi
| Address | Dist | Beds/Ba | Sqft | Sold | Price | $/sf | Match |
|---|---|---|---|---|---|---|---|
| 2754 Jolly Rodger Dr | 0.36mi | 2/1.0 (+1) | 767 (+6%) | 8mo | $235,000 | $306 | 61 |
Match score weights: distance 35% · size 25% · config 20% · recency 20%. Top-matched comps best support the ARV.
Projected returns pro-forma
1.24% appreciation · 3.0% rent growth · sell at horizon
- IRR
- 4.3%
- Equity multiple
- 1.22×
- Total profit
- $9,976
- Equity at exit
- $56,551
- IRR
- 8.5%
- Equity multiple
- 2.07×
- Total profit
- $47,702
- Equity at exit
- $76,693
Cash invested: $44,772 (down + closing). Projections, not guarantees.
Landlord ↔ Tenant lean methodology
- Overall (STATE)
- 55 Moderately Landlord-Leaning
- State Virginia
- 55 Moderately Landlord-Leaning · D+2
- County
- — inherits STATE
- City
- — inherits STATE
ZIP-level market 23356
- Home prices YoY
- 0.7%
- Active inventory
- 303
- Price-to-rent
- 8.8×
Monthly cashflow live
- Estimated rent
- $1,508 medium interval (Pro) →
- Mortgage (P&I)
- −$839
- Tax from tax record
- −$50 /mo · $602/yr
- Insurance
- −$67
- HOA
- −$156
- Vacancy / Maint / Mgmt
- −$317
- Net cashflow
- $80
Break-even live
UW: 25.0% down · 7.5% · 30yr · 1.5% tax · 5.0% vac · 8.0% maint · 8.0% mgmt
Financing live
Cash to close
- Down payment
- $39,975
- Closing costs
- $4,797
- Reserves months
- —
- Total cash needed
- —
Loan-product check · same deal, 3 products live
Conventional
25% down · 7.5% · 30yr
- Down + closing
- —
- Monthly P&I
- —
- Monthly cashflow
- —
- DSCR
- —
- Eligible?
- —
Personal DTI + credit; lowest rate.
DSCR
20% down · 8.5% · 30yr
- Down + closing
- —
- Monthly P&I
- —
- Monthly cashflow
- —
- DSCR
- —
- Eligible?
- —
No personal income docs; deal must DSCR.
Hard money
10% down · 12.0% · 12mo
- Down + closing
- —
- Monthly P&I
- —
- Monthly cashflow
- —
- DSCR
- —
- Eligible?
- —
Short-term bridge; refi at stabilization.
HOA detail
- Monthly dues
- $156 · $1,872/yr
Listing history 17 events
-
2026-06-18days on market $159,900 Active 73 DOM
-
2026-06-17days on market $159,900 Active 72 DOM
-
2026-06-16days on market $159,900 Active 71 DOM
-
2026-06-15days on market $159,900 Active 70 DOM
-
2026-06-15days on market $159,900 Active 69 DOM
-
2026-06-13days on market $159,900 Active 68 DOM
-
2026-06-12days on market $159,900 Active 67 DOM
-
2026-06-09days on market $159,900 Active 64 DOM
-
2026-06-08days on market $159,900 Active 63 DOM
-
2026-06-08days on market $159,900 Active 62 DOM
-
2026-06-07days on market $159,900 Active 61 DOM
-
2026-06-03days on market $159,900 Active 58 DOM
-
2026-06-02days on market $159,900 Active 57 DOM
-
2026-06-01days on market $159,900 Active 56 DOM
-
2026-05-31days on market $159,900 Active 55 DOM
-
2026-05-31status $159,900 Active 54 DOM
-
2026-04-02$159,900 Active 792-char remark
Show marketing remark (792 chars)
Nestled on the Golf Course in Captain's Cove Golf & Yacht Club, this cozy 2 Bedroom/2 Bath Home offers a rare opportunity to create your idea retreat! With a little over 700 sq ft, this property is perfect for those seeking a manageable footprint with BIG possibilities! Enjoy serene surroundings teeming with wildlife, lovely views of the Golf Course, and peaceful shade trees. Whether you're looking for a weekend getaway, or a renovation project to make your own, this adorable home has so much potential. With its desirable location and unique character, this is your chance to transform a hidden gem into something truly special. Captain's Cove sits on the pristine Chincoteague. Bay only 20 min to Chincoteague Island, and 45 5o OC, MD! Amazing Amenities included! Don't miss out!
ⓘ Source: listings_history table (triggers on properties + properties_extension) + one-shot
backfill from property_details.listing_events for pre-trigger history.
Tax reassessment forecast VA · Resets to sale price
- Current annual tax
- $602 · $50/mo
- Projected year-2 tax
- $1,311 · $109/mo
- Expected delta
- +$709/yr (+$59/mo · 117.9%)
ⓘ Screening estimate from a state-policy table — verify with the county assessor before closing.
Climate risk First Street
- Flood 1/10 Low FEMA zone X (unshaded) · 0% chance over 30 yrs
- Wildfire 4/10 Moderate
- Heat 9/10 Extreme 7 d/yr ≥100°F today · 18 d/yr by 30 yrs out
- Wind 8/10 Severe 80% chance of damaging wind over 30 yrs
- Air quality 2/10 Low 0 unhealthy d/yr today · 1 by 30 yrs out
Nearby sold comps map
Loading sold comps map…
Walkable amenities ~0.75 mi
Loading nearby amenities…
Taxation est. · year 1
- Rental income
- $18,100
- − Mortgage interest
- −$8,957
- − Property taxes
- −$602
- − Insurance
- −$800
- − Repairs & maintenance
- −$1,448
- − Management
- −$1,448
- − HOA
- −$1,872
- − Depreciation
- −$4,652
- Taxable loss
- −$1,678
- Est. tax savings @ 24.0%
- +$403
- After-tax cash flow
- $1,366/yr
For passive investors: Depreciation is non-cash, so a rental often shows a tax loss while cash-flowing — sheltering income. Rental losses are passive: they offset passive income freely, and up to $25,000/yr can offset ordinary (W-2) income if you actively participate and your MAGI is under $100k (phasing out to $0 by $150k); unused losses carry forward. On sale, claimed depreciation is recaptured at up to 25%, and gains may owe capital-gains tax (a 1031 exchange can defer both). Figures are a year-1 estimate at your 24.0% rate — not tax advice; consult a CPA.
Schools (NCES district)
- District
- Accomack County Public School District
- NCES district ID
- 5100060
- Math proficiency
- 44% ▼ -36.00%
- Reading proficiency
- 59% ▼ -10.00%
- Median HH income
- $40,348
- Composite
- 43.05/100
- National rank
- #3096
- State rank
- #99 of 131 in VA
Livability — Captains Cove
- Score
- 63/100
- State rank
- #371
- US rank
- #14910
Category grades
Schools grade is shown separately in the Schools card above.
Census & demographics
- Census place
- Captains Cove, VA
- Population (ZIP)
- 1,738
Population outlook (Accomack County) Hauer SSP2
- Today (2025)
- 32,072 people
- By 2030
- 31,425 · -2.0%
- By 2040
- 29,685 · -7.4%
- By 2050
- 27,748 · -13.5%
- By 2075
- 23,396 · -27.1%
- By 2100
- 18,774 · -41.5%
Race, ethnicity, and origin ACS 2023
- Neighborhood character
- Predominantly White (98%)
- Race & ethnicity
- White 98%
- Common ancestry
- Romanian 9% Slovak 6% Subsaharan African 2%
- Languages at home
- 97% English-only · Russian/Polish/Slavic 2% Other Indo-European 2%
Political lean MEDSL · Accomack
- 2024 margin
- R (+13.3) · D 43.0% · R 56.3%
- 2008→2024 swing
- -11.9pp toward R · 2008: -1.4pp · 2024: -13.3pp
- All cycles
- 2024: R+13.3 2020: R+9.4 2016: R+11.7 2012: R+3.5 2008: R+1.4
Not yet ingested
- Civics
- —
Market trends
- HPI YoY
- ▲ 1.24%
- Current HPI
- 191.9035
- Rent YoY
- —
- Metro
- —
- State GDP YoY
- ▲ 2.40%
- F500 in state
- 50
Industry mix (Fortune 500 HQ in VA)
| Industry | F500 HQs | Revenue |
|---|---|---|
| Aerospace / Defense | 4 | $236B |
|
||
| Technology / Defense | 3 | $32B |
|
||
| Financial Services | 2 | $176B |
|
||
| Utilities | 2 | $27B |
|
||
| Insurance | 2 | $25B |
|
||
| Technology | 2 | $15B |
|
||
Price history
1 event — show timeline
- 2026-04-02 Listed $159,900 ESAR
Property tax history
+3.2%/yrLatest (2025): $602 · +10.0% YoY. Source: county tax records.
Cash-flow waterfall
monthlySold comps — $/sqft
last 12 mo · ≤1 miLoading sold comps…