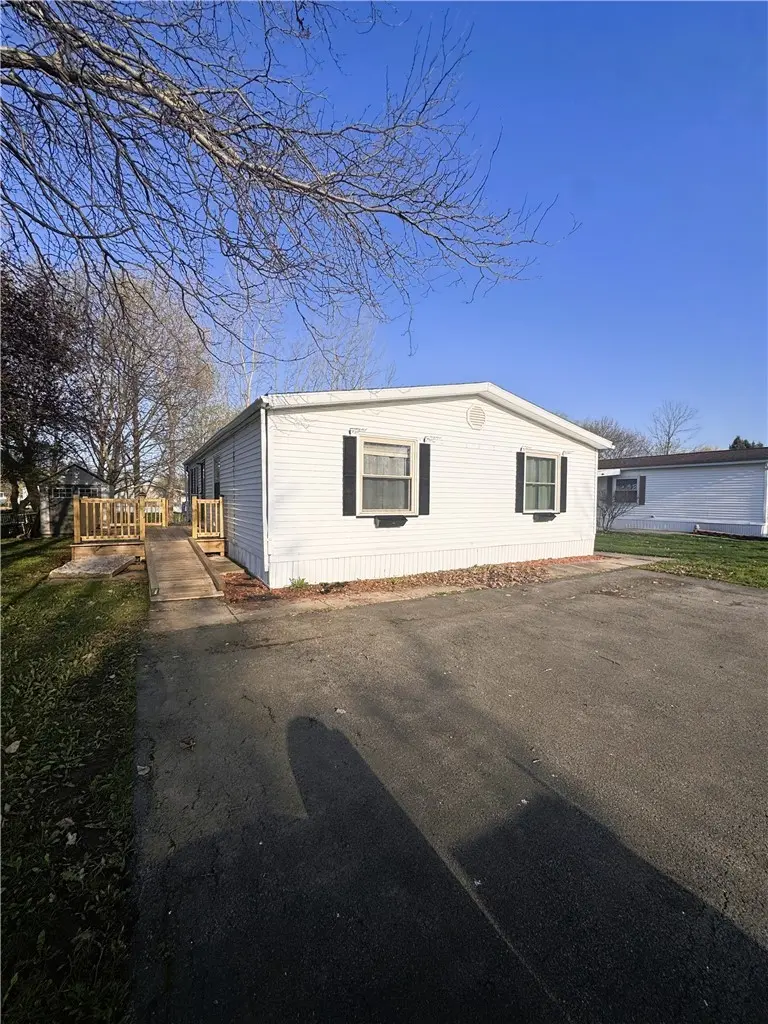
239 Sunset Dr · Holley, NY
Flood risk 1/10 · Minimal
- FEMA flood zone
- —
- Chance of flooding over 30 yrs
- 0.0%
- Est. flood insurance / yr
- —
Fire risk 3/10 · Minor
- Est. fire insurance / yr
- $691 – $1,283
Heat risk 2/10 · Minimal
- Hot days now (above 94°F)
- 7 days/yr
- Hot days in 30 yrs
- 16 days/yr
Wind risk 1/10 · Minimal
- Chance of severe wind over 30 yrs
- —
Air-quality risk 2/10 · Minimal
- Unhealthy air days now
- 1 days/yr
- Unhealthy air days in 30 yrs
- 2 days/yr
Risk factors via First Street. Map © Google.
Why this score? — see what drove the B grade
The composite is a weighted blend of 9 inputs, each scored 0–100. Each bar is that input's sub-score; the figure is the points it added to the 100-point composite (weight × sub-score).
- Cash flow +30.0/30.0
- 1% rule +10.0/10.0
- DSCR +10.0/10.0
- ARV discount +9.6/15.0
- Schools +3.5/10.0
- Livability +3.2/5.0
- Rent growth +2.5/5.0
- Condition / age +2.5/5.0
- Appreciation +0.0/10.0
$49,900
🖨 Deal sheet 📄 Offer letter ✓ Due diligence
Listing remarks
Located in Thomas Estate (Clarendon) Rte 31A, just a few minutes from Brockport (Shopping, Banking, Car Wash, Groceries and more! Come see this charming 3-bedroom 2 bath double wide manufactured home with a fresh new deck and accessibility ramp. Once an offer is accepted, park approval is required. Visit liveheronfalls.com
Key facts
- 4,356 sq ft lot
- Built 1987
- Listed 23 days
Property features AI
Finance
- Financial info: Monthly land lease amount (listed): $713
- HOA & community: Land lease
Exterior
- Parking: No garage
- Utilities: Public water (connected); Sewer available
- Home design: Double-wide mobile home; Single-story; Existing/resale property
- Construction: Vinyl siding
- Exterior features: Blacktop driveway; Deck; Rectangular lot; Private road frontage
Interior
- Kitchen: Gas oven and gas range; Dishwasher; Refrigerator; Eat-in kitchen
- Bedrooms: 3 main-level bedrooms
- Flooring: Carpet; Varies
- Bathrooms: 2 full bathrooms (both on the main level)
- Heating & cooling: Propane heating; Central air conditioning
- Interior features: Accessible approach with ramp; Eat-in kitchen
- Laundry & utility: Main-level laundry; Washer; Dryer; Electric water heater; Propane water heater
Neighborhood map
What this means for you Summary
Snapshot
- This is a 3-bed/2.0-bath manufactured listed at $50k.
Deal economics
- At list price, monthly cash flow is $581 ($7k/yr) — positive.
- The deal already cash-flows at list — no discount required.
- Meets the 1% rule at list price ($1k rent vs $50k).
- Recommended offer: $49k (1.5% below list) — sets the bar for market timing.
- Cap rate 20.3% vs local median 4.4% in Holley — top-decile yield for the area; either an underpriced asset or a hidden risk that comps aren't pricing in. Stress-test before assuming the spread holds.
Location & tenants
- Location reads 65/100 on livability (#705 in NY) — a middle-class / working-renter tenant base. Strengths: cost of living A+, housing A+, crime A-; Watch: schools D, amenities F, commute F.
- Holley Central School District (town): math 38% / reading 44% proficiency, ranked #505 of 590 in NY (top 86%) — families likely to look elsewhere, expect single-tenant / working-renter base with shorter leases.
- Market conditions: 43 active listings in the ZIP; 28 units permitted in Orleans County in 2024 (0 in 5+ unit buildings).
Forward outlook
- Local home prices are declining (-3.0%/yr); year-one equity from $345 of loan paydown is wiped out by about $1k of value loss. Plan a longer hold.
- Orleans County population projected at -20% by 2050 — secular population decline; favor cash flow + early exit over multi-decade hold.
- At projected returns (-3.0% appreciation + 3.0% rent growth), your $14k cash investment doubles in ~3 years — after that, you're playing with house money.
Negotiation context
- It's been on market 23 days — a 2% lower offer ($49k) is reasonable based on typical stale-listing flexibility.
Questions for the listing agent
- Is there a deadline driving the sale (1031 exchange, divorce, estate, relocation)? That informs how much negotiation room exists.
- Schools are D-rated, which usually means shorter tenancies and higher turnover. Who's the typical renter profile here, and what's been the actual vacancy rate?
- What's the average days-on-market for RENTAL listings here right now (not sales)? A rising rental-DOM trend means longer vacancies and softer asking-rent achievability than the comps imply.
- What's the recent tenant-quality profile in this submarket — average credit score on applications, eviction rate, late-payment / NSF rate, and stable-employment percentage? A property-management company in the area should have these aggregated.
- How much new for-sale + rental construction is in the pipeline within 1–3 miles? Heavy new supply typically softens prices + rents 12–24 months out; constrained supply supports both.
Investment metrics
- 1% rule
- 2.30% ✓
- Cap rate
- 20.26%
- Cash-on-cash
- 49.89%
- DSCR
- 3.22
- GRM
- 3.6
CMA / ARV
- ARV (median comp)
- $52,333
- List price
- $49,900
- Delta
- -4.65%
- Verdict
- FAIR
- Comps
- 5 within 1.0 mi
Show comp detail 4 sales within ~0.75 mi
| Address | Dist | Beds/Ba | Sqft | Sold | Price | $/sf | Match |
|---|---|---|---|---|---|---|---|
| 222 Sunset Dr | 0.08mi | 3/2.0 | 1,120 (0%) | 8mo | $69,900 | $62 | 89 |
| 116 Trinity Dr | 0.10mi | 2/2.0 (-1) | 1,022 (-9%) | 8mo | $35,000 | $34 | 69 |
| 951 Cobblestone Ct | 0.48mi | 3/2.0 | 1,056 (-6%) | 9mo | $91,500 | $87 | 61 |
| 267 Sunset Dr | 0.16mi | 2/2.0 (-1) | 980 (-12%) | 8mo | $50,000 | $51 | 60 |
Match score weights: distance 35% · size 25% · config 20% · recency 20%. Top-matched comps best support the ARV.
Projected returns pro-forma
-3.0% appreciation · 3.0% rent growth · sell at horizon
- IRR
- 47.6%
- Equity multiple
- 3.07×
- Total profit
- $28,920
- Equity at exit
- $7,440
- IRR
- 53.3%
- Equity multiple
- 6.21×
- Total profit
- $72,852
- Equity at exit
- $4,314
Cash invested: $13,972 (down + closing). Projections, not guarantees.
Landlord ↔ Tenant lean methodology
- Overall (STATE)
- 15 Strongly Tenant-Friendly
- State New York
- 15 Strongly Tenant-Friendly · D+10
- County
- — inherits STATE
- City
- — inherits STATE
ZIP-level market 14470
- Home prices YoY
- -10.8%
- Active inventory
- 43
- Price-to-rent
- 3.6×
Monthly cashflow live
- Estimated rent
- $1,149 medium interval (Pro) →
- Mortgage (P&I)
- −$262
- Tax from tax record
- −$45 /mo · $534/yr
- Insurance
- −$21
- HOA
- −$0
- Vacancy / Maint / Mgmt
- −$241
- Net cashflow
- $581
Break-even live
UW: 25.0% down · 7.5% · 30yr · 1.5% tax · 5.0% vac · 8.0% maint · 8.0% mgmt
Financing live
Cash to close
- Down payment
- $12,475
- Closing costs
- $1,497
- Reserves months
- —
- Total cash needed
- —
Loan-product check · same deal, 3 products live
Conventional
25% down · 7.5% · 30yr
- Down + closing
- —
- Monthly P&I
- —
- Monthly cashflow
- —
- DSCR
- —
- Eligible?
- —
Personal DTI + credit; lowest rate.
DSCR
20% down · 8.5% · 30yr
- Down + closing
- —
- Monthly P&I
- —
- Monthly cashflow
- —
- DSCR
- —
- Eligible?
- —
No personal income docs; deal must DSCR.
Hard money
10% down · 12.0% · 12mo
- Down + closing
- —
- Monthly P&I
- —
- Monthly cashflow
- —
- DSCR
- —
- Eligible?
- —
Short-term bridge; refi at stabilization.
Listing history 1 events
-
2026-05-05$49,900 Active 324-char remark
ⓘ Source: listings_history table (triggers on properties + properties_extension) + one-shot
backfill from property_details.listing_events for pre-trigger history.
Tax reassessment forecast NY · Partial reset (capped growth)
- Current annual tax
- $534 · $45/mo
- Projected year-2 tax
- $689 · $57/mo
- Expected delta
- +$155/yr (+$13/mo · 28.9%)
ⓘ Screening estimate from a state-policy table — verify with the county assessor before closing.
Climate risk First Street
- Flood 1/10 Low 0% chance over 30 yrs
- Wildfire 3/10 Moderate
- Heat 2/10 Low 7 d/yr ≥94°F today · 16 d/yr by 30 yrs out
- Wind 1/10 Low
- Air quality 2/10 Low 1 unhealthy d/yr today · 2 by 30 yrs out
Nearby sold comps map
Loading sold comps map…
Walkable amenities ~0.75 mi
Loading nearby amenities…
Taxation est. · year 1
- Rental income
- $13,791
- − Mortgage interest
- −$2,795
- − Property taxes
- −$534
- − Insurance
- −$250
- − Repairs & maintenance
- −$1,103
- − Management
- −$1,103
- − Depreciation
- −$1,452
- Taxable income
- $6,554
- Est. tax owed @ 24.0%
- −$1,573
- After-tax cash flow
- $5,398/yr
For passive investors: Depreciation is non-cash, so a rental often shows a tax loss while cash-flowing — sheltering income. Rental losses are passive: they offset passive income freely, and up to $25,000/yr can offset ordinary (W-2) income if you actively participate and your MAGI is under $100k (phasing out to $0 by $150k); unused losses carry forward. On sale, claimed depreciation is recaptured at up to 25%, and gains may owe capital-gains tax (a 1031 exchange can defer both). Figures are a year-1 estimate at your 24.0% rate — not tax advice; consult a CPA.
Schools (NCES district)
- District
- Holley Central School District
- NCES district ID
- 3614610
- Math proficiency
- 38% ▼ -10.00%
- Reading proficiency
- 44% ▲ 2.00%
- Median HH income
- $48,177
- Composite
- 35.13/100
- National rank
- #5013
- State rank
- #505 of 590 in NY
Livability — Holley
- Score
- 65/100
- State rank
- #705
- US rank
- #13281
Category grades
Schools grade is shown separately in the Schools card above.
Census & demographics
- Population (ZIP)
- 7,765
Population outlook (Orleans County) Hauer SSP2
- Today (2025)
- 39,123 people
- By 2030
- 37,648 · -3.8%
- By 2040
- 34,432 · -12.0%
- By 2050
- 31,487 · -19.5%
- By 2075
- 26,544 · -32.2%
- By 2100
- 22,251 · -43.1%
Race, ethnicity, and origin ACS 2023
- Neighborhood character
- Predominantly White (91%)
- Race & ethnicity
- White 91% Two or more races 4% Hispanic / Latino 3% Black 2%
- Common ancestry
- Romanian 4% Iranian 4% Lithuanian 3%
- Foreign-born
- 3% · Canada
- Languages at home
- 97% English-only · Spanish 1% Tagalog/Filipino 1% German/W. Germanic 1%
Political lean MEDSL · Orleans
- 2024 margin
- Solid R (+40.5) · D 29.8% · R 70.2%
- 2008→2024 swing
- -21.8pp toward R · 2008: -18.7pp · 2024: -40.5pp
- All cycles
- 2024: R+40.5 2020: R+36.0 2016: R+43.4 2012: R+19.4 2008: R+18.7
Not yet ingested
- Civics
- —
Market trends
- HPI YoY
- ▼ -34.80%
- Current HPI
- 287.9167
- Rent YoY
- —
- Metro
- —
- State GDP YoY
- ▲ 2.60%
- F500 in state
- 92
Industry mix (Fortune 500 HQ in NY)
| Industry | F500 HQs | Revenue |
|---|---|---|
| Financial Services | 10 | $950B |
|
||
| Consumer Goods | 9 | $162B |
|
||
| Insurance | 4 | $225B |
|
||
| Telecommunications | 2 | $144B |
|
||
| Pharmaceuticals | 2 | $112B |
|
||
| Media / Entertainment | 2 | $69B |
|
||
Price history
2 events — show timeline
- 2026-05-28 Pending — UNYREIS
- 2026-05-05 Listed $49,900 UNYREIS
Property tax history
+13.0%/yrLatest (2025): $534 · +4.5% YoY. Source: county tax records.
Cash-flow waterfall
monthlySold comps — $/sqft
last 12 mo · ≤1 miLoading sold comps…