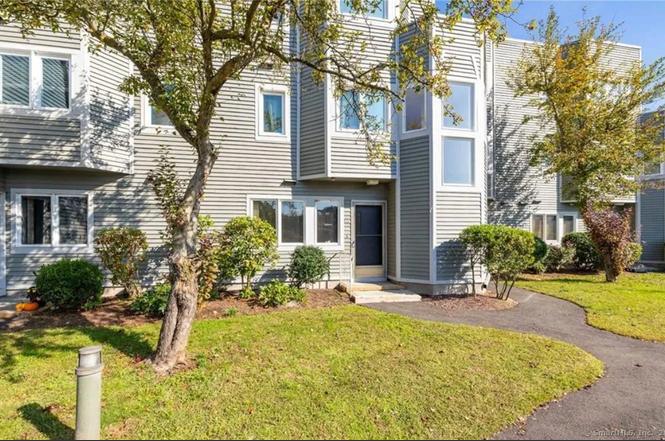
1412 Whitney Ave Apt J1 · North Haven, CT
Flood risk No data
- FEMA flood zone
- —
- Chance of flooding over 30 yrs
- —
- Est. flood insurance / yr
- —
Fire risk No data
- Est. fire insurance / yr
- —
Heat risk No data
- Hot days now (above threshold)
- —
- Hot days in 30 yrs
- —
Wind risk No data
- Chance of severe wind over 30 yrs
- —
Air-quality risk No data
- Unhealthy air days now
- —
- Unhealthy air days in 30 yrs
- —
Risk factors via First Street. Map © Google.
Why this score? — see what drove the B- grade
The composite is a weighted blend of 9 inputs, each scored 0–100. Each bar is that input's sub-score; the figure is the points it added to the 100-point composite (weight × sub-score).
- Cash flow +30.0/30.0
- 1% rule +10.0/10.0
- DSCR +10.0/10.0
- ARV discount +7.5/15.0
- Livability +3.9/5.0
- Schools +3.3/10.0
- Rent growth +2.6/5.0
- Condition / age +2.5/5.0
- Appreciation +0.0/10.0
$105,000
🖨 Deal sheet 📄 Offer letter ✓ Due diligence
Listing remarks
Prime Hamden location just minutes from Yale University, Albertus Magnus College, Southern Connecticut State University, and Downtown New Haven. This condo offers great potential for investors or buyers looking to renovate and customize to their taste. The property requires a complete interior rehab - cash offers or renovation financing only. Excellent opportunity to bring this unit back to life in a desirable and convenient area.
Key facts
- $310 HOA
- Garage
- Built 1987
Tags
Neighborhood map
What this means for you Summary
Snapshot
- This is a 2-bed/2.0-bath condo listed at $105k.
Deal economics
- At list price, monthly cash flow is $645 ($8k/yr) — positive.
- The deal already cash-flows at list — no discount required.
- Meets the 1% rule at list price ($3k rent vs $105k).
- Cap rate 13.7% vs local median 4.0% in North Haven — top-decile yield for the area; either an underpriced asset or a hidden risk that comps aren't pricing in. Stress-test before assuming the spread holds.
Location & tenants
- Location reads 78/100 on livability (#39 in CT, #2,723 nationally) — a middle-class / working-renter tenant base. Strengths: employment A+, housing A+, health & safety A+; Watch: amenities F, commute F, cost of living D-.
- Hamden School District (suburban): math 30% / reading 43% proficiency, ranked #106 of 153 in CT (top 69%) — families likely to look elsewhere, expect single-tenant / working-renter base with shorter leases.
- Zoned schools: Spring Glen School (math 68% / reading 73%, grade A-, #75 of 553 statewide, top 14%, 370 students, 24% FRL); Hamden High School (math 21% / reading 44%, grade F, #125 of 194 statewide, top 66%, 1,672 students, 39% FRL) — zoned schools at 31% FRL track the district average.
- Zoned-school proficiency averages 52% at this address vs 36% district-wide (+15 pts) — the actual schools serving this property are materially stronger than the Hamden School District average implies; a family-tenant draw the district grade alone would hide.
- Market conditions: Rents flat; 84 active listings in the ZIP; 34 comparable units currently listed for rent nearby; rentals leasing fast (median 3d on market — plan ~1-2 weeks tenant-placement turnaround); solid renter incomes; 1,059 units permitted in South Central Connecticut Planning Region in 2024 (779 in 5+ unit buildings).
Forward outlook
- Local home prices are declining (-3.0%/yr); year-one equity from $726 of loan paydown is wiped out by about $3k of value loss. Plan a longer hold.
- At projected returns (-3.0% appreciation + 0.2% rent growth), your $29k cash investment doubles in ~6 years — after that, you're playing with house money.
Negotiation context
- Only 13 days on market — expect competitive offers; lowballing is unlikely to land.
Risks & watch-outs
- Watch-outs: property tax is 4.9% of price.
Questions for the listing agent
- Property tax is high relative to price — has the assessment been appealed recently, and will the sale trigger a re-assessment?
- What does the HOA fee cover, when was the last increase, and are there any pending special assessments or reserve-fund shortfalls?
- Any open or pending special assessments — roof, HVAC, plumbing, elevator, façade? What's the per-unit balance and payoff schedule, and is the seller paying it off at close or rolling it to the buyer?
- Is there a deadline driving the sale (1031 exchange, divorce, estate, relocation)? That informs how much negotiation room exists.
- Schools are A-rated — typically a magnet for longer-tenancy family renters. What's the average tenant stay here, and is there a school-zone premium baked into asking?
- What's the average days-on-market for RENTAL listings here right now (not sales)? A rising rental-DOM trend means longer vacancies and softer asking-rent achievability than the comps imply.
- What's the recent tenant-quality profile in this submarket — average credit score on applications, eviction rate, late-payment / NSF rate, and stable-employment percentage? A property-management company in the area should have these aggregated.
- How much new apartment / multifamily construction is in the pipeline within 1–3 miles? Heavy new supply (>2% of stock underway) typically softens rents 12–24 months out; light construction supports rent growth.
Investment metrics
- 1% rule
- 2.38% ✓
- Cap rate
- 13.67%
- Cash-on-cash
- 26.34%
- DSCR
- 2.17
- GRM
- 3.5
CMA / ARV
No comps found within radius.
Projected returns pro-forma
-3.0% appreciation · 0.21% rent growth · sell at horizon
- IRR
- 15.7%
- Equity multiple
- 1.60×
- Total profit
- $17,660
- Equity at exit
- $15,656
- IRR
- 21.2%
- Equity multiple
- 2.48×
- Total profit
- $43,433
- Equity at exit
- $9,078
Cash invested: $29,400 (down + closing). Projections, not guarantees.
Landlord ↔ Tenant lean methodology
- Overall (STATE)
- 27 Tenant-Leaning
- State Connecticut
- 27 Tenant-Leaning · D+7
- County
- — inherits STATE
- City
- — inherits STATE
ZIP-level market 06517
- Rents YoY
- 0.2%
- Active inventory
- 84
- Price-to-rent
- 3.5×
Monthly cashflow live
- Estimated rent
- $2,504 high interval (Pro) →
- Mortgage (P&I)
- −$551
- Tax from tax record
- −$428 /mo · $5,142/yr
- Insurance
- −$44
- HOA
- −$310
- Vacancy / Maint / Mgmt
- −$526
- Net cashflow
- $645
Break-even live
UW: 25.0% down · 7.5% · 30yr · 1.5% tax · 5.0% vac · 8.0% maint · 8.0% mgmt
Financing live
Cash to close
- Down payment
- $26,250
- Closing costs
- $3,150
- Reserves months
- —
- Total cash needed
- —
Loan-product check · same deal, 3 products live
Conventional
25% down · 7.5% · 30yr
- Down + closing
- —
- Monthly P&I
- —
- Monthly cashflow
- —
- DSCR
- —
- Eligible?
- —
Personal DTI + credit; lowest rate.
DSCR
20% down · 8.5% · 30yr
- Down + closing
- —
- Monthly P&I
- —
- Monthly cashflow
- —
- DSCR
- —
- Eligible?
- —
No personal income docs; deal must DSCR.
Hard money
10% down · 12.0% · 12mo
- Down + closing
- —
- Monthly P&I
- —
- Monthly cashflow
- —
- DSCR
- —
- Eligible?
- —
Short-term bridge; refi at stabilization.
Rent comps 34 comps
| Address | Beds | Baths | Sqft | Rent | $/sqft | DOM | Units | Dist |
|---|---|---|---|---|---|---|---|---|
| 1410 Whitney Ave Unit B2 Hamden, CT | 2.0 | 1.5 | 1338 | $2,600 | $1.94 | 11d | 1 | 0.02mi |
| 64 N Lake Dr Unit C2 Hamden, CT | 3.0 | 2.0 | 1475 | $2,800 | $1.90 | 2d | 1 | 0.22mi |
| 196 Waite St Hamden, CT | 2.0 | 1.0 | 1159 | $2,700 | $2.33 | 21d | 1 | 0.32mi |
| 30 Coram St Unit Coram 30-2 Hamden, CT | 2.0 | 1.0 | 1200 | $2,350 | $1.96 | 2d | 1 | 0.39mi |
| 30 Coram St Unit Coram 30-1 Hamden, CT | 2.0 | 1.0 | 1200 | $2,650 | $2.21 | 2d | 1 | 0.39mi |
| 30 Coram St Unit 1 Hamden, CT | 2.0 | 1.0 | 1200 | $2,650 | $2.21 | 2d | 1 | 0.39mi |
| 30 Coram St Unit 2 Hamden, CT | 2.0 | 1.0 | 1200 | $2,350 | $1.96 | 11d | 1 | 0.39mi |
| 157 Leeder Hill Dr #206 Hamden, CT | 2.0 | 2.5 | 1717 | $3,000 | $1.75 | 2d | 1 | 0.51mi |
| 53 Lilac Ave Hamden, CT | 3.0 | 1.5 | 1427 | $2,800 | $1.96 | 11d | 1 | 0.55mi |
| 53 Turner Ave Hamden, CT | 3.0 | 1.0 | 1172 | $3,600 | $3.07 | 2d | 1 | 0.58mi |
| 1160 Whitney Ave Hamden, CT | 2.0 | 1.0 | 900 | $2,200 | $2.44 | 2d | 1 | 0.59mi |
| 1160 Whitney Ave Apt A Hamden, CT | 2.0 | 1.0 | 900 | $2,100 | $2.33 | 2d | 1 | 0.59mi |
| 1160 Whitney Ave Unit E Hamden, CT | 2.0 | 1.0 | 900 | $2,250 | $2.50 | 43d | 1 | 0.59mi |
| 380 Mather St Hamden, CT | 2.0 | 1.0–2.0 | 867 | $3,175 | $3.66 | 43d | 16 | 0.67mi |
| 365 Mather St #43 Hamden, CT | 2.0 | 2.0 | 1100 | $2,250 | $2.05 | 2d | 1 | 0.68mi |
| 1047 Whitney Ave Hamden, CT | 2.0 | 1.0 | 1000 | $2,000 | $2.00 | 14d | 1 | 0.79mi |
| 1047 Whitney Ave Unit East Hamden, CT | 2.0 | 1.0 | 1000 | $2,000 | $2.00 | 2d | 1 | 0.79mi |
| 38 Grandview Ave Hamden, CT | 3.0 | 1.5 | 1658 | $3,650 | $2.20 | 3d | 1 | 1.03mi |
| 317 Mill Rock Rd Hamden, CT | 3.0 | 2.0 | 1102 | $2,400 | $2.18 | 43d | 1 | 1.04mi |
| 351 Mill Rock Rd Unit 351 Hamden, CT | 3.0 | 1.5 | 1102 | $4,500 | $4.08 | 2d | 1 | 1.06mi |
| 89 Beacon St Unit 2nd Floor Hamden, CT | 3.0 | 1.0 | 1200 | $2,000 | $1.67 | 2d | 1 | 1.11mi |
| 97 Beacon St Unit 3rd fl Hamden, CT | 2.0 | 1.0 | 1100 | $1,850 | $1.68 | 2d | 1 | 1.13mi |
| 97 Beacon St Unit 1st Fl Hamden, CT | 2.0 | 1.0 | 1178 | $2,050 | $1.74 | 2d | 1 | 1.13mi |
| 11 Gorham Ave Hamden, CT | 2.0 | 1.0 | 900 | $1,700 | $1.89 | 2d | 1 | 1.17mi |
| 70 Circular Ave Hamden, CT | 3.0 | 1.0 | 1100 | $2,100 | $1.91 | 2d | 1 | 1.17mi |
| 1166 Dixwell Ave Unit 6 Hamden, CT | 2.0 | 1.0 | 900 | $1,450 | $1.61 | 2d | 1 | 1.23mi |
| 54 Bradley Ave Unit 2 Hamden, CT | 3.0 | 1.0 | 1100 | $1,895 | $1.72 | 43d | 1 | 1.25mi |
| 98 Kaye Vue Dr Hamden, CT | 2.0 | 1.0 | 930 | $1,995 | $2.15 | 21d | 1 | 1.28mi |
| 30 Olds St Hamden, CT | 3.0 | 1.0 | 1248 | $3,500 | $2.80 | 3d | 1 | 1.31mi |
| 130 Woodin St Hamden, CT | 2.0 | 1.0 | 1500 | $2,000 | $1.33 | 43d | 1 | 1.43mi |
| 1887 State St Hamden, CT | 1.0 | 1.0 | 1020 | $1,675 | $1.64 | 2d | 1 | 1.44mi |
| 304 Fairview Ave Hamden, CT | 3.0 | 1.5 | 1140 | $2,700 | $2.37 | 18d | 1 | 1.48mi |
| 1857 State St #3 Hamden, CT | 2.0 | 1.0 | 938 | $1,700 | $1.81 | 2d | 1 | 1.48mi |
| 1857 State St Unit 1 Hamden, CT | 2.0 | 1.0 | 938 | $1,900 | $2.03 | 2d | 1 | 1.48mi |
HOA detail condo
- Monthly dues
- $310 · $3,720/yr
- Assessments
- None detected in remarks — confirm with the listing agent.
Listing history 4 events
-
2025-11-12status Under Contract
-
2025-11-02historical Under Contract - Continue to Show
-
2025-10-28$105,000 Active
-
1988-05-01soldstatus $170,000
ⓘ Source: listings_history table (triggers on properties + properties_extension) + one-shot
backfill from property_details.listing_events for pre-trigger history.
Tax reassessment forecast CT · Partial reset (capped growth)
- Current annual tax
- $5,142 · $428/mo
- Projected year-2 tax
- $5,142 · $428/mo
- Expected delta
- $0/yr ($0/mo · 0.0%)
ⓘ Screening estimate from a state-policy table — verify with the county assessor before closing.
Nearby sold comps map
Loading sold comps map…
Walkable amenities ~0.75 mi
Loading nearby amenities…
Taxation est. · year 1
- Rental income
- $30,049
- − Mortgage interest
- −$5,882
- − Property taxes
- −$5,142
- − Insurance
- −$525
- − Repairs & maintenance
- −$2,404
- − Management
- −$2,404
- − HOA
- −$3,720
- − Depreciation
- −$3,055
- Taxable income
- $6,918
- Est. tax owed @ 24.0%
- −$1,660
- After-tax cash flow
- $6,084/yr
For passive investors: Depreciation is non-cash, so a rental often shows a tax loss while cash-flowing — sheltering income. Rental losses are passive: they offset passive income freely, and up to $25,000/yr can offset ordinary (W-2) income if you actively participate and your MAGI is under $100k (phasing out to $0 by $150k); unused losses carry forward. On sale, claimed depreciation is recaptured at up to 25%, and gains may owe capital-gains tax (a 1031 exchange can defer both). Figures are a year-1 estimate at your 24.0% rate — not tax advice; consult a CPA.
Schools (NCES district)
- District
- Hamden School District
- NCES district ID
- 0901860
- Math proficiency
- 30% ▼ -13.00%
- Reading proficiency
- 43% ▼ -7.00%
- Median HH income
- $68,821
- Composite
- 33.34/100
- National rank
- #5490
- State rank
- #106 of 153 in CT
Livability — North Haven
- Score
- 78/100
- State rank
- #39
- US rank
- #2723
Category grades
Schools grade is shown separately in the Schools card above.
Census & demographics
- County
- New Haven County · 688,236 people
- City population
- 24,527
- Metro
- New Haven-Milford, CT
- Population (ZIP)
- 14,221
- Household income
- $104,550
- Rent vs Own
- Severe rent burden
- 531.0
Population outlook (South Central Connecticut County) Hauer SSP2
- By 2040
- 608,362
Race, ethnicity, and origin ACS 2023
- Neighborhood character
- Diverse neighborhood (Simpson 0.60)
- Race & ethnicity
- White 58% Black 19% Hispanic / Latino 17% Two or more races 7% Asian 2%
- Hispanic origin (detail)
- Puerto Rican 11% Dominican 2%
- Common ancestry
- Romanian 5% Scotch-Irish 2% Lithuanian 2%
- Foreign-born
- 12% · Canada, Jamaica, United Kingdom
- Languages at home
- 80% English-only · Spanish 12% French/Haitian/Cajun 2% Other Indo-European 1%
Political lean MEDSL · South Central Connecticut
- 2024 margin
- Strong D (+20.1) · D 59.0% · R 38.9% · Other 2.1%
- All cycles
- 2024: D+20.1
Not yet ingested
- Civics
- —
Market trends
- HPI YoY
- ▼ -204.00%
- Current HPI
- 255.2756
- Rent YoY
- ▲ 0.21%
- Metro
- New Haven-Milford, CT
- State GDP YoY
- ▲ 1.06%
- F500 in state
- 38
Industry mix (Fortune 500 HQ in CT)
| Industry | F500 HQs | Revenue |
|---|---|---|
| Industrial Machinery | 4 | $38B |
|
||
| Insurance | 3 | $71B |
|
||
| Financial Services | 2 | $25B |
|
||
| Transportation / Logistics | 2 | $18B |
|
||
| Healthcare | 1 | $247B |
|
||
| Telecommunications | 1 | $55B |
|
||
Price history
-38.2% since first listed4 events — show timeline
- 2025-11-12 Pending — Smart MLS
- 2025-11-02 Contingent — Smart MLS
- 2025-10-28 Listed $105,000 Smart MLS
- 1988-05-01 Sold (Public Records) $170,000 Public Records
Property tax history
-0.1%/yrLatest (2023): $5,142 · +1.6% YoY. Source: county tax records.
Cash-flow waterfall
monthlySold comps — $/sqft
last 12 mo · ≤1 miLoading sold comps…