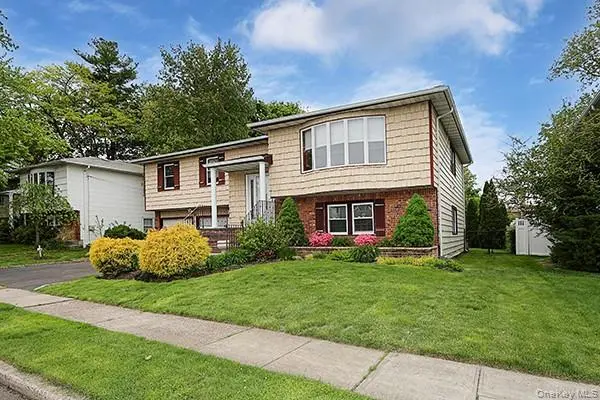
8 Broadfield Pl · Glen Cove, NY
Flood risk 1/10 · Minimal
- FEMA flood zone
- X (unshaded)
- Chance of flooding over 30 yrs
- 0.0%
- Est. flood insurance / yr
- $473 – $860
Fire risk 2/10 · Minimal
- Est. fire insurance / yr
- $691 – $1,283
Heat risk 6/10 · Moderate
- Hot days now (above 97°F)
- 7 days/yr
- Hot days in 30 yrs
- 17 days/yr
Wind risk 6/10 · Moderate
- Chance of severe wind over 30 yrs
- 67.0%
Air-quality risk 5/10 · Moderate
- Unhealthy air days now
- 6 days/yr
- Unhealthy air days in 30 yrs
- 8 days/yr
Risk factors via First Street. Map © Google.
Why this score? — see what drove the D grade
The composite is a weighted blend of 9 inputs, each scored 0–100. Each bar is that input's sub-score; the figure is the points it added to the 100-point composite (weight × sub-score).
- ARV discount +15.0/15.0
- Cash flow +7.9/30.0
- Schools +4.7/10.0
- Rent growth +4.1/5.0
- Livability +3.2/5.0
- Condition / age +2.5/5.0
- DSCR +1.9/10.0
- 1% rule +1.2/10.0
- Appreciation +0.0/10.0
$759,000
🖨 Deal sheet (PDF) 📄 Offer letter ✓ Due diligence
Listing remarks
Welcome to this wonderful mid-block Hi Ranch offering space, comfort, and incredible value! This spacious home features large rooms throughout, including a huge den/living room perfect for entertaining, relaxing or extended living space. The eat-in kitchen offers great functionality with a convenient second staircase leading directly to the recreation room and rear yard, creating an ideal flow for everyday living and gatherings. Enjoy the outdoors in the large backyard complete with a patio, perfect for entertaining or summer enjoyment. Additional highlights include a 2-car garage, 3 full bathrooms, and a spacious primary bedroom with its own full bath. A fantastic opportunity you won't wa
Key facts
- Second staircase
- Recreation room
- Large backyard
Tags
Property features AI
Exterior
- Parking: Attached garage; 2 garage spaces; No carport
- Utilities: Public sewer; Cable connected; Electricity connected
- Home design: Single family residence
- Construction: Aluminum siding construction
- Exterior features: Aluminum siding; Private pool; Not waterfront
Interior
- Kitchen: Dishwasher; Oven
- Bedrooms: Total rooms: 6
- Bathrooms: 3 full bathrooms; 1 half bathroom
- Heating & cooling: Hot water heating; Other heating; Central air conditioning
- Interior features: First-floor bedroom; First-floor full bathroom; Entrance foyer; Formal dining room; Finished basement; Partial attic
Neighborhood map
What this means for you Summary
Snapshot
- This is a 4-bed/2.5-bath single-family listed at $759k.
Deal economics
- At list price, monthly cash flow is $-817 ($-10k/yr) — negative.
- To cash-flow at today's rent, offer at most $615k (19.0% below list).
- To meet the 1% rule (rent ≥ 1% of price), the offer needs to be $473k (37.6% below list).
- Recommended offer: $473k (37.6% below list) — sets the bar for 1% rule.
- Cap rate 5.0% vs local median 3.6% in Glen Cove — top-decile yield for the area; either an underpriced asset or a hidden risk that comps aren't pricing in. Stress-test before assuming the spread holds.
Location & tenants
- Location reads 65/100 on livability (#685 in NY) — a middle-class / working-renter tenant base. Strengths: crime A+, employment A+; Watch: housing C-, amenities F, commute F.
- Glen Cove City School District (suburban): math 50% / reading 55% proficiency, ranked #312 of 590 in NY (top 53%) — acceptable for families but not a draw, mixed tenant base, ~2y average lease.
- Zoned schools: Gribbin School (341 students, 54% FRL); Robert M Finley Middle School (math 43% / reading 47%, grade D, #342 of 729 statewide, top 48%, 710 students, 70% FRL); Glen Cove High School (math 85% / reading 87%, grade A, #347 of 1,100 statewide, top 32%, 1,050 students, 55% FRL).
- Zoned-school proficiency averages 66% at this address vs 52% district-wide (+13 pts) — the actual schools serving this property are materially stronger than the Glen Cove City School District average implies; a family-tenant draw the district grade alone would hide.
- Market conditions: Rents rising fast (+6.4%/yr); 146 active listings in the ZIP; 13 comparable units currently listed for rent nearby; rentals at typical pace (median 21d on market — plan ~3-4 weeks tenant-placement turnaround); solid renter incomes; 824 units permitted in Nassau County in 2024 (153 in 5+ unit buildings).
- At $4,734/mo this rent would consume 61% of the median local household income ($93k/yr) (locally 1667% of renters already pay >50% of income on rent) — very limited rent-growth headroom before tenants either downsize or default.
Forward outlook
- Local home prices are declining (-3.0%/yr); year-one equity from $5k of loan paydown is wiped out by about $23k of value loss. Plan a longer hold.
- Nassau County population projected at +7% by 2050 — modest demand growth; plan on rents tracking national, not racing it.
Negotiation context
- It's been on market 22 days — a 2% lower offer ($748k) is reasonable based on typical stale-listing flexibility.
Risks & watch-outs
- Climate carrying-cost: major wind risk, 67% chance of damaging wind over 30y; extreme-heat days projected 7→17/yr by 2055 (HVAC capex compounding) — expect insurance premiums to compound above CPI over the hold.
Questions for the listing agent
- What do current leases actually rent for vs. the listed asking? Can we see a recent rent roll and the last 12 months of T-12 income?
- Built in 1967 — when were the roof, HVAC, electrical panel, plumbing, and water heater last replaced?
- Is there a deadline driving the sale (1031 exchange, divorce, estate, relocation)? That informs how much negotiation room exists.
- The area grade is low — what's the realistic commute time and amenity access for the typical tenant pool here? Any planned neighborhood developments (good or bad) we should know about?
- What's the average days-on-market for RENTAL listings here right now (not sales)? A rising rental-DOM trend means longer vacancies and softer asking-rent achievability than the comps imply.
- What's the recent tenant-quality profile in this submarket — average credit score on applications, eviction rate, late-payment / NSF rate, and stable-employment percentage? A property-management company in the area should have these aggregated.
- How much new for-sale + rental construction is in the pipeline within 1–3 miles? Heavy new supply typically softens prices + rents 12–24 months out; constrained supply supports both.
Investment metrics
- 1% rule
- 0.62% ✗
- Cap rate
- 5.00%
- Cash-on-cash
- -4.62%
- DSCR
- 0.79
- GRM
- 13.4
CMA / ARV
- ARV (median comp)
- $990,493
- List price
- $759,000
- Delta
- -23.37%
- Verdict
- UNDERPRICED
- Comps
- 20 within 1.0 mi
Show comp detail 12 sales within ~0.75 mi
| Address | Dist | Beds/Ba | Sqft | Sold | Price | $/sf | Match |
|---|---|---|---|---|---|---|---|
| 18 Stirrup Ln | 0.19mi | 4/3.5 | 2,195 (-2%) | 11mo | $999,000 | $455 | 76 |
| 239 Walnut Rd | 0.26mi | 5/2.5 (+1) | 2,249 (+1%) | 8mo | $960,000 | $427 | 74 |
| 25 Hitching Post Ln | 0.27mi | 4/3.0 | 2,349 (+5%) | 3mo | $980,000 | $417 | 74 |
| 21 Hitching Post Ln | 0.29mi | 5/2.5 (+1) | 2,386 (+7%) | 3mo | $760,000 | $319 | 67 |
| 125 Highland Rd | 0.67mi | 4/3.0 | 2,336 (+5%) | 1mo | $1,415,000 | $606 | 58 |
| 24 2nd Ave | 0.47mi | 3/2.0 (-1) | 2,190 (-2%) | 13mo | $800,000 | $365 | 57 |
| 7 Ashleigh Ct | 0.49mi | 4/3.0 | 2,036 (-9%) | 7mo | $900,000 | $442 | 55 |
| 105 Walnut Rd | 0.68mi | 3/2.5 (-1) | 2,162 (-3%) | 11mo | $860,000 | $398 | 49 |
| 7 Avenue B | 0.44mi | 3/2.5 (-1) | 2,486 (+12%) | 8mo | $750,000 | $302 | 49 |
| 15 North Ln | 0.74mi | 4/3.5 | 2,318 (+4%) | 12mo | $1,125,000 | $485 | 45 |
| 9 Bittersweet Ln | 0.52mi | 5/3.0 (+1) | 2,469 (+11%) | 8mo | $880,000 | $356 | 44 |
| 51 Highland Rd | 0.75mi | 3/2.5 (-1) | 2,500 (+12%) | 16mo | $1,400,000 | $560 | 27 |
Match score weights: distance 35% · size 25% · config 20% · recency 20%. Top-matched comps best support the ARV.
Projected returns pro-forma
-3.0% appreciation · 6.43% rent growth · sell at horizon
- IRR
- -21.0%
- Equity multiple
- 0.25×
- Total profit
- $-158,498
- Equity at exit
- $113,169
- IRR
- -8.9%
- Equity multiple
- 0.38×
- Total profit
- $-132,050
- Equity at exit
- $65,624
Cash invested: $212,520 (down + closing). Projections, not guarantees.
Landlord ↔ Tenant lean methodology
- Overall (STATE)
- 15 Strongly Tenant-Friendly
- State New York
- 15 Strongly Tenant-Friendly · D+10
- County
- — inherits STATE
- City
- — inherits STATE
ZIP-level market 11542
- Rents YoY
- 6.4%
- Active inventory
- 146
- Price-to-rent
- 13.4×
Monthly cashflow live
- Estimated rent
- $4,734 high interval (Pro) →
- Mortgage (P&I)
- −$3,980
- Tax from tax record
- −$261 /mo · $3,132/yr
- Insurance
- −$316
- HOA
- −$0
- Lot rent
- −$0
- Vacancy / Maint / Mgmt
- −$994
- Net cashflow
- $-817
Break-even live
Sensitivity live
| Price | -10% $-388 | -5% $-603 | +0% $-817 | +5% $-1,032 | +10% $-1,247 |
|---|---|---|---|---|---|
| Rent | -10% $-1,191 | -5% $-1,004 | +0% $-817 | +5% $-630 | +10% $-443 |
| Rate | -1.0pp $-435 | -0.5pp $-624 | base $-817 | +0.5pp $-1,014 | +1.0pp $-1,214 |
UW: 25.0% down · 7.5% · 30yr · 1.5% tax · 5.0% vac · 8.0% maint · 8.0% mgmt
Financing live
Cash to close
- Down payment
- $189,750
- Closing costs
- $22,770
- Reserves months
- —
- Total cash needed
- —
Loan-product check · same deal, 3 products live
Conventional
25% down · 7.5% · 30yr
- Down + closing
- —
- Monthly P&I
- —
- Monthly cashflow
- —
- DSCR
- —
- Eligible?
- —
Personal DTI + credit; lowest rate.
DSCR
20% down · 8.5% · 30yr
- Down + closing
- —
- Monthly P&I
- —
- Monthly cashflow
- —
- DSCR
- —
- Eligible?
- —
No personal income docs; deal must DSCR.
Hard money
10% down · 12.0% · 12mo
- Down + closing
- —
- Monthly P&I
- —
- Monthly cashflow
- —
- DSCR
- —
- Eligible?
- —
Short-term bridge; refi at stabilization.
Rent comps 13 comps
| Address | Beds | Baths | Sqft | Rent | $/sqft | DOM | Units | Dist |
|---|---|---|---|---|---|---|---|---|
| 118 Forest Ave Glen Cove, NY | 3.0 | 1.5 | 1983 | $3,900 | $1.97 | 46d | 1 | 0.19mi |
| 9 Nassau Rd Unit 1 Glen Cove, NY | 3.0 | 2.5 | 1600 | $4,100 | $2.56 | 21d | 1 | 0.39mi |
| 26 Purdue Rd Glen Cove, NY | 4.0 | 2.0 | 1500 | $4,800 | $3.20 | 27d | 1 | 0.41mi |
| 1 Edgehill Rd Glen Cove, NY | 4.0 | 4.5 | 2500 | $6,300 | $2.52 | 4d | 1 | 0.47mi |
| 63 Franklin Ave Glen Cove, NY | 3.0 | 1.0 | 1817 | $3,400 | $1.87 | 46d | 1 | 0.56mi |
| 21 Franklin Ave Glen Cove, NY | 4.0 | 2.0 | 1467 | $5,400 | $3.68 | 14d | 1 | 0.76mi |
| 18 Park Ave Glen Cove, NY | 3.0 | 2.0 | 1600 | $3,995 | $2.50 | 27d | 1 | 0.83mi |
| 41 S 4th St Locust Valley, NY | 5.0 | 2.5 | 1853 | $6,300 | $3.40 | 17d | 1 | 0.94mi |
| 29 Birch St Locust Valley, NY | 4.0 | 4.0 | 2200 | $6,200 | $2.82 | 46d | 1 | 1.06mi |
| 29 Hendrick Ave Unit B Glen Cove, NY | 3.0 | 1.0 | 1546 | $3,200 | $2.07 | 27d | 1 | 1.10mi |
| 8 Lee Gray Ct Glen Cove, NY | 4.0 | 2.5 | 1900 | $4,800 | $2.53 | 0d | 1 | 1.16mi |
| 21 Continental Pl Unit B Glen Cove, NY | 4.0 | 2.0 | 2819 | $4,950 | $1.76 | 12d | 1 | 1.19mi |
| 32 East Ave Unit 1 Glen Cove, NY | 3.0 | 2.0 | 1800 | $3,650 | $2.03 | 3d | 1 | 1.39mi |
Listing history 7 events
-
2026-06-07status $759,000 Pending 22 DOM
-
2026-06-04days on market $759,000 Active 22 DOM
-
2026-06-03days on market $759,000 Active 21 DOM
-
2026-06-02days on market $759,000 Active 20 DOM
-
2026-06-01days on market $759,000 Active 19 DOM
-
2026-05-31days on market $759,000 Active 18 DOM
-
2026-05-01$759,000 Active 715-char remark
ⓘ Source: listings_history table (triggers on properties + properties_extension) + one-shot
backfill from property_details.listing_events for pre-trigger history.
Tax reassessment forecast NY · Partial reset (capped growth)
- Current annual tax
- $3,132 · $261/mo
- Projected year-2 tax
- $7,980 · $665/mo
- Expected delta
- +$4,847/yr (+$404/mo · 154.7%)
ⓘ Screening estimate from a state-policy table — verify with the county assessor before closing.
Climate risk First Street
- Flood 1/10 Low FEMA zone X (unshaded) · 0% chance over 30 yrs
- Wildfire 2/10 Low
- Heat 6/10 Major 7 d/yr ≥97°F today · 17 d/yr by 30 yrs out
- Wind 6/10 Major 67% chance of damaging wind over 30 yrs
- Air quality 5/10 Major 6 unhealthy d/yr today · 8 by 30 yrs out
Nearby sold comps map
Loading sold comps map…
Walkable amenities ~0.75 mi
Loading nearby amenities…
Taxation est. · year 1
- Rental income
- $56,813
- − Mortgage interest
- −$42,516
- − Property taxes
- −$3,132
- − Insurance
- −$3,795
- − Repairs & maintenance
- −$4,545
- − Management
- −$4,545
- − Depreciation
- −$22,080
- Taxable loss
- −$23,800
- Est. tax savings @ 24.0%
- +$5,712
- After-tax cash flow
- $-4,096/yr
For passive investors: Depreciation is non-cash, so a rental often shows a tax loss while cash-flowing — sheltering income. Rental losses are passive: they offset passive income freely, and up to $25,000/yr can offset ordinary (W-2) income if you actively participate and your MAGI is under $100k (phasing out to $0 by $150k); unused losses carry forward. On sale, claimed depreciation is recaptured at up to 25%, and gains may owe capital-gains tax (a 1031 exchange can defer both). Figures are a year-1 estimate at your 24.0% rate — not tax advice; consult a CPA.
Schools (NCES district)
- District
- Glen Cove City School District
- NCES district ID
- 3612180
- Math proficiency
- 50% ▼ -5.00%
- Reading proficiency
- 55% ▲ 6.00%
- Median HH income
- $70,021
- Composite
- 46.76/100
- National rank
- #2391
- State rank
- #312 of 590 in NY
Livability — Glen Cove
- Score
- 65/100
- State rank
- #685
- US rank
- #12441
Category grades
Schools grade is shown separately in the Schools card above.
Census & demographics
- Census place
- Glen Cove, NY
- County
- Nassau County · 653,051 people
- City population
- 28,965
- Metro
- New York-Newark-Jersey City, NY-NJ-PA
- Population (ZIP)
- 28,965
- Household income
- $93,242
- Rent vs Own
- Severe rent burden
- 1667.0
Population outlook (Nassau County) Hauer SSP2
- Today (2025)
- 1,409,302 people
- By 2030
- 1,431,482 · +1.6%
- By 2040
- 1,471,607 · +4.4%
- By 2050
- 1,502,845 · +6.6%
- By 2075
- 1,575,403 · +11.8%
- By 2100
- 1,554,356 · +10.3%
Race, ethnicity, and origin ACS 2023
- Neighborhood character
- Diverse neighborhood (Simpson 0.57)
- Race & ethnicity
- White 56% Hispanic / Latino 32% Two or more races 14% Asian 5% Black 4%
- Hispanic origin (detail)
- Mexican 2% Puerto Rican 4% Dominican 3%
- Common ancestry
- Romanian 5% Scotch-Irish 2% Italian 1%
- Foreign-born
- 28% · Canada, China, Jamaica
- Languages at home
- 60% English-only · Spanish 27% Other Indo-European 9% Chinese 1%
Political lean MEDSL · Nassau
- 2024 margin
- Toss-up / Even · D 47.9% · R 52.1%
- 2008→2024 swing
- -12.6pp toward R · 2008: 8.4pp · 2024: -4.2pp
- All cycles
- 2024: R+4.2 2020: D+9.5 2016: D+5.3 2012: D+6.7 2008: D+8.4
Not yet ingested
- Civics
- —
Market trends
- HPI YoY
- ▼ -377.99%
- Current HPI
- 275.1903
- Rent YoY
- ▲ 6.43%
- Metro
- New York-Newark-Jersey City, NY-NJ-PA
- State GDP YoY
- ▲ 2.60%
- F500 in state
- 92
Industry mix (Fortune 500 HQ in NY)
| Industry | F500 HQs | Revenue |
|---|---|---|
| Financial Services | 10 | $950B |
|
||
| Consumer Goods | 9 | $162B |
|
||
| Insurance | 4 | $225B |
|
||
| Telecommunications | 2 | $144B |
|
||
| Pharmaceuticals | 2 | $112B |
|
||
| Media / Entertainment | 2 | $69B |
|
||
Price history
2 events — show timeline
- 2026-06-04 Pending — OneKey® MLS as Distributed by MLS Grid
- 2026-05-01 Listed $759,000 OneKey® MLS as Distributed by MLS Grid
Property tax history
-0.2%/yrLatest (2023): $3,132 · +168.9% YoY. Source: county tax records.
Cash-flow waterfall
monthlySold comps — $/sqft
last 12 mo · ≤1 miLoading sold comps…