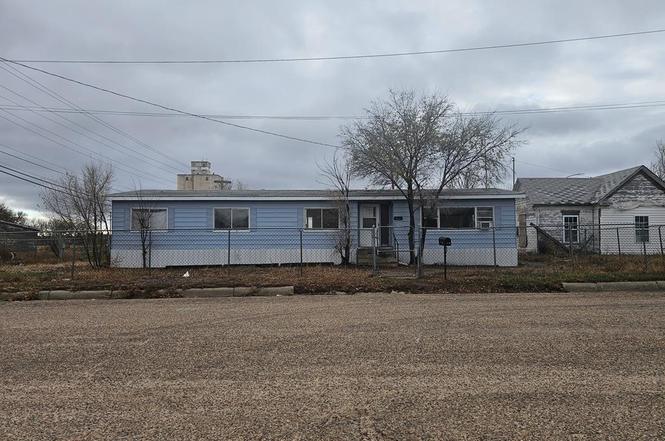
1204 Main St · Springfield, CO
Flood risk No data
- FEMA flood zone
- —
- Chance of flooding over 30 yrs
- —
- Est. flood insurance / yr
- —
Fire risk No data
- Est. fire insurance / yr
- —
Heat risk No data
- Hot days now (above threshold)
- —
- Hot days in 30 yrs
- —
Wind risk No data
- Chance of severe wind over 30 yrs
- —
Air-quality risk No data
- Unhealthy air days now
- —
- Unhealthy air days in 30 yrs
- —
Risk factors via First Street. Map © Google.
Why this score? — see what drove the C- grade
The composite is a weighted blend of 9 inputs, each scored 0–100. Each bar is that input's sub-score; the figure is the points it added to the 100-point composite (weight × sub-score).
- Cash flow +19.5/30.0
- ARV discount +7.5/15.0
- DSCR +6.2/10.0
- 1% rule +5.2/10.0
- Appreciation +5.0/10.0
- Livability +3.3/5.0
- Rent growth +2.5/5.0
- Condition / age +2.5/5.0
- Schools +2.2/10.0
$115,000
🖨 Deal sheet 📄 Offer letter ✓ Due diligence
Listing remarks
PRICE REDUCED! This spacious 3-bedroom, 2-bath home sits on a generously sized lot in a convenient location close to shopping and entertainment. The home features central heating, all major kitchen appliances, and brand-new flooring throughout. Enjoy the fully fenced in front and backyard, along with a great back patio/deck—perfect for relaxing or entertaining. Don't miss out on this great opportunity—call today to schedule your showing!
Key facts
- Central heat
- New flooring
- Back patio deck
Tags
Property features AI
Finance
- HOA & community: No association amenities
Exterior
- Parking: No garage
- Security: Smoke detector(s)
- Utilities: Public water; Public sewer
- Home design: Residential mobile home
- Construction: Frame construction with metal siding; Composition roof
- Exterior features: Patio; Corner lot
Interior
- Kitchen: Range; Oven; Dishwasher; Refrigerator
- Bedrooms: 3 bedrooms on the main level
- Flooring: Vinyl flooring
- Bathrooms: 2 full bathrooms (1 on the main level)
- Heating & cooling: Natural gas forced-air heating; Wall cooling unit(s)
- Interior features: Master bedroom located on the main level; Double-pane windows
- Laundry & utility: Laundry on the main level
Neighborhood map
What this means for you Summary
Snapshot
- This is a 3-bed/2.0-bath other listed at $115k.
Deal economics
- At list price, monthly cash flow is $131 ($2k/yr) — positive.
- The deal already cash-flows at list — no discount required.
- Meets the 1% rule at list price ($1k rent vs $115k).
- Recommended offer: $101k (12.0% below list) — sets the bar for market timing.
Location & tenants
- Location reads 66/100 on livability (#145 in CO) — a middle-class / working-renter tenant base. Strengths: crime A+, cost of living A+, housing A+; Watch: health & safety C-, schools F, amenities F.
- Springfield School District No. Re-4 (rural): math 20% / reading 25% proficiency, ranked #149 of 176 in CO (top 85%) — low school quality limits family demand, transient renter base, plan for 1-2y turnover.
- Market conditions: 15 active listings in the ZIP; 5 units permitted in Baca County in 2024 (0 in 5+ unit buildings).
Forward outlook
- In year one you build about $4k of equity ($795 loan paydown + $3k appreciation (3.0% local appreciation)).
- Baca County population projected at -27% by 2050 — secular population decline; favor cash flow + early exit over multi-decade hold.
- At projected returns (3.0% appreciation + 3.0% rent growth), your $32k cash investment doubles in ~5 years — after that, you're playing with house money.
- By year 8, paydown + projected appreciation supports a ~$31k cash-out refi (75% LTV) — recoverable capital for the next deal without selling this one.
Negotiation context
- It's been on market 279 days — a 12% lower offer ($101k) is reasonable based on typical stale-listing flexibility.
Questions for the listing agent
- It's been on market 279 days. Have you received any prior offers? Is the seller open to a 12% concession, seller financing, or rate buy-down credit?
- Built in 1974 — when were the roof, HVAC, electrical panel, plumbing, and water heater last replaced?
- Why hasn't it sold? Are there any deal-killer items the seller is aware of (foundation, flood, title, zoning, code violations)?
- Is there a deadline driving the sale (1031 exchange, divorce, estate, relocation)? That informs how much negotiation room exists.
- Schools are F-rated, which usually means shorter tenancies and higher turnover. Who's the typical renter profile here, and what's been the actual vacancy rate?
- What's the average days-on-market for RENTAL listings here right now (not sales)? A rising rental-DOM trend means longer vacancies and softer asking-rent achievability than the comps imply.
- What's the recent tenant-quality profile in this submarket — average credit score on applications, eviction rate, late-payment / NSF rate, and stable-employment percentage? A property-management company in the area should have these aggregated.
- How much new for-sale + rental construction is in the pipeline within 1–3 miles? Heavy new supply typically softens prices + rents 12–24 months out; constrained supply supports both.
Investment metrics
- 1% rule
- 1.02% ✓
- Cap rate
- 7.66%
- Cash-on-cash
- 4.87%
- DSCR
- 1.22
- GRM
- 8.2
CMA / ARV
No comps found within radius.
Projected returns pro-forma
3.0% appreciation · 3.0% rent growth · sell at horizon
- IRR
- 12.1%
- Equity multiple
- 1.69×
- Total profit
- $22,198
- Equity at exit
- $51,709
- IRR
- 14.1%
- Equity multiple
- 3.09×
- Total profit
- $67,396
- Equity at exit
- $79,690
Cash invested: $32,200 (down + closing). Projections, not guarantees.
Landlord ↔ Tenant lean methodology
- Overall (STATE)
- 38 Tenant-Leaning
- State Colorado
- 38 Tenant-Leaning · D+4
- County
- — inherits STATE
- City
- — inherits STATE
ZIP-level market 81073
- Active inventory
- 15
- Price-to-rent
- 8.2×
Monthly cashflow live
- Estimated rent
- $1,172 medium interval (Pro) →
- Mortgage (P&I)
- −$603
- Tax est. 1.5%
- −$144 /mo · $1,725/yr
- Insurance
- −$48
- HOA
- −$0
- Vacancy / Maint / Mgmt
- −$246
- Net cashflow
- $131
Break-even live
UW: 25.0% down · 7.5% · 30yr · 1.5% tax · 5.0% vac · 8.0% maint · 8.0% mgmt
Financing live
Cash to close
- Down payment
- $28,750
- Closing costs
- $3,450
- Reserves months
- —
- Total cash needed
- —
Loan-product check · same deal, 3 products live
Conventional
25% down · 7.5% · 30yr
- Down + closing
- —
- Monthly P&I
- —
- Monthly cashflow
- —
- DSCR
- —
- Eligible?
- —
Personal DTI + credit; lowest rate.
DSCR
20% down · 8.5% · 30yr
- Down + closing
- —
- Monthly P&I
- —
- Monthly cashflow
- —
- DSCR
- —
- Eligible?
- —
No personal income docs; deal must DSCR.
Hard money
10% down · 12.0% · 12mo
- Down + closing
- —
- Monthly P&I
- —
- Monthly cashflow
- —
- DSCR
- —
- Eligible?
- —
Short-term bridge; refi at stabilization.
Listing history 17 events
-
2026-06-18days on market $115,000 Active 279 DOM
-
2026-06-17days on market $115,000 Active 278 DOM
-
2026-06-16days on market $115,000 Active 277 DOM
-
2026-06-15days on market $115,000 Active 276 DOM
-
2026-06-13days on market $115,000 Active 274 DOM
-
2026-06-12days on market $115,000 Active 273 DOM
-
2026-06-09days on market $115,000 Active 270 DOM
-
2026-06-08days on market $115,000 Active 269 DOM
-
2026-06-07days on market $115,000 Active 268 DOM
-
2026-06-07days on market $115,000 Active 267 DOM
-
2026-06-04days on market $115,000 Active 264 DOM
-
2026-06-02days on market $115,000 Active 263 DOM
-
2026-06-01days on market $115,000 Active 262 DOM
-
2026-05-31days on market $115,000 Active 261 DOM
-
2026-05-31days on market $115,000 Active 260 DOM
-
2026-03-31price $115,000
-
2025-09-12$135,000 Active
ⓘ Source: listings_history table (triggers on properties + properties_extension) + one-shot
backfill from property_details.listing_events for pre-trigger history.
Nearby sold comps map
Loading sold comps map…
Walkable amenities ~0.75 mi
Loading nearby amenities…
Taxation est. · year 1
- Rental income
- $14,058
- − Mortgage interest
- −$6,442
- − Property taxes
- −$1,725
- − Insurance
- −$575
- − Repairs & maintenance
- −$1,125
- − Management
- −$1,125
- − Depreciation
- −$3,345
- Taxable loss
- −$279
- Est. tax savings @ 24.0%
- +$67
- After-tax cash flow
- $1,636/yr
For passive investors: Depreciation is non-cash, so a rental often shows a tax loss while cash-flowing — sheltering income. Rental losses are passive: they offset passive income freely, and up to $25,000/yr can offset ordinary (W-2) income if you actively participate and your MAGI is under $100k (phasing out to $0 by $150k); unused losses carry forward. On sale, claimed depreciation is recaptured at up to 25%, and gains may owe capital-gains tax (a 1031 exchange can defer both). Figures are a year-1 estimate at your 24.0% rate — not tax advice; consult a CPA.
Schools (NCES district)
- District
- Springfield School District No. Re-4
- NCES district ID
- 0806630
- Math proficiency
- 20% ▲ 5.00%
- Reading proficiency
- 25% ▲ 5.00%
- Median HH income
- $33,541
- Composite
- 21.55/100
- National rank
- #13620
- State rank
- #149 of 176 in CO
Livability — Springfield
- Score
- 66/100
- State rank
- #145
- US rank
- #12006
Category grades
Schools grade is shown separately in the Schools card above.
Census & demographics
- Census place
- Springfield, CO
- Population (ZIP)
- 1,880
Population outlook (Baca County) Hauer SSP2
- Today (2025)
- 3,249 people
- By 2030
- 3,053 · -6.0%
- By 2040
- 2,691 · -17.2%
- By 2050
- 2,362 · -27.3%
- By 2075
- 1,812 · -44.2%
- By 2100
- 1,263 · -61.1%
Race, ethnicity, and origin ACS 2023
- Neighborhood character
- Predominantly White (80%)
- Race & ethnicity
- White 80% Hispanic / Latino 14% Two or more races 5% Asian 4%
- Hispanic origin (detail)
- Mexican 13%
- Common ancestry
- Italian 4% Slovak 2% Serbian 2%
- Foreign-born
- 5% · Canada, Vietnam
- Languages at home
- 94% English-only · Spanish 2% Vietnamese 2% Tagalog/Filipino 1%
Political lean MEDSL · Baca
- 2024 margin
- Solid R (+70.4) · D 13.7% · R 84.1% · Other 2.1%
- 2008→2024 swing
- -22.8pp toward R · 2008: -47.6pp · 2024: -70.4pp
- All cycles
- 2024: R+70.4 2020: R+69.7 2016: R+68.2 2012: R+52.1 2008: R+47.6
Not yet ingested
- Civics
- —
Market trends
- HPI YoY
- —
- Current HPI
- —
- Rent YoY
- —
- Metro
- —
- State GDP YoY
- ▲ 1.95%
- F500 in state
- 14
Industry mix (Fortune 500 HQ in CO)
| Industry | F500 HQs | Revenue |
|---|---|---|
| Technology Distribution | 1 | $31B |
|
||
| Food / Agriculture | 1 | $18B |
|
||
| Packaging | 1 | $14B |
|
||
| Healthcare | 1 | $13B |
|
||
| Energy | 1 | $10B |
|
||
| Technology | 1 | $4B |
|
||
Price history
-14.8% since first listed2 events — show timeline
- 2026-03-31 Price Changed $115,000 PARMLS
- 2025-09-12 Listed $135,000 PARMLS
Property tax history
+3.1%/yrLatest (2021): $52 · -0.8% YoY. Source: county tax records.
Cash-flow waterfall
monthlySold comps — $/sqft
last 12 mo · ≤1 miLoading sold comps…