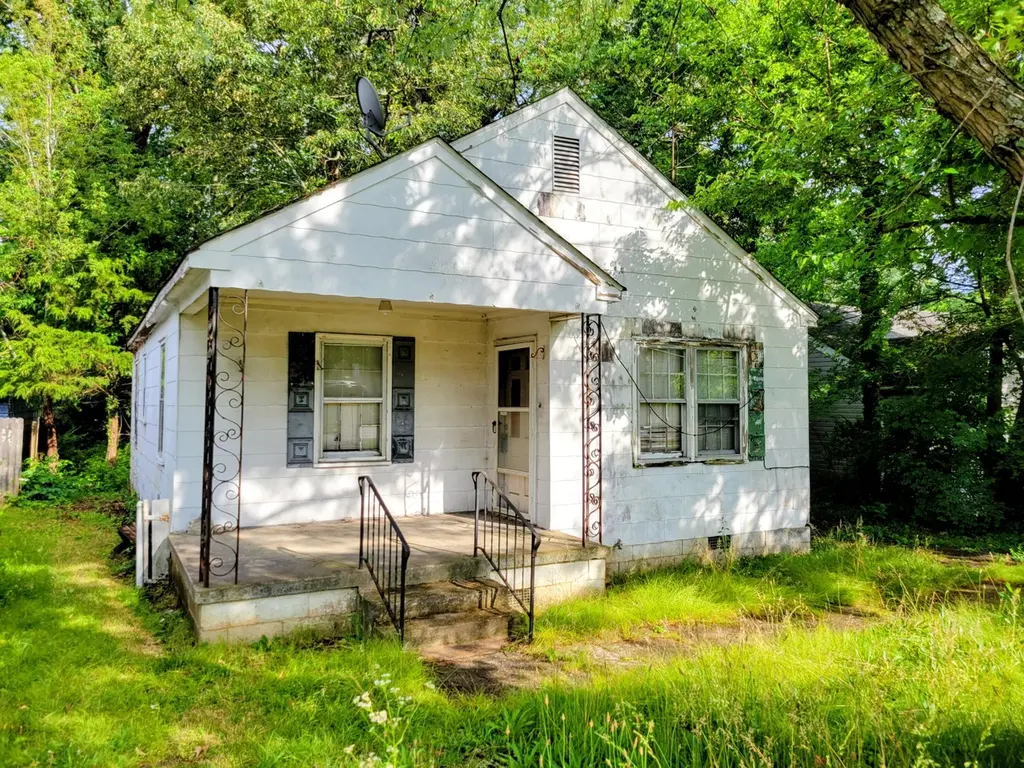
310 S Moore Rd · Chattanooga, TN
Flood risk 6/10 · Moderate
- FEMA flood zone
- X (unshaded)
- Chance of flooding over 30 yrs
- 0.67%
- Est. flood insurance / yr
- $507 – $1,088
Fire risk 1/10 · Minimal
- Est. fire insurance / yr
- $949 – $1,763
Heat risk 6/10 · Moderate
- Hot days now (above 105°F)
- 7 days/yr
- Hot days in 30 yrs
- 19 days/yr
Wind risk 4/10 · Minor
- Chance of severe wind over 30 yrs
- 10.0%
Air-quality risk 3/10 · Minor
- Unhealthy air days now
- 2 days/yr
- Unhealthy air days in 30 yrs
- 2 days/yr
Risk factors via First Street. Map © Google.
Why this score? — see what drove the B- grade
The composite is a weighted blend of 9 inputs, each scored 0–100. Each bar is that input's sub-score; the figure is the points it added to the 100-point composite (weight × sub-score).
- Cash flow +30.0/30.0
- 1% rule +10.0/10.0
- DSCR +10.0/10.0
- ARV discount +7.5/15.0
- Livability +3.9/5.0
- Rent growth +2.7/5.0
- Schools +2.7/10.0
- Condition / age +2.5/5.0
- Appreciation +0.0/10.0
$85,000
🖨 Deal sheet 📄 Offer letter ✓ Due diligence
Listing remarks
Calling all investors! This home is waiting to be brought back to life. Conveniently located on S. Moore Rd with easy access to the I-24 and downtown Chattanooga. Currently the home has 2 bedrooms, a full bathroom, living room, dining room, and kitchen. Real hardwood floors. Contractors might be able to change the floor plan for a possible 3rd bedroom. The garage on site has seen better days. Currently Zoned RN-1-6. Cash buyers should provide proof of funds with all offers for serious consideration. Sold ''AS IS''. Any appliances on site remain. Seller welcomes back up offers. Call today to schedule your private tour!
Key facts
- Real hardwood floors
- Easy access to i-24
- 7,840 sq ft lot
Tags
Property features AI
Finance
- HOA & community: Sidewalks
Exterior
- Parking: Off-street parking; 1-car garage
- Utilities: Public water; Public sewer; Electricity connected; Cable available; Phone available; Water connected; Sewer connected
- Home design: Single-family house; One story; Fixer condition
- Construction: Built with other construction materials; Block foundation; Shingle roof
- Exterior features: Covered front porch; Porch; Back yard; Front yard; Few trees; Level lot; City lot
Interior
- Flooring: Carpet; Hardwood; Linoleum
- Bathrooms: 1 full bathroom
- Heating & cooling: No central cooling
- Interior features: Wood window frames; Crawl space basement; Total of 6 rooms
Neighborhood map
What this means for you Summary
Snapshot
- This is a 2-bed/1.0-bath single-family listed at $85k.
Deal economics
- At list price, monthly cash flow is $524 ($6k/yr) — positive.
- The deal already cash-flows at list — no discount required.
- Meets the 1% rule at list price ($1k rent vs $85k).
- Cap rate 13.7% vs local median 3.4% in Chattanooga — top-decile yield for the area; either an underpriced asset or a hidden risk that comps aren't pricing in. Stress-test before assuming the spread holds.
Location & tenants
- Location reads 78/100 on livability (#3 in TN, #2,582 nationally) — a middle-class / working-renter tenant base. Strengths: amenities A+, commute A+, cost of living A+; Watch: employment D+, crime F.
- Hamilton County (urban): math 31% / reading 31% proficiency, ranked #42 of 139 in TN (top 30%) — families likely to look elsewhere, expect single-tenant / working-renter base with shorter leases.
- Zoned schools: Spring Creek Elementary (math 31% / reading 25%, grade F, #482 of 952 statewide, top 51%, 639 students, 0% FRL); Dalewood Middle School (math 7% / reading 7%, grade F, #278 of 333 statewide, top 85%, 258 students, 0% FRL); Brainerd High School (math 2% / reading 12%, grade F, #294 of 332 statewide, top 91%, 635 students, 0% FRL) — zoned schools average 0% FRL vs 52% district-wide (52 pts lower); this property's tenant base skews higher-income than the district average.
- Zoned-school proficiency averages 14% at this address vs 31% district-wide (-17 pts) — the specific schools serving this property underperform the Hamilton County average; the district grade overstates school quality for this exact location.
- Market conditions: Rents flat; 127 active listings in the ZIP; 19 comparable units currently listed for rent nearby; rentals at typical pace (median 24d on market — plan ~3-4 weeks tenant-placement turnaround); 2,133 units permitted in Hamilton County in 2024 (405 in 5+ unit buildings).
Forward outlook
- Local home prices are declining (-3.0%/yr); year-one equity from $588 of loan paydown is wiped out by about $3k of value loss. Plan a longer hold.
- Hamilton County population projected at +23% by 2050 — long-run rental-demand tailwind backs the buy-and-hold thesis.
- At projected returns (-3.0% appreciation + 0.7% rent growth), your $24k cash investment doubles in ~6 years — after that, you're playing with house money.
Negotiation context
- Only 4 days on market — expect competitive offers; lowballing is unlikely to land.
- Current owner paid $34k; list at $85k implies a 148% gain — meaningful room to come down on a strong offer.
Risks & watch-outs
- Watch-outs: built in 1940 — expect roof / HVAC / electrical / plumbing capex.
- Climate carrying-cost: major flood risk; extreme-heat days projected 7→19/yr by 2055 (HVAC capex compounding) — expect insurance premiums to compound above CPI over the hold.
Questions for the listing agent
- Built in 1940 — when were the roof, HVAC, electrical panel, plumbing, and water heater last replaced?
- Is there a deadline driving the sale (1031 exchange, divorce, estate, relocation)? That informs how much negotiation room exists.
- Schools are F-rated, which usually means shorter tenancies and higher turnover. Who's the typical renter profile here, and what's been the actual vacancy rate?
- Crime grade is F in this area — have there been break-ins, vandalism, or insurance claims at this property in the last 3 years? What carrier currently insures it and at what premium?
- What's the average days-on-market for RENTAL listings here right now (not sales)? A rising rental-DOM trend means longer vacancies and softer asking-rent achievability than the comps imply.
- What's the recent tenant-quality profile in this submarket — average credit score on applications, eviction rate, late-payment / NSF rate, and stable-employment percentage? A property-management company in the area should have these aggregated.
- How much new for-sale + rental construction is in the pipeline within 1–3 miles? Heavy new supply typically softens prices + rents 12–24 months out; constrained supply supports both.
Investment metrics
- 1% rule
- 1.55% ✓
- Cap rate
- 13.69%
- Cash-on-cash
- 26.41%
- DSCR
- 2.18
- GRM
- 5.4
CMA / ARV
- ARV (on-the-fly)
- $191,160
- Comps found
- 3
Show comp detail 3 sales within ~0.75 mi
| Address | Dist | Beds/Ba | Sqft | Sold | Price | $/sf | Match |
|---|---|---|---|---|---|---|---|
| 532 Wando Dr | 0.38mi | 2/1.0 | 870 (-2%) | 7mo | $188,000 | $216 | 74 |
| 310 N St Marks Ave | 0.74mi | 2/1.0 | 883 (-0%) | 14mo | $212,838 | $241 | 54 |
| 904 Sunny Dell Cir | 0.52mi | 3/1.0 (+1) | 1,000 (+13%) | 9mo | $215,000 | $215 | 42 |
Match score weights: distance 35% · size 25% · config 20% · recency 20%. Top-matched comps best support the ARV.
Projected returns pro-forma
-3.0% appreciation · 0.73% rent growth · sell at horizon
- IRR
- 17.8%
- Equity multiple
- 1.70×
- Total profit
- $16,620
- Equity at exit
- $12,674
- IRR
- 24.6%
- Equity multiple
- 2.92×
- Total profit
- $45,796
- Equity at exit
- $7,349
Cash invested: $23,800 (down + closing). Projections, not guarantees.
Landlord ↔ Tenant lean methodology
- Overall (STATE)
- 87 Strongly Landlord-Friendly
- State Tennessee
- 87 Strongly Landlord-Friendly · R+13
- County
- — inherits STATE
- City
- — inherits STATE
ZIP-level market 37411
- Rents YoY
- 0.7%
- Active inventory
- 127
- Price-to-rent
- 5.4×
Monthly cashflow live
- Estimated rent
- $1,318 high interval (Pro) →
- Mortgage (P&I)
- −$446
- Tax from tax record
- −$36 /mo · $432/yr
- Insurance
- −$35
- HOA
- −$0
- Vacancy / Maint / Mgmt
- −$277
- Net cashflow
- $524
Break-even live
UW: 25.0% down · 7.5% · 30yr · 1.5% tax · 5.0% vac · 8.0% maint · 8.0% mgmt
Financing live
Cash to close
- Down payment
- $21,250
- Closing costs
- $2,550
- Reserves months
- —
- Total cash needed
- —
Loan-product check · same deal, 3 products live
Conventional
25% down · 7.5% · 30yr
- Down + closing
- —
- Monthly P&I
- —
- Monthly cashflow
- —
- DSCR
- —
- Eligible?
- —
Personal DTI + credit; lowest rate.
DSCR
20% down · 8.5% · 30yr
- Down + closing
- —
- Monthly P&I
- —
- Monthly cashflow
- —
- DSCR
- —
- Eligible?
- —
No personal income docs; deal must DSCR.
Hard money
10% down · 12.0% · 12mo
- Down + closing
- —
- Monthly P&I
- —
- Monthly cashflow
- —
- DSCR
- —
- Eligible?
- —
Short-term bridge; refi at stabilization.
Rent comps 19 comps
| Address | Beds | Baths | Sqft | Rent | $/sqft | DOM | Units | Dist |
|---|---|---|---|---|---|---|---|---|
| 315 Mcbrien Rd Unit 2 Chattanooga, TN | 2.0 | 2.0 | 1080 | $1,850 | $1.71 | 23d | 1 | 0.30mi |
| 100 Rees Ave Chattanooga, TN | 2.0 | 1.0 | 995 | $1,450 | $1.46 | 23d | 1 | 0.58mi |
| 5307 Marion Ave Chattanooga, TN | 2.0 | 1.0 | 900 | $1,150 | $1.28 | 23d | 1 | 0.75mi |
| 3725 Fountain Ave Chattanooga, TN | 2.0–3.0 | 1.0–2.0 | 1110 | $1,175 | $1.06 | 14d | 4 | 1.05mi |
| 3720 Fountain Ave Chattanooga, TN | 2.0 | 1.0 | 764 | $1,100 | $1.44 | 23d | 1 | 1.08mi |
| 700 N Moore Rd Chattanooga, TN | 2.0 | 1.0 | 800 | $1,399 | $1.75 | 14d | 1 | 1.09mi |
| 5019 Greenview Dr Chattanooga, TN | 2.0 | 1.0 | 768 | $1,200 | $1.56 | 21d | 1 | 1.10mi |
| 506 Sequoia Dr Unit 506 Chattanooga, TN | 3.0 | 2.0 | 945 | $1,400 | $1.48 | 23d | 1 | 1.11mi |
| 3634 Monte Vista Dr Unit 3634 Chattanooga, TN | 1.0 | 1.0 | 728 | $995 | $1.37 | 14d | 1 | 1.20mi |
| 3621 Monte Vista Dr Chattanooga, TN | 2.0 | 1.0 | 725 | $1,200 | $1.66 | 23d | 1 | 1.23mi |
| 4278 Spriggs St Unit 1 Chattanooga, TN | 1.0 | 1.0 | 750 | $795 | $1.06 | 23d | 1 | 1.29mi |
| 400 Alice Dr Unit A Chattanooga, TN | 1.0 | 1.0 | 700 | $999 | $1.43 | 14d | 1 | 1.38mi |
| 406 Alice Dr Unit A Chattanooga, TN | 1.0 | 1.0 | 900 | $999 | $1.11 | 23d | 1 | 1.41mi |
| 831 Darryl Ln Unit 1 East Ridge, TN | 2.0 | 1.0 | 829 | $1,195 | $1.44 | 23d | 1 | 1.42mi |
| 1010 N Larchmont Dr Unit B Chattanooga, TN | 2.0 | 1.0 | 900 | $1,200 | $1.33 | 14d | 1 | 1.43mi |
| 2027 Lee St East Ridge, TN | 2.0 | 1.0 | 655 | $1,275 | $1.95 | 23d | 1 | 1.45mi |
| 708 Henderson Dr Chattanooga, TN | 3.0 | 1.0 | 1100 | $1,250 | $1.14 | 14d | 1 | 1.49mi |
| 1638 Keeble St Unit 1640 Chattanooga, TN | 2.0 | 1.5 | 800 | $1,095 | $1.37 | 23d | 1 | 1.50mi |
| 1640 Keeble St East Ridge, TN | 2.0 | 1.5 | 800 | $1,095 | $1.37 | 23d | 1 | 1.50mi |
Listing history 3 events
-
2026-05-20$85,000 Active
-
1988-12-02soldstatus $34,280
-
1986-08-20soldstatus $30,000
ⓘ Source: listings_history table (triggers on properties + properties_extension) + one-shot
backfill from property_details.listing_events for pre-trigger history.
Tax reassessment forecast TN · Resets to sale price
- Current annual tax
- $432 · $36/mo
- Projected year-2 tax
- $604 · $50/mo
- Expected delta
- +$172/yr (+$14/mo · 39.7%)
ⓘ Screening estimate from a state-policy table — verify with the county assessor before closing.
Climate risk First Street
- Flood 6/10 Major FEMA zone X (unshaded) · 67% chance over 30 yrs
- Wildfire 1/10 Low
- Heat 6/10 Major 7 d/yr ≥105°F today · 19 d/yr by 30 yrs out
- Wind 4/10 Moderate 10% chance of damaging wind over 30 yrs
- Air quality 3/10 Moderate 2 unhealthy d/yr today · 2 by 30 yrs out
Nearby sold comps map
Loading sold comps map…
Walkable amenities ~0.75 mi
Loading nearby amenities…
Taxation est. · year 1
- Rental income
- $15,812
- − Mortgage interest
- −$4,761
- − Property taxes
- −$432
- − Insurance
- −$425
- − Repairs & maintenance
- −$1,265
- − Management
- −$1,265
- − Depreciation
- −$2,473
- Taxable income
- $5,191
- Est. tax owed @ 24.0%
- −$1,246
- After-tax cash flow
- $5,040/yr
For passive investors: Depreciation is non-cash, so a rental often shows a tax loss while cash-flowing — sheltering income. Rental losses are passive: they offset passive income freely, and up to $25,000/yr can offset ordinary (W-2) income if you actively participate and your MAGI is under $100k (phasing out to $0 by $150k); unused losses carry forward. On sale, claimed depreciation is recaptured at up to 25%, and gains may owe capital-gains tax (a 1031 exchange can defer both). Figures are a year-1 estimate at your 24.0% rate — not tax advice; consult a CPA.
Schools (NCES district)
- District
- Hamilton County
- NCES district ID
- 4701590
- Math proficiency
- 31% ▼ -10.00%
- Reading proficiency
- 31% ▼ -3.00%
- Median HH income
- $47,456
- Composite
- 26.8/100
- National rank
- #7122
- State rank
- #42 of 139 in TN
Livability — Chattanooga
- Score
- 78/100
- State rank
- #3
- US rank
- #2582
Category grades
Schools grade is shown separately in the Schools card above.
Census & demographics
- Census place
- Chattanooga, TN
- County
- Hamilton County · 312,777 people
- City population
- 131,999
- Metro
- Chattanooga, TN-GA
- Population (ZIP)
- 18,997
- Household income
- $56,579
- Rent vs Own
- Severe rent burden
- 685.0
Population outlook (Hamilton County) Hauer SSP2
- Today (2025)
- 393,784 people
- By 2030
- 412,983 · +4.9%
- By 2040
- 449,502 · +14.1%
- By 2050
- 484,341 · +23.0%
- By 2075
- 565,746 · +43.7%
- By 2100
- 618,394 · +57.0%
Race, ethnicity, and origin ACS 2023
- Neighborhood character
- Diverse neighborhood (Simpson 0.63)
- Race & ethnicity
- Black 48% White 37% Hispanic / Latino 8% Two or more races 7%
- Hispanic origin (detail)
- Mexican 3% Puerto Rican 2%
- Common ancestry
- Italian 2% Slovak 2% Romanian 1%
- Foreign-born
- 4% · Canada, Vietnam
- Languages at home
- 92% English-only · Spanish 6% Arabic 0%
Political lean MEDSL · Hamilton
- 2024 margin
- R (+13.1) · D 42.7% · R 55.7% · Other 1.6%
- 2008→2024 swing
- -1.2pp toward R · 2008: -11.8pp · 2024: -13.1pp
- All cycles
- 2024: R+13.1 2020: R+9.7 2016: R+16.6 2012: R+14.8 2008: R+11.8
Not yet ingested
- Civics
- —
Market trends
- HPI YoY
- ▼ -190.85%
- Current HPI
- 240.2557
- Rent YoY
- ▲ 0.73%
- Metro
- Chattanooga, TN-GA
- State GDP YoY
- ▲ 2.78%
- F500 in state
- 22
Industry mix (Fortune 500 HQ in TN)
| Industry | F500 HQs | Revenue |
|---|---|---|
| Healthcare | 3 | $91B |
|
||
| Retail | 3 | $72B |
|
||
| Transportation / Logistics | 1 | $88B |
|
||
| Paper / Packaging | 1 | $19B |
|
||
| Insurance | 1 | $13B |
|
||
| Energy | 1 | $12B |
|
||
Price history
+183.3% since first listed3 events — show timeline
- 2026-05-20 Listed $85,000 GCAR
- 1988-12-02 Sold (Public Records) $34,280 Public Records
- 1986-08-20 Sold (Public Records) $30,000 Public Records
Property tax history
+2.3%/yrLatest (2025): $432 · -16.0% YoY. Source: county tax records.
Cash-flow waterfall
monthlySold comps — $/sqft
last 12 mo · ≤1 miLoading sold comps…