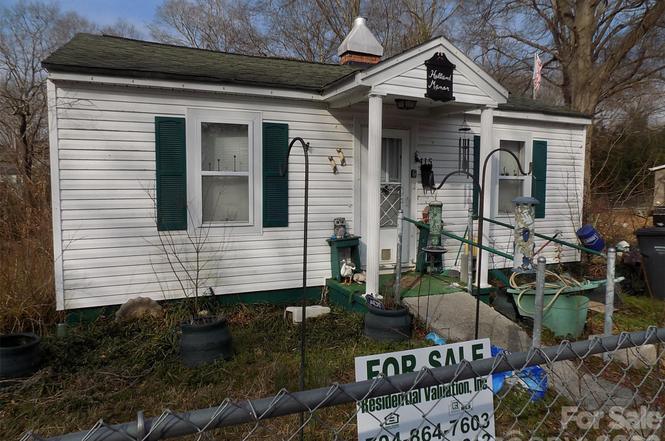
415 S Maple St S · Dallas, NC
Flood risk 1/10 · Minimal
- FEMA flood zone
- X (unshaded)
- Chance of flooding over 30 yrs
- 0.0%
- Est. flood insurance / yr
- $507 – $1,088
Fire risk 1/10 · Minimal
- Est. fire insurance / yr
- $906 – $1,684
Heat risk 6/10 · Moderate
- Hot days now (above 104°F)
- 7 days/yr
- Hot days in 30 yrs
- 17 days/yr
Wind risk 4/10 · Minor
- Chance of severe wind over 30 yrs
- 19.0%
Air-quality risk 3/10 · Minor
- Unhealthy air days now
- 3 days/yr
- Unhealthy air days in 30 yrs
- 3 days/yr
Risk factors via First Street. Map © Google.
Why this score? — see what drove the B grade
The composite is a weighted blend of 9 inputs, each scored 0–100. Each bar is that input's sub-score; the figure is the points it added to the 100-point composite (weight × sub-score).
- Cash flow +30.0/30.0
- ARV discount +15.0/15.0
- DSCR +10.0/10.0
- 1% rule +9.0/10.0
- Schools +3.6/10.0
- Livability +3.2/5.0
- Condition / age +2.5/5.0
- Rent growth +1.1/5.0
- Appreciation +0.0/10.0
$89,500
🖨 Deal sheet (PDF) 📄 Offer letter ✓ Due diligence
Listing remarks
COURT ORDERED SALE. .. .FILE NUMBER SP25 -1732.. .. SOLD "AS IS WHERE IS" . .. .NO DUE DILIGENCE PERIOD. .. FIVE PERCENT DEPOSIT REQUIRED. .. SUBJECT TO COURT APPROVAL AND TEN DAY UPSET BID . .. .FULLY INSPECT PRIOR TO CONTRACT. .. NEEDS COMPLETE REHAB
Key facts
- 0.3 acre lot
- Built 1948
- Listed 90 days
Property features AI
Finance
- HOA & community: No HOA
Exterior
- Parking: On-street parking
- Utilities: City water; Public sewer
- Home design: Single family residence; Residential property; One story
- Construction: Site-built construction; Vinyl exterior; Composition roof; Crawl space foundation; Built on one level
- Exterior features: Chain link fencing; Outbuilding on the property; Road access is publicly maintained (dirt and paved surfaces)
Interior
- Kitchen: Electric range; Refrigerator
- Bedrooms: 2 bedrooms on the main level
- Flooring: Wood flooring
- Bathrooms: 1 full bathroom on the main level
- Heating & cooling: Space heater; Window unit(s) for cooling
- Interior features: 4 total rooms; Electric range and refrigerator included
- Laundry & utility: Laundry located in the kitchen
Neighborhood map
What this means for you Summary
Snapshot
- This is a 2-bed/1.0-bath single-family listed at $90k.
Deal economics
- At list price, monthly cash flow is $438 ($5k/yr) — positive.
- The deal already cash-flows at list — no discount required.
- Meets the 1% rule at list price ($1k rent vs $90k).
- Recommended offer: $84k (6.0% below list) — sets the bar for market timing.
- Cap rate 12.2% vs local median 5.3% in Dallas — top-decile yield for the area; either an underpriced asset or a hidden risk that comps aren't pricing in. Stress-test before assuming the spread holds.
Location & tenants
- Location reads 65/100 on livability (#299 in NC) — a middle-class / working-renter tenant base. Strengths: cost of living A+, housing A+; Watch: schools D, amenities F, commute F.
- Gaston County Schools (suburban): math 44% / reading 42% proficiency, ranked #93 of 178 in NC (top 52%) — families likely to look elsewhere, expect single-tenant / working-renter base with shorter leases.
- Market conditions: Rents falling (-5.5%/yr); 94 active listings in the ZIP; 1 comparable units currently listed for rent nearby; 2,069 units permitted in Gaston County in 2024 (142 in 5+ unit buildings).
Forward outlook
- Local home prices are declining (-3.0%/yr); year-one equity from $619 of loan paydown is wiped out by about $3k of value loss. Plan a longer hold.
- Gaston County population projected at +12% by 2050 — modest demand growth; plan on rents tracking national, not racing it.
- At projected returns (-3.0% appreciation + 0.0% rent growth), your $25k cash investment doubles in ~8 years — after that, you're playing with house money.
Negotiation context
- It's been on market 90 days — a 6% lower offer ($84k) is reasonable based on typical stale-listing flexibility.
- Current owner paid $45k; list at $90k implies a 99% gain — meaningful room to come down on a strong offer.
Risks & watch-outs
- Watch-outs: built in 1948 — expect roof / HVAC / electrical / plumbing capex.
- Climate carrying-cost: extreme-heat days projected 7→17/yr by 2055 (HVAC capex compounding) — expect insurance premiums to compound above CPI over the hold.
Questions for the listing agent
- It's been on market 90 days. Have you received any prior offers? Is the seller open to a 6% concession, seller financing, or rate buy-down credit?
- Built in 1948 — when were the roof, HVAC, electrical panel, plumbing, and water heater last replaced?
- Why hasn't it sold? Are there any deal-killer items the seller is aware of (foundation, flood, title, zoning, code violations)?
- Is there a deadline driving the sale (1031 exchange, divorce, estate, relocation)? That informs how much negotiation room exists.
- Schools are D-rated, which usually means shorter tenancies and higher turnover. Who's the typical renter profile here, and what's been the actual vacancy rate?
- What's the average days-on-market for RENTAL listings here right now (not sales)? A rising rental-DOM trend means longer vacancies and softer asking-rent achievability than the comps imply.
- What's the recent tenant-quality profile in this submarket — average credit score on applications, eviction rate, late-payment / NSF rate, and stable-employment percentage? A property-management company in the area should have these aggregated.
- How much new for-sale + rental construction is in the pipeline within 1–3 miles? Heavy new supply typically softens prices + rents 12–24 months out; constrained supply supports both.
Investment metrics
- 1% rule
- 1.40% ✓
- Cap rate
- 12.17%
- Cash-on-cash
- 20.98%
- DSCR
- 1.93
- GRM
- 6.0
CMA / ARV
- ARV (on-the-fly)
- $149,800
- Comps found
- 6
Show comp detail 6 sales within ~0.75 mi
| Address | Dist | Beds/Ba | Sqft | Sold | Price | $/sf | Match |
|---|---|---|---|---|---|---|---|
| 415 S Maple St S | 0.00mi | 2/1.0 | 749 (+7%) | 0mo | $80,500 | $107 | 88 |
| 314 S Holland St | 0.16mi | 2/1.0 | 739 (+6%) | 5mo | $175,000 | $237 | 79 |
| 604 S Lorraine St | 0.20mi | 2/1.0 | 774 (+11%) | 6mo | $166,000 | $214 | 68 |
| 306 S Spargo St | 0.53mi | 2/1.0 | 720 (+3%) | 17mo | $177,500 | $247 | 56 |
| 202 S Rhyne St | 0.49mi | 2/1.0 | 672 (-4%) | 23mo | $110,000 | $164 | 51 |
| 501 S Hoyle St | 0.45mi | 3/1.0 (+1) | 768 (+10%) | 14mo | $130,000 | $169 | 46 |
Match score weights: distance 35% · size 25% · config 20% · recency 20%. Top-matched comps best support the ARV.
Projected returns pro-forma
-3.0% appreciation · 0.0% rent growth · sell at horizon
- IRR
- 10.2%
- Equity multiple
- 1.39×
- Total profit
- $9,712
- Equity at exit
- $13,345
- IRR
- 16.8%
- Equity multiple
- 2.20×
- Total profit
- $30,117
- Equity at exit
- $7,738
Cash invested: $25,060 (down + closing). Projections, not guarantees.
Landlord ↔ Tenant lean methodology
- Overall (STATE)
- 85 Strongly Landlord-Friendly
- State North Carolina
- 85 Strongly Landlord-Friendly · R+3
- County
- — inherits STATE
- City
- — inherits STATE
ZIP-level market 28034
- Home prices YoY
- -24.6%
- Rents YoY
- -5.5%
- Active inventory
- 94
- Price-to-rent
- 6.0×
Monthly cashflow live
- Estimated rent
- $1,252 medium interval (Pro) →
- Mortgage (P&I)
- −$469
- Tax from tax record
- −$44 /mo · $533/yr
- Insurance
- −$37
- HOA
- −$0
- Vacancy / Maint / Mgmt
- −$263
- Net cashflow
- $438
Break-even live
Sensitivity live
| Price | -10% $489 | -5% $463 | +0% $438 | +5% $413 | +10% $387 |
|---|---|---|---|---|---|
| Rent | -10% $339 | -5% $389 | +0% $438 | +5% $488 | +10% $537 |
| Rate | -1.0pp $483 | -0.5pp $461 | base $438 | +0.5pp $415 | +1.0pp $391 |
UW: 25.0% down · 7.5% · 30yr · 1.5% tax · 5.0% vac · 8.0% maint · 8.0% mgmt
Financing live
Cash to close
- Down payment
- $22,375
- Closing costs
- $2,685
- Reserves months
- —
- Total cash needed
- —
Loan-product check · same deal, 3 products live
Conventional
25% down · 7.5% · 30yr
- Down + closing
- —
- Monthly P&I
- —
- Monthly cashflow
- —
- DSCR
- —
- Eligible?
- —
Personal DTI + credit; lowest rate.
DSCR
20% down · 8.5% · 30yr
- Down + closing
- —
- Monthly P&I
- —
- Monthly cashflow
- —
- DSCR
- —
- Eligible?
- —
No personal income docs; deal must DSCR.
Hard money
10% down · 12.0% · 12mo
- Down + closing
- —
- Monthly P&I
- —
- Monthly cashflow
- —
- DSCR
- —
- Eligible?
- —
Short-term bridge; refi at stabilization.
Rent comps 1 comps
| Address | Beds | Baths | Sqft | Rent | $/sqft | DOM | Units | Dist |
|---|---|---|---|---|---|---|---|---|
| 203 E Webb St Dallas, NC | 1.0 | 1.0 | 625 | $825 | $1.32 | 22d | 1 | 0.25mi |
Listing history 5 events
-
2026-05-09historical Active Under Contract
-
2026-04-28price $89,500
-
2026-03-18price $95,500
-
2026-02-25$100,600 Active
-
2007-08-17soldstatus $45,000
ⓘ Source: listings_history table (triggers on properties + properties_extension) + one-shot
backfill from property_details.listing_events for pre-trigger history.
Tax reassessment forecast NC · Resets to sale price
- Current annual tax
- $533 · $44/mo
- Projected year-2 tax
- $734 · $61/mo
- Expected delta
- +$201/yr (+$17/mo · 37.6%)
ⓘ Screening estimate from a state-policy table — verify with the county assessor before closing.
Climate risk First Street
- Flood 1/10 Low FEMA zone X (unshaded) · 0% chance over 30 yrs
- Wildfire 1/10 Low
- Heat 6/10 Major 7 d/yr ≥104°F today · 17 d/yr by 30 yrs out
- Wind 4/10 Moderate 19% chance of damaging wind over 30 yrs
- Air quality 3/10 Moderate 3 unhealthy d/yr today · 3 by 30 yrs out
Nearby sold comps map
Loading sold comps map…
Walkable amenities ~0.75 mi
Loading nearby amenities…
Taxation est. · year 1
- Rental income
- $15,026
- − Mortgage interest
- −$5,013
- − Property taxes
- −$533
- − Insurance
- −$448
- − Repairs & maintenance
- −$1,202
- − Management
- −$1,202
- − Depreciation
- −$2,604
- Taxable income
- $4,024
- Est. tax owed @ 24.0%
- −$966
- After-tax cash flow
- $4,292/yr
For passive investors: Depreciation is non-cash, so a rental often shows a tax loss while cash-flowing — sheltering income. Rental losses are passive: they offset passive income freely, and up to $25,000/yr can offset ordinary (W-2) income if you actively participate and your MAGI is under $100k (phasing out to $0 by $150k); unused losses carry forward. On sale, claimed depreciation is recaptured at up to 25%, and gains may owe capital-gains tax (a 1031 exchange can defer both). Figures are a year-1 estimate at your 24.0% rate — not tax advice; consult a CPA.
Schools (NCES district)
- District
- Gaston County Schools
- NCES district ID
- 3701620
- Math proficiency
- 44% ▲ 4.00%
- Reading proficiency
- 42% ▲ 1.00%
- Median HH income
- $43,644
- Composite
- 36.39/100
- National rank
- #4680
- State rank
- #93 of 178 in NC
Livability — Dallas
- Score
- 65/100
- State rank
- #299
- US rank
- #12509
Category grades
Schools grade is shown separately in the Schools card above.
Census & demographics
- Census place
- Dallas, NC
- County
- Gaston County · 201,497 people
- City population
- 18,979
- Metro
- Charlotte-Concord-Gastonia, NC-SC
- Population (ZIP)
- 18,979
- Household income
- $62,083
- Rent vs Own
- Severe rent burden
- 383.0
Population outlook (Gaston County) Hauer SSP2
- Today (2025)
- 230,027 people
- By 2030
- 237,300 · +3.2%
- By 2040
- 249,659 · +8.5%
- By 2050
- 257,806 · +12.1%
- By 2075
- 272,163 · +18.3%
- By 2100
- 268,652 · +16.8%
Race, ethnicity, and origin ACS 2023
- Neighborhood character
- Predominantly White (69%)
- Race & ethnicity
- White 69% Black 16% Hispanic / Latino 9% Two or more races 6% Native American 1%
- Hispanic origin (detail)
- Mexican 2%
- Common ancestry
- Slovak 2% Serbian 2% Italian 1%
- Foreign-born
- 6% · Canada, Jamaica
- Languages at home
- 94% English-only · Spanish 5%
Political lean MEDSL · Gaston
- 2024 margin
- Strong R (+25.0) · D 37.0% · R 62.1%
- 2008→2024 swing
- 0.0pp no change · 2008: -25.0pp · 2024: -25.0pp
- All cycles
- 2024: R+25.0 2020: R+27.8 2016: R+32.1 2012: R+25.6 2008: R+25.0
Not yet ingested
- Civics
- —
Market trends
- HPI YoY
- ▼ -78.58%
- Current HPI
- 241.4021
- Rent YoY
- ▼ -5.47%
- Metro
- Charlotte-Concord-Gastonia, NC-SC
- State GDP YoY
- ▲ 3.28%
- F500 in state
- 26
Industry mix (Fortune 500 HQ in NC)
| Industry | F500 HQs | Revenue |
|---|---|---|
| Financial Services | 2 | $213B |
|
||
| Retail | 2 | $95B |
|
||
| Industrial Conglomerate | 1 | $38B |
|
||
| Metals / Steel | 1 | $35B |
|
||
| Utilities | 1 | $30B |
|
||
| Industrial Machinery | 1 | $19B |
|
||
Price history
+98.9% since first listed5 events — show timeline
- 2026-05-09 Contingent — CANOPYMLS as Distributed by MLS Grid
- 2026-04-28 Price Changed $89,500 CANOPYMLS as Distributed by MLS Grid
- 2026-03-18 Price Changed $95,500 CANOPYMLS as Distributed by MLS Grid
- 2026-02-25 Listed $100,600 CANOPYMLS as Distributed by MLS Grid
- 2007-08-17 Sold (Public Records) $45,000 Public Records
Property tax history
-0.5%/yrLatest (2025): $533 · +1.5% YoY. Source: county tax records.
Cash-flow waterfall
monthlySold comps — $/sqft
last 12 mo · ≤1 miLoading sold comps…