 Duplex
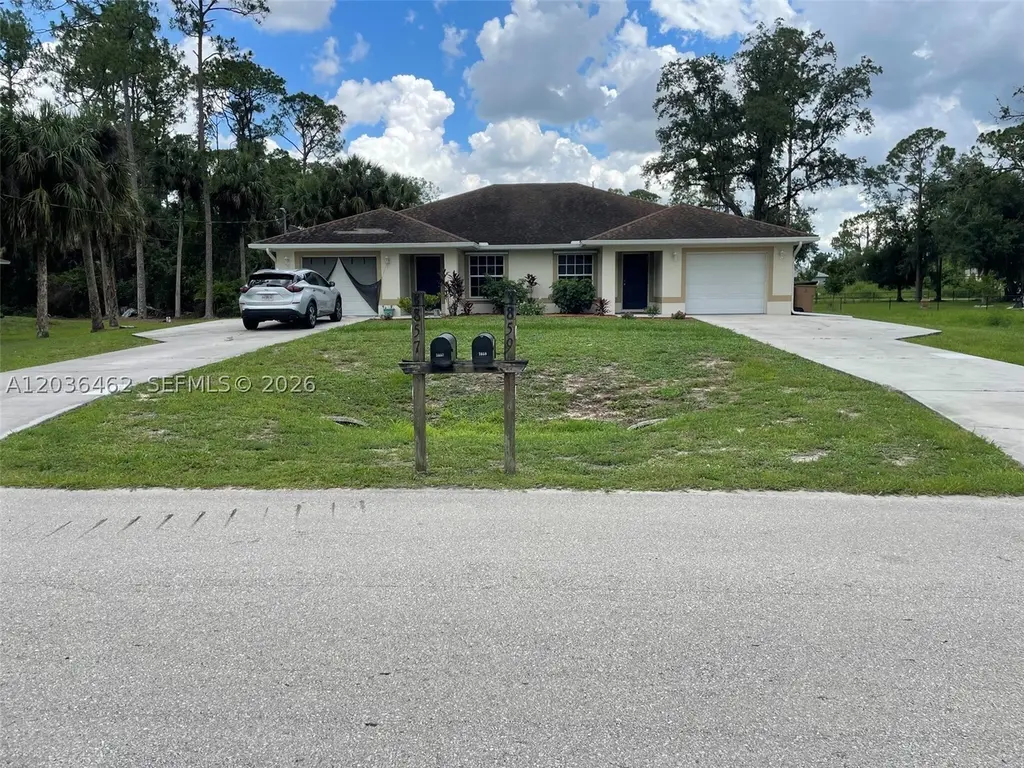
3857 Kittyhawk Dr · Lehigh Acres, FL
Flood risk 1/10 · Minimal
- FEMA flood zone
- X (unshaded)
- Chance of flooding over 30 yrs
- 0.0%
- Est. flood insurance / yr
- $507 – $1,088
Fire risk 4/10 · Minor
- Est. fire insurance / yr
- $947 – $1,759
Heat risk 9/10 · Severe
- Hot days now (above 108°F)
- 6 days/yr
- Hot days in 30 yrs
- 23 days/yr
Wind risk 10/10 · Severe
- Chance of severe wind over 30 yrs
- 99.0%
Air-quality risk 2/10 · Minimal
- Unhealthy air days now
- 1 days/yr
- Unhealthy air days in 30 yrs
- 1 days/yr
Risk factors via First Street. Map © Google.
Why this score? — see what drove the D- grade
The composite is a weighted blend of 9 inputs, each scored 0–100. Each bar is that input's sub-score; the figure is the points it added to the 100-point composite (weight × sub-score).
- Cash flow +12.3/30.0
- ARV discount +7.5/15.0
- Schools +4.1/10.0
- DSCR +3.7/10.0
- 1% rule +3.5/10.0
- Livability +3.0/5.0
- Condition / age +2.8/5.0
- Rent growth +1.8/5.0
- Appreciation +0.0/10.0
$399,800
🖨 Deal sheet 📄 Offer letter ✓ Due diligence
Multi-family units
County records classify this as Multi-Family (2-4 Unit). Listing-text estimate: 2 units. confirmed
Listing remarks
ADORABLE, SPACIOUS UPGRADED 4 BEDROOMS, 4 BATHROOM DUPLEX. LOCATED IN BUCKINGHAM ON APPROXIMATELY 1/3 ACRE. ONE UNIT IS RENTED MONTH TO MONTH. THE SECOND UNIT IS VACANT WITH FULL SIZED WASHER & DRYER. THE RENTED UNIT DOES NOT HAVE A WASHER & DRYER. ORIGINALLY BUILT BY A CONTRACTOR FOR HIS FAMILY!!! THIS IS AN EXCELLENT INVESTMENT INCOME PRODUCING PROPERTY! PERFECT FOR A YOUNG COUPLE OR A RETIRED OR SEMI RETIRED COUPLE. HURRICANE SHUTTERS INCLUDED. HURRICANE GARAGE DOORS. EXTENDED DRIVEWAYS! ALSO INCLUDED: EACH UNIT HAS A WATER SOFTENER AND AERATOR!!
Key facts
- Extended driveways
- Water softener
- 1/3 acre
Tags
Property features AI
Finance
- Financial info: Rent includes gardener and water for applicable rental units; One unit reports $1,300 actual rent and is month-to-month
Exterior
- Parking: Total of 4 parking spaces; Garage parking with automatic garage door opener
- Security: Storm/security shutters; Smoke detectors
- Utilities: Well water; Septic tank; Cable available
- Home design: Duplex; Single-story
- Construction: Block construction; Shingle roof; Resale property
- Exterior features: Quarter- to half-acre lot; Storm/security shutters
Interior
- Kitchen: Kitchen in each unit; Dishwasher; Disposal; Microwave; Range; Refrigerator
- Bedrooms: Two bedrooms in each unit
- Flooring: Laminate flooring; Tile flooring
- Bathrooms: Two full bathrooms in each unit
- Heating & cooling: Central heating (electric); Central air conditioning (electric); Ceiling fans
- Interior features: Metal and single-hung windows; Storm/security shutters; Window coverings included; Smoke detectors; Water softener/filter (owned); Circuit breaker electrical
- Laundry & utility: Washer and dryer in at least one unit; Washer/dryer hookups in units; Electric meter
Neighborhood map
What this means for you Summary
Snapshot
- This is a 2 × 2-bed/2.0-bath units multifamily listed at $400k. Condition is rated average.
Deal economics
- At list price, monthly cash flow is $-70 ($-838/yr) — negative. Per door: $-35/mo.
- To cash-flow at today's rent, offer at most $390k (2.5% below list).
- To meet the 1% rule (rent ≥ 1% of price), the offer needs to be $341k (14.7% below list).
- Recommended offer: $341k (14.7% below list) — sets the bar for 1% rule.
- Cap rate 6.1% vs local median 4.7% in Lehigh Acres — meaningfully above typical; check what's discounted (condition, days-on-market, listing class) to confirm the premium yield is real.
Location & tenants
- Location reads 59/100 on livability (#826 in FL) — a working-class tenant base; expect higher turnover. Strengths: cost of living A+, housing A+; Watch: crime C-, employment D+, schools D-.
- Lee (suburban): math 47% / reading 50% proficiency, ranked #42 of 73 in FL (top 58%) — families likely to look elsewhere, expect single-tenant / working-renter base with shorter leases.
- Market conditions: Rents soft (-3.0%/yr); 763 active listings in the ZIP; 25 comparable units currently listed for rent nearby; rentals at typical pace (median 16d on market — plan ~3-4 weeks tenant-placement turnaround); 15,411 units permitted in Lee County in 2024 (4,686 in 5+ unit buildings).
- At $3,409/mo this rent would consume 57% of the median local household income ($72k/yr) (locally 1358% of renters already pay >50% of income on rent) — very limited rent-growth headroom before tenants either downsize or default.
Forward outlook
- Local home prices are declining (-3.0%/yr); year-one equity from $3k of loan paydown is wiped out by about $12k of value loss. Plan a longer hold.
- Lee County population projected at +44% by 2050 — long-run rental-demand tailwind backs the buy-and-hold thesis.
Negotiation context
- Only 5 days on market — expect competitive offers; lowballing is unlikely to land.
Risks & watch-outs
- Climate carrying-cost: severe wind risk, 99% chance of damaging wind over 30y; extreme-heat days projected 6→23/yr by 2055 (HVAC capex compounding) — expect insurance premiums to compound above CPI over the hold.
Questions for the listing agent
- What do current leases actually rent for vs. the listed asking? Can we see a recent rent roll and the last 12 months of T-12 income?
- Can we see the unit-by-unit rent roll, current vacancy, and any below-market leases? What's the average tenancy length?
- What capital expenditures (roof, boiler, parking lot, exteriors) have been made in the last 5 years, and what's planned in the next 2?
- Is there a deadline driving the sale (1031 exchange, divorce, estate, relocation)? That informs how much negotiation room exists.
- Schools are D-rated, which usually means shorter tenancies and higher turnover. Who's the typical renter profile here, and what's been the actual vacancy rate?
- The area grade is low — what's the realistic commute time and amenity access for the typical tenant pool here? Any planned neighborhood developments (good or bad) we should know about?
- What's the average days-on-market for RENTAL listings here right now (not sales)? A rising rental-DOM trend means longer vacancies and softer asking-rent achievability than the comps imply.
- What's the recent tenant-quality profile in this submarket — average credit score on applications, eviction rate, late-payment / NSF rate, and stable-employment percentage? A property-management company in the area should have these aggregated.
- How much new apartment / multifamily construction is in the pipeline within 1–3 miles? Heavy new supply (>2% of stock underway) typically softens rents 12–24 months out; light construction supports rent growth.
Investment metrics
- 1% rule
- 0.85% ✗
- Cap rate
- 6.08%
- Cash-on-cash
- -0.75%
- DSCR
- 0.97
- GRM
- 9.8
CMA / ARV
No comps found within radius.
Projected returns pro-forma
-3.0% appreciation · 0.0% rent growth · sell at horizon
- IRR
- -20.9%
- Equity multiple
- 0.29×
- Total profit
- $-79,171
- Equity at exit
- $59,611
- IRR
- -23.3%
- Equity multiple
- -0.01×
- Total profit
- $-113,066
- Equity at exit
- $34,567
Cash invested: $111,944 (down + closing). Projections, not guarantees.
Landlord ↔ Tenant lean methodology
- Overall (STATE)
- 87 Strongly Landlord-Friendly
- State Florida
- 87 Strongly Landlord-Friendly · R+3
- County
- — inherits STATE
- City
- — inherits STATE
ZIP-level market 33905
- Home prices YoY
- -31.4%
- Rents YoY
- -3.0%
- Active inventory
- 763
- Price-to-rent
- 19.5×
Monthly cashflow live
- Estimated rent
- $3,409 high interval (Pro) →
- Mortgage (P&I)
- −$2,097
- Tax est. 1.5%
- −$500 /mo · $5,997/yr
- Insurance
- −$167
- HOA
- −$0
- Vacancy / Maint / Mgmt
- −$716
- Net cashflow
- $-70
Break-even live
2-unit breakdown (identical units grouped — click to expand)
| Units | Beds | Baths | Est. rent |
|---|---|---|---|
| 2× units | 2 | 2 | $3,408 |
| #1 | 2 | 2 | $1,704 |
| #2 | 2 | 2 | $1,704 |
| Total (2 units) | $3,409 | ||
UW: 25.0% down · 7.5% · 30yr · 1.5% tax · 5.0% vac · 8.0% maint · 8.0% mgmt
Financing live
Cash to close
- Down payment
- $99,950
- Closing costs
- $11,994
- Reserves months
- —
- Total cash needed
- —
Loan-product check · same deal, 3 products live
Conventional
25% down · 7.5% · 30yr
- Down + closing
- —
- Monthly P&I
- —
- Monthly cashflow
- —
- DSCR
- —
- Eligible?
- —
Personal DTI + credit; lowest rate.
DSCR
20% down · 8.5% · 30yr
- Down + closing
- —
- Monthly P&I
- —
- Monthly cashflow
- —
- DSCR
- —
- Eligible?
- —
No personal income docs; deal must DSCR.
Hard money
10% down · 12.0% · 12mo
- Down + closing
- —
- Monthly P&I
- —
- Monthly cashflow
- —
- DSCR
- —
- Eligible?
- —
Short-term bridge; refi at stabilization.
Rent comps 25 comps
| Address | Beds | Baths | Sqft | Rent | $/sqft | DOM | Units | Dist |
|---|---|---|---|---|---|---|---|---|
| 6125 Hershey Ave Fort Myers, FL | 4.0 | 2.0 | 1879 | $2,700 | $1.44 | 14d | 1 | 0.49mi |
| 14562 Cantabria Dr Fort Myers, FL | 3.0 | 3.0 | 2202 | $2,495 | $1.13 | 23d | 1 | 0.56mi |
| 14638 Cantabria Dr Fort Myers, FL | 3.0 | 3.0 | 1849 | $2,200 | $1.19 | 23d | 1 | 0.59mi |
| 14662 Cantabria Dr Fort Myers, FL | 3.0 | 3.0 | 2202 | $2,400 | $1.09 | 23d | 1 | 0.61mi |
| 6151 Hershey Ave Fort Myers, FL | 3.0 | 2.0 | 1616 | $2,100 | $1.30 | 23d | 1 | 0.62mi |
| 6016 Lindbrook Ave Fort Myers, FL | 3.0 | 2.0 | 1422 | $1,800 | $1.27 | 21d | 1 | 0.76mi |
| 14570 Palamos Cir Fort Myers, FL | 3.0 | 3.0 | 1852 | $2,100 | $1.13 | 14d | 1 | 0.79mi |
| 14570 Palamos Cir Fort Myers, FL | 3.0 | 3.0 | 1852 | $2,100 | $1.13 | 13d | 1 | 0.79mi |
| 14632 Palamos Cir Fort Myers, FL | 4.0 | 3.0 | 2032 | $2,400 | $1.18 | 23d | 1 | 0.83mi |
| 14561 Monrovia Ln Fort Myers, FL | 4.0 | 3.0 | 2032 | $2,300 | $1.13 | 23d | 1 | 0.84mi |
| 6050 Stratton Rd Fort Myers, FL | 3.0 | 2.0 | 1635 | $2,200 | $1.35 | 3d | 1 | 0.87mi |
| 6048 Stratton Rd Fort Myers, FL | 3.0 | 2.0 | 1635 | $2,200 | $1.35 | 3d | 1 | 0.87mi |
| 6108 Stratton Rd Fort Myers, FL | 3.0 | 2.0 | 1635 | $2,200 | $1.35 | 3d | 1 | 0.88mi |
| 14680 Portico Blvd Fort Myers, FL | 3.0 | 3.0 | 1850 | $6,000 | $3.24 | 23d | 1 | 0.89mi |
| 3685 E Hampton Cir Alva, FL | 3.0 | 2.0 | 1675 | $2,200 | $1.31 | 11d | 1 | 1.11mi |
| 3502 72nd St W Lehigh Acres, FL | 4.0 | 2.0 | 1920 | $1,750 | $0.91 | 3d | 1 | 1.16mi |
| 15012 Palamos Cir Fort Myers, FL | 4.0 | 3.0 | 2092 | $3,400 | $1.63 | 23d | 1 | 1.20mi |
| 14060 Vindel Cir Fort Myers, FL | 3.0 | 3.0 | 1852 | $2,700 | $1.46 | 16d | 1 | 1.24mi |
| 14060 Vindel Cir Fort Myers, FL | 3.0 | 3.0 | 1852 | $2,700 | $1.46 | 23d | 1 | 1.24mi |
| 3406 68th St W Lehigh Acres, FL | 3.0 | 2.0 | 1472 | $1,875 | $1.27 | 3d | 1 | 1.26mi |
| 3601 57th St W Lehigh Acres, FL | 3.0 | 2.0 | 1458 | $1,850 | $1.27 | 3d | 1 | 1.26mi |
| 3655 Rain Lily Ln Alva, FL | 4.0 | 2.0 | 1851 | $2,250 | $1.22 | 23d | 1 | 1.27mi |
| 3404 68th St W Lehigh Acres, FL | 3.0 | 2.0 | 1458 | $1,855 | $1.27 | 3d | 1 | 1.27mi |
| 3700 Passion Vine Dr Alva, FL | 4.0 | 2.5 | 2906 | $2,500 | $0.86 | 23d | 1 | 1.44mi |
| 3425 Hampton Blvd Alva, FL | 3.0 | 2.0 | 2140 | $4,900 | $2.29 | 3d | 1 | 1.46mi |
Listing history 6 events
-
2026-06-18days on market $399,800 Active 5 DOM
-
2026-06-17days on market $399,800 Active 4 DOM
-
2026-06-16days on market $399,800 Active 3 DOM
-
2026-06-15days on market $399,800 Active 2 DOM
-
2026-06-13remarks 563-char remark
-
2026-06-13$399,800 Active 1 DOM
ⓘ Source: listings_history table (triggers on properties + properties_extension) + one-shot
backfill from property_details.listing_events for pre-trigger history.
Climate risk First Street
- Flood 1/10 Low FEMA zone X (unshaded) · 0% chance over 30 yrs
- Wildfire 4/10 Moderate
- Heat 9/10 Extreme 6 d/yr ≥108°F today · 23 d/yr by 30 yrs out
- Wind 10/10 Extreme 99% chance of damaging wind over 30 yrs
- Air quality 2/10 Low 1 unhealthy d/yr today · 1 by 30 yrs out
Nearby sold comps map
Loading sold comps map…
Walkable amenities ~0.75 mi
Loading nearby amenities…
Taxation est. · year 1
- Rental income
- $40,908
- − Mortgage interest
- −$22,395
- − Property taxes
- −$5,997
- − Insurance
- −$1,999
- − Repairs & maintenance
- −$3,273
- − Management
- −$3,273
- − Depreciation
- −$11,631
- Taxable loss
- −$7,659
- Est. tax savings @ 24.0%
- +$1,838
- After-tax cash flow
- $1,000/yr
For passive investors: Depreciation is non-cash, so a rental often shows a tax loss while cash-flowing — sheltering income. Rental losses are passive: they offset passive income freely, and up to $25,000/yr can offset ordinary (W-2) income if you actively participate and your MAGI is under $100k (phasing out to $0 by $150k); unused losses carry forward. On sale, claimed depreciation is recaptured at up to 25%, and gains may owe capital-gains tax (a 1031 exchange can defer both). Figures are a year-1 estimate at your 24.0% rate — not tax advice; consult a CPA.
Condition & rehab AI · 12 photos
This property is in average condition with cosmetic updates needed. Simple improvements to landscaping and painting can significantly enhance its value for both resale and rental.
Repairs flagged
- Minor landscaping — simple landscaping improvements needed
- Minor paint — touch-up paint may be needed
Value-add opportunities
- Both painting — Fresh paint enhances curb appeal and interior aesthetics
- Both landscaping — Improved landscaping enhances curb appeal and property value
Renovation cost estimate screening
| Repair item | Severity | Est. cost |
|---|---|---|
| landscaping · simple landscaping improvements needed | Minor | $500–3,000 |
| paint · touch-up paint may be needed | Minor | $500–3,000 |
| Total estimated repair cost · 2 items | $1,000–6,000 |
Value-add ROI direction
- Both painting — Fresh paint enhances curb appeal and interior aesthetics ↑
- Both landscaping — Improved landscaping enhances curb appeal and property value ↑
ⓘ Cost ranges are severity-bucket heuristics (US national rule-of-thumb). Get contractor quotes + a written scope before underwriting a rehab budget.
Schools (NCES district)
- District
- Lee
- NCES district ID
- 1201080
- Math proficiency
- 47% ▼ -11.00%
- Reading proficiency
- 50% ▼ -4.00%
- Median HH income
- $49,518
- Composite
- 41.49/100
- National rank
- #3458
- State rank
- #42 of 73 in FL
Livability — Lehigh Acres
- Score
- 59/100
- State rank
- #826
- US rank
- #20055
Category grades
Schools grade is shown separately in the Schools card above.
Census & demographics
- Census place
- Lehigh Acres, FL
- County
- Lee County · 788,662 people
- Metro
- Cape Coral-Fort Myers, FL
- Population (ZIP)
- 41,381
- Household income
- $71,987
- Rent vs Own
- Severe rent burden
- 1358.0
Population outlook (Lee County) Hauer SSP2
- Today (2025)
- 871,946 people
- By 2030
- 955,468 · +9.6%
- By 2040
- 1,113,587 · +27.7%
- By 2050
- 1,256,891 · +44.1%
- By 2075
- 1,560,270 · +78.9%
- By 2100
- 1,726,848 · +98.0%
Race, ethnicity, and origin ACS 2023
- Neighborhood character
- Diverse neighborhood (Simpson 0.59)
- Race & ethnicity
- White 53% Hispanic / Latino 34% Two or more races 17% Black 9% Native American 4% Asian 2%
- Hispanic origin (detail)
- Mexican 11% Puerto Rican 5% Cuban 2%
- Common ancestry
- Romanian 2% Slovak 2% Lithuanian 2%
- Foreign-born
- 20% · Canada, Jamaica
- Languages at home
- 68% English-only · Spanish 29% Other Indo-European 1% German/W. Germanic 1%
Political lean MEDSL · Lee
- 2024 margin
- Strong R (+28.4) · D 35.5% · R 63.9%
- 2008→2024 swing
- -18.0pp toward R · 2008: -10.4pp · 2024: -28.4pp
- All cycles
- 2024: R+28.4 2020: R+19.2 2016: R+20.4 2012: R+16.6 2008: R+10.4
Not yet ingested
- Civics
- —
Market trends
- HPI YoY
- ▼ -122.89%
- Current HPI
- 268.4598
- Rent YoY
- ▼ -2.97%
- Metro
- Cape Coral-Fort Myers, FL
- State GDP YoY
- ▲ 3.28%
- F500 in state
- 36
Industry mix (Fortune 500 HQ in FL)
| Industry | F500 HQs | Revenue |
|---|---|---|
| Industrial Technology | 2 | $29B |
|
||
| Insurance | 2 | $17B |
|
||
| Retail | 1 | $60B |
|
||
| Technology Distribution | 1 | $58B |
|
||
| Homebuilding | 1 | $35B |
|
||
| Technology Manufacturing | 1 | $35B |
|
||
Price history
+0.1% since first listed2 events — show timeline
- 2026-06-13 Price Changed $399,800 MARMLS
- 2026-06-13 Listed $399,500 MARMLS
Cash-flow waterfall
monthlySold comps — $/sqft
last 12 mo · ≤1 miLoading sold comps…