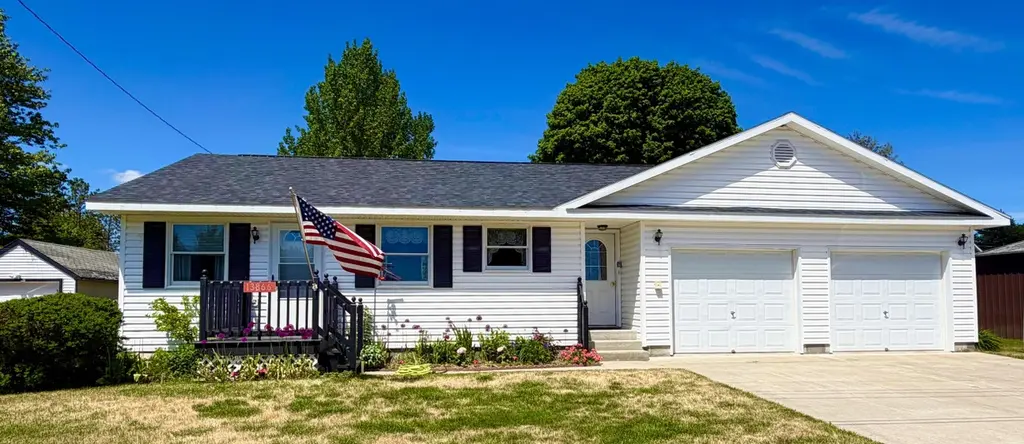
13866 E Willow St · Pentland, MI
Flood risk 1/10 · Minimal
- FEMA flood zone
- —
- Chance of flooding over 30 yrs
- 0.0%
- Est. flood insurance / yr
- —
Fire risk 4/10 · Minor
- Est. fire insurance / yr
- $784 – $1,456
Heat risk 1/10 · Minimal
- Hot days now (above 89°F)
- 7 days/yr
- Hot days in 30 yrs
- 13 days/yr
Wind risk 1/10 · Minimal
- Chance of severe wind over 30 yrs
- —
Air-quality risk 2/10 · Minimal
- Unhealthy air days now
- 0 days/yr
- Unhealthy air days in 30 yrs
- 1 days/yr
Risk factors via First Street. Map © Google.
Why this score? — see what drove the F grade
The composite is a weighted blend of 9 inputs, each scored 0–100. Each bar is that input's sub-score; the figure is the points it added to the 100-point composite (weight × sub-score).
- Cash flow +14.2/30.0
- DSCR +4.3/10.0
- 1% rule +2.8/10.0
- Rent growth +2.5/5.0
- Schools +2.5/10.0
- Livability +2.5/5.0
- Condition / age +2.5/5.0
- ARV discount +0.0/15.0
- Appreciation +0.0/10.0
$166,500
🖨 Deal sheet 📄 Offer letter ✓ Due diligence
Listing remarks
First time on the market! Absolutely spotless home in a great location! This immaculate 2 bedroom 1 1/2 bath home shows like the day it was built. Quality finishes throughout and ready for you to move right in. Spacious eat-in kitchen with appliances included, lovely outdoor covered porch, 2 car attached (24' x 32') garage and storage shed. Lower level has utility area, half bath and a nice family room. The basement is clean and dry with possibility to add additional living space or bedrooms. Natural gas radiant heat and water heater makes for low utility costs. If you enjoy spending time outside, check out the fenced back yard and gorgeous flower gardens surrounding the property. Why rent
Key facts
- Fenced back yard
- Flower gardens
- 7,405 sq ft lot
Tags
Property features AI
Exterior
- Parking: Garage door opener
- Utilities: Public water; Cable available
- Home design: Single-family residence; One level; Residential zoning
- Construction: Vinyl siding; Block foundation; Asphalt roof; Below-grade finished area (partially finished basement)
- Exterior features: Garden; Few trees; Outbuilding and shed(s)
Interior
- Kitchen: Electric range; Range hood; Refrigerator; Dishwasher
- Bathrooms: 1 full bathroom; 1 half bathroom
- Heating & cooling: Baseboard heating; No central cooling
- Interior features: Ceiling fan(s); Window coverings; Double-pane windows; Smoke detector(s)
- Laundry & utility: Washer; Dryer; Laundry in basement; Sump pump in basement
Neighborhood map
What this means for you Summary
Snapshot
- This is a 2-bed/1.5-bath single-family listed at $166k.
Deal economics
- At list price, monthly cash flow is $26 ($317/yr) — positive.
- The deal already cash-flows at list — no discount required.
- To meet the 1% rule (rent ≥ 1% of price), the offer needs to be $130k (21.7% below list).
- Recommended offer: $130k (21.7% below list) — sets the bar for 1% rule.
Location & tenants
- Location reads: area grade F — affects rentability + tenant quality, not the cash-flow math above.
- Tahquamenon Area Schools (town): math 23% / reading 37% proficiency, ranked #374 of 540 in MI (top 69%) — families likely to look elsewhere, expect single-tenant / working-renter base with shorter leases.
- Market conditions: 67 active listings in the ZIP; 9 units permitted in Luce County in 2024 (0 in 5+ unit buildings).
Forward outlook
- Local home prices are declining (-3.0%/yr); year-one equity from $1k of loan paydown is wiped out by about $5k of value loss. Plan a longer hold.
- Luce County population projected at -11% by 2050 — secular population decline; favor cash flow + early exit over multi-decade hold.
Negotiation context
- Only 10 days on market — expect competitive offers; lowballing is unlikely to land.
Questions for the listing agent
- Is there a deadline driving the sale (1031 exchange, divorce, estate, relocation)? That informs how much negotiation room exists.
- The area grade is low — what's the realistic commute time and amenity access for the typical tenant pool here? Any planned neighborhood developments (good or bad) we should know about?
- What's the average days-on-market for RENTAL listings here right now (not sales)? A rising rental-DOM trend means longer vacancies and softer asking-rent achievability than the comps imply.
- What's the recent tenant-quality profile in this submarket — average credit score on applications, eviction rate, late-payment / NSF rate, and stable-employment percentage? A property-management company in the area should have these aggregated.
- How much new for-sale + rental construction is in the pipeline within 1–3 miles? Heavy new supply typically softens prices + rents 12–24 months out; constrained supply supports both.
Investment metrics
- 1% rule
- 0.78% ✗
- Cap rate
- 6.48%
- Cash-on-cash
- 0.68%
- DSCR
- 1.03
- GRM
- 10.6
CMA / ARV
- ARV (on-the-fly)
- $119,700
- Comps found
- 3
Show comp detail 3 sales within ~0.75 mi
| Address | Dist | Beds/Ba | Sqft | Sold | Price | $/sf | Match |
|---|---|---|---|---|---|---|---|
| 13912 Co. Rd. 457 (cherry Hill Dr | 0.16mi | 3/1.5 (+1) | 1,050 (0%) | 23mo | $119,900 | $114 | 68 |
| 13885 E Willow St | 0.03mi | 2/1.5 | 936 (-11%) | 17mo | $130,000 | $139 | 66 |
| 6667 State St | 0.11mi | 3/1.0 (+1) | 895 (-15%) | 16mo | $73,500 | $82 | 50 |
Match score weights: distance 35% · size 25% · config 20% · recency 20%. Top-matched comps best support the ARV.
Projected returns pro-forma
-3.0% appreciation · 3.0% rent growth · sell at horizon
- IRR
- -15.3%
- Equity multiple
- 0.46×
- Total profit
- $-25,370
- Equity at exit
- $24,826
- IRR
- -6.8%
- Equity multiple
- 0.57×
- Total profit
- $-20,215
- Equity at exit
- $14,396
Cash invested: $46,620 (down + closing). Projections, not guarantees.
Landlord ↔ Tenant lean methodology
- Overall (STATE)
- 62 Landlord-Friendly
- State Michigan
- 62 Landlord-Friendly · EVEN
- County
- — inherits STATE
- City
- — inherits STATE
ZIP-level market 49868
- Home prices YoY
- -16.8%
- Active inventory
- 67
- Price-to-rent
- 10.6×
Monthly cashflow live
- Estimated rent
- $1,304 medium interval (Pro) →
- Mortgage (P&I)
- −$873
- Tax from tax record
- −$61 /mo · $731/yr
- Insurance
- −$69
- HOA
- −$0
- Vacancy / Maint / Mgmt
- −$274
- Net cashflow
- $26
Break-even live
UW: 25.0% down · 7.5% · 30yr · 1.5% tax · 5.0% vac · 8.0% maint · 8.0% mgmt
Financing live
Cash to close
- Down payment
- $41,625
- Closing costs
- $4,995
- Reserves months
- —
- Total cash needed
- —
Loan-product check · same deal, 3 products live
Conventional
25% down · 7.5% · 30yr
- Down + closing
- —
- Monthly P&I
- —
- Monthly cashflow
- —
- DSCR
- —
- Eligible?
- —
Personal DTI + credit; lowest rate.
DSCR
20% down · 8.5% · 30yr
- Down + closing
- —
- Monthly P&I
- —
- Monthly cashflow
- —
- DSCR
- —
- Eligible?
- —
No personal income docs; deal must DSCR.
Hard money
10% down · 12.0% · 12mo
- Down + closing
- —
- Monthly P&I
- —
- Monthly cashflow
- —
- DSCR
- —
- Eligible?
- —
Short-term bridge; refi at stabilization.
Listing history 8 events
-
2026-06-18days on market $166,500 Active 10 DOM
-
2026-06-17days on market $166,500 Active 9 DOM
-
2026-06-16days on market $166,500 Active 8 DOM
-
2026-06-15days on market $166,500 Active 7 DOM
-
2026-06-13days on market $166,500 Active 5 DOM
-
2026-06-12days on market $166,500 Active 4 DOM
-
2026-06-09remarks 699-char remark
-
2026-06-09$166,500 Active 1 DOM
ⓘ Source: listings_history table (triggers on properties + properties_extension) + one-shot
backfill from property_details.listing_events for pre-trigger history.
Tax reassessment forecast MI · Partial reset (capped growth)
- Current annual tax
- $731 · $61/mo
- Projected year-2 tax
- $1,647 · $137/mo
- Expected delta
- +$917/yr (+$76/mo · 125.5%)
ⓘ Screening estimate from a state-policy table — verify with the county assessor before closing.
Climate risk First Street
- Flood 1/10 Low 0% chance over 30 yrs
- Wildfire 4/10 Moderate
- Heat 1/10 Low 7 d/yr ≥89°F today · 13 d/yr by 30 yrs out
- Wind 1/10 Low
- Air quality 2/10 Low 0 unhealthy d/yr today · 1 by 30 yrs out
Nearby sold comps map
Loading sold comps map…
Walkable amenities ~0.75 mi
Loading nearby amenities…
Taxation est. · year 1
- Rental income
- $15,642
- − Mortgage interest
- −$9,327
- − Property taxes
- −$731
- − Insurance
- −$832
- − Repairs & maintenance
- −$1,251
- − Management
- −$1,251
- − Depreciation
- −$4,844
- Taxable loss
- −$2,594
- Est. tax savings @ 24.0%
- +$622
- After-tax cash flow
- $939/yr
For passive investors: Depreciation is non-cash, so a rental often shows a tax loss while cash-flowing — sheltering income. Rental losses are passive: they offset passive income freely, and up to $25,000/yr can offset ordinary (W-2) income if you actively participate and your MAGI is under $100k (phasing out to $0 by $150k); unused losses carry forward. On sale, claimed depreciation is recaptured at up to 25%, and gains may owe capital-gains tax (a 1031 exchange can defer both). Figures are a year-1 estimate at your 24.0% rate — not tax advice; consult a CPA.
Schools (NCES district)
- District
- Tahquamenon Area Schools
- NCES district ID
- 2625350
- Math proficiency
- 23% ▼ -1.00%
- Reading proficiency
- 37% ▼ -4.00%
- Median HH income
- $38,217
- Composite
- 25.03/100
- National rank
- #7553
- State rank
- #374 of 540 in MI
Livability — Pentland
No livability data for this city. (Only ~50 U.S. cities are tracked.)
Census & demographics
- Population (ZIP)
- 5,231
Population outlook (Luce County) Hauer SSP2
- Today (2025)
- 6,185 people
- By 2030
- 6,049 · -2.2%
- By 2040
- 5,756 · -6.9%
- By 2050
- 5,481 · -11.4%
- By 2075
- 4,729 · -23.5%
- By 2100
- 3,631 · -41.3%
Race, ethnicity, and origin ACS 2023
- Neighborhood character
- Predominantly White (74%)
- Race & ethnicity
- White 74% Black 10% Native American 8% Two or more races 6% Hispanic / Latino 2%
- Common ancestry
- Romanian 4% Lithuanian 3% Iranian 1%
- Foreign-born
- 1% · Canada
- Languages at home
- 96% English-only · Spanish 2% Arabic 1%
Political lean MEDSL · Luce
- 2024 margin
- Solid R (+46.9) · D 25.8% · R 72.7% · Other 1.5%
- 2008→2024 swing
- -36.0pp toward R · 2008: -10.9pp · 2024: -46.9pp
- All cycles
- 2024: R+46.9 2020: R+42.2 2016: R+41.7 2012: R+22.2 2008: R+10.9
Not yet ingested
- Civics
- —
Market trends
- HPI YoY
- ▼ -26.69%
- Current HPI
- 132.0633
- Rent YoY
- —
- Metro
- —
- State GDP YoY
- ▲ 1.37%
- F500 in state
- 28
Industry mix (Fortune 500 HQ in MI)
| Industry | F500 HQs | Revenue |
|---|---|---|
| Automotive Parts | 3 | $48B |
|
||
| Automotive | 2 | $372B |
|
||
| Chemicals | 1 | $45B |
|
||
| Automotive Retail | 1 | $29B |
|
||
| Healthcare / Medical Devices | 1 | $23B |
|
||
| Automotive Technology | 1 | $20B |
|
||
Price history
1 event — show timeline
- 2026-06-07 Listed $166,500 EUPBR
Property tax history
+15.9%/yrLatest (2016): $731 · +55.6% YoY. Source: county tax records.
Cash-flow waterfall
monthlySold comps — $/sqft
last 12 mo · ≤1 miLoading sold comps…