 14-Plex
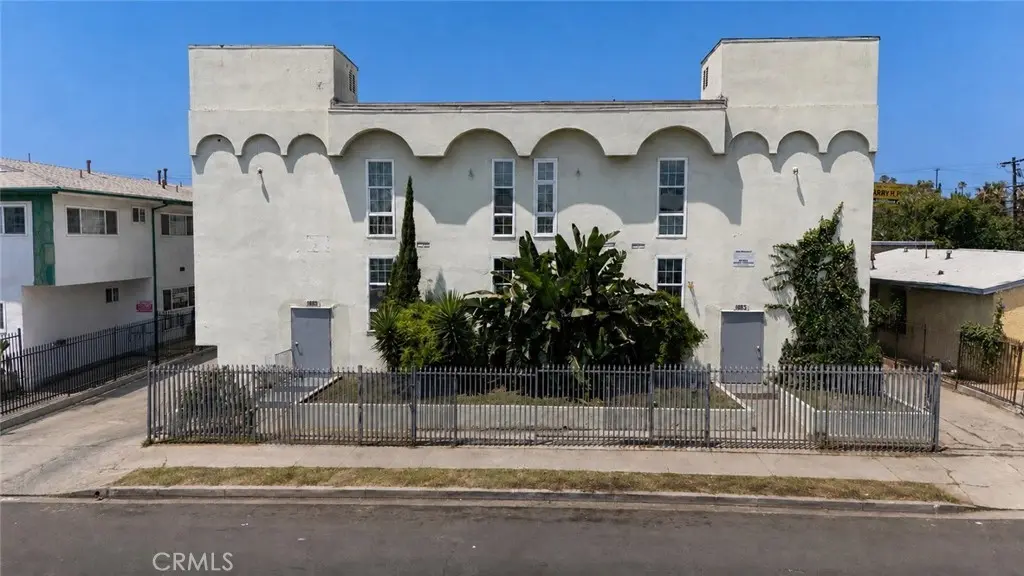
1683 S Longwood · Los Angeles, CA
Flood risk 9/10 · Severe
- FEMA flood zone
- AO
- Chance of flooding over 30 yrs
- 0.99%
- Est. flood insurance / yr
- $848 – $2,087
Fire risk 1/10 · Minimal
- Est. fire insurance / yr
- $659 – $1,223
Heat risk 6/10 · Moderate
- Hot days now (above 89°F)
- 7 days/yr
- Hot days in 30 yrs
- 22 days/yr
Wind risk 1/10 · Minimal
- Chance of severe wind over 30 yrs
- —
Air-quality risk 5/10 · Moderate
- Unhealthy air days now
- 7 days/yr
- Unhealthy air days in 30 yrs
- 7 days/yr
Risk factors via First Street. Map © Google.
Why this score? — see what drove the B- grade
The composite is a weighted blend of 9 inputs, each scored 0–100. Each bar is that input's sub-score; the figure is the points it added to the 100-point composite (weight × sub-score).
- Cash flow +29.7/30.0
- DSCR +10.0/10.0
- 1% rule +8.3/10.0
- ARV discount +7.5/15.0
- Schools +3.6/10.0
- Livability +3.4/5.0
- Condition / age +2.5/5.0
- Rent growth +2.4/5.0
- Appreciation +0.0/10.0
$2,750,000
🖨 Deal sheet 📄 Offer letter ✓ Due diligence
Multi-family units
County records classify this as Multi-Family (5+ Unit). Listing-text estimate: 14 units. confirmed
5+ unit building — per-unit beds/baths from public records are typically unavailable; the breakdown below (if shown) is an estimate from the listing text.
Listing remarks
Longwood Terrace Apartments is a 14-unit multifamily property located at 1683 S. Longwood Avenue in the Mid-City / Mid-Wilshire adjacent area of Los Angeles. Originally constructed in approximately 1964, the property consists of approximately thirteen two-bedroom / one-bath units and one one-bedroom / one-bath unit, offering a functional unit mix within a centrally located Los Angeles rental market. The property contains approximately 10,501 square feet of building area situated on an approximately 11,325 square foot LARD 1.5-zoned lot. Longwood Terrace Apartments features approximately 27 parking spaces, providing a notable parking ratio for a property of this size within a dense urban set
Key facts
- Lard 1.5 zoned lot
- Laundry facility
- 27 parking spaces
Tags
Property features AI
Finance
- Other: Actual monthly rent example: 1‑bed unit $1,400; 2‑bed units reported actual rent $1,660 (note: totals listed for 2‑bed units reflect combined rents)
- Financial info: Total building area 10,501; Total of 14 units; Gross scheduled income $277,584; Gross income $277,584; Net operating income $162,091; Operating expenses $107,165; Gross multiplier 9.91; Rent controlled
- HOA & community: Community apartment ownership
Exterior
- Parking: Gated parking; Total of 27 parking spaces
- Security: Gated parking access
- Utilities: Public sewer; District/public water; Separate gas meters for 14 units; Separate electric meters for 14 units
- Home design: Attached apartment community; Three stories
- Construction: One building
- Exterior features: No pool; Urban community setting; Lot between 10,000 and 19,999 sq ft
Interior
- Bedrooms: One 1‑bed unit; Thirteen 2‑bed units
- Bathrooms: One bathroom in 1‑bed units; One bathroom in 2‑bed units
- Interior features: Three or more levels; Entry on level 1
- Laundry & utility: On‑site laundry area
Neighborhood map
What this means for you Summary
Snapshot
- This is a 13×2bd/1ba + 1×1bd/1ba units multifamily listed at $2.75M.
Deal economics
- At list price, monthly cash flow is $10k ($118k/yr) — positive. Per door: $703/mo.
- The deal already cash-flows at list — no discount required.
- Meets the 1% rule at list price ($37k rent vs $2.75M).
- Recommended offer: $2.71M (1.5% below list) — sets the bar for market timing.
- Cap rate 10.6% vs local median 2.1% in Los Angeles — top-decile yield for the area; either an underpriced asset or a hidden risk that comps aren't pricing in. Stress-test before assuming the spread holds.
Location & tenants
- Location reads 68/100 on livability (#273 in CA) — a middle-class / working-renter tenant base. Strengths: amenities A+, commute A+, employment B; Watch: health & safety C-, schools D+, crime F.
- Los Angeles Unified (urban): math 29% / reading 54% proficiency, ranked #223 of 517 in CA (top 43%) — families likely to look elsewhere, expect single-tenant / working-renter base with shorter leases; 67% free/reduced lunch — lower-income household profile, screen leases tightly.
- Market conditions: Rents soft (-0.5%/yr); 204 active listings in the ZIP; 19,697 units permitted in Los Angeles County in 2024 (9,426 in 5+ unit buildings).
- At $36,676/mo this rent would consume 595% of the median local household income ($74k/yr) (locally 5272% of renters already pay >50% of income on rent) — very limited rent-growth headroom before tenants either downsize or default.
Forward outlook
- Local home prices are declining (-3.0%/yr); year-one equity from $19k of loan paydown is wiped out by about $82k of value loss. Plan a longer hold.
- Los Angeles County population projected at +9% by 2050 — modest demand growth; plan on rents tracking national, not racing it.
Negotiation context
- It's been on market 22 days — a 2% lower offer ($2.71M) is reasonable based on typical stale-listing flexibility.
- Current owner paid $65k; list at $2.75M implies a 4131% gain — meaningful room to come down on a strong offer.
Risks & watch-outs
- Watch-outs: flood insurance adds $122/mo.
- Climate carrying-cost: in FEMA flood zone AO (mandatory federal flood insurance); extreme-heat days projected 7→22/yr by 2055 (HVAC capex compounding) — expect insurance premiums to compound above CPI over the hold.
Questions for the listing agent
- Can we see the unit-by-unit rent roll, current vacancy, and any below-market leases? What's the average tenancy length?
- What capital expenditures (roof, boiler, parking lot, exteriors) have been made in the last 5 years, and what's planned in the next 2?
- Built in 1964 — when were the roof, HVAC, electrical panel, plumbing, and water heater last replaced?
- What's the actual annual flood-insurance premium (NFIP or private), and is the property in a SFHA with mandatory coverage?
- Is there a deadline driving the sale (1031 exchange, divorce, estate, relocation)? That informs how much negotiation room exists.
- Schools are D-rated, which usually means shorter tenancies and higher turnover. Who's the typical renter profile here, and what's been the actual vacancy rate?
- Crime grade is F in this area — have there been break-ins, vandalism, or insurance claims at this property in the last 3 years? What carrier currently insures it and at what premium?
- What's the average days-on-market for RENTAL listings here right now (not sales)? A rising rental-DOM trend means longer vacancies and softer asking-rent achievability than the comps imply.
- What's the recent tenant-quality profile in this submarket — average credit score on applications, eviction rate, late-payment / NSF rate, and stable-employment percentage? A property-management company in the area should have these aggregated.
- How much new apartment / multifamily construction is in the pipeline within 1–3 miles? Heavy new supply (>2% of stock underway) typically softens rents 12–24 months out; light construction supports rent growth.
Investment metrics
- 1% rule
- 1.33% ✓
- Cap rate
- 10.64%
- Cash-on-cash
- 15.54%
- DSCR
- 1.69
- GRM
- 6.2
CMA / ARV
No comps found within radius.
Projected returns pro-forma
-3.0% appreciation · 0.0% rent growth · sell at horizon
- IRR
- 2.6%
- Equity multiple
- 1.10×
- Total profit
- $74,696
- Equity at exit
- $410,034
- IRR
- 9.0%
- Equity multiple
- 1.60×
- Total profit
- $459,797
- Equity at exit
- $237,770
Cash invested: $770,000 (down + closing). Projections, not guarantees.
Landlord ↔ Tenant lean methodology
- Overall (CITY)
- 0 Strongly Tenant-Friendly
- State California
- 18 Strongly Tenant-Friendly · D+13
- County
- — inherits STATE
- City Los Angeles
- 0 Strongly Tenant-Friendly · D+22
ZIP-level market 90019
- Rents YoY
- -0.5%
- Active inventory
- 204
- Price-to-rent
- 87.0×
Monthly cashflow live
- Estimated rent
- $36,676 high interval (Pro) →
- Mortgage (P&I)
- −$14,421
- Tax est. 1.5%
- −$3,438 /mo · $41,250/yr
- Insurance
- −$1,146
- Flood insurance flood zone
- −$122 /mo · $1,468/yr
- HOA
- −$0
- Vacancy / Maint / Mgmt
- −$7,702
- Net cashflow
- $9,847
Break-even live
14-unit breakdown (identical units grouped — click to expand)
| Units | Beds | Baths | Est. rent |
|---|---|---|---|
| 13× units | 2 | 1 | $34,242 |
| #1 | 2 | 1 | $2,634 |
| #2 | 2 | 1 | $2,634 |
| #3 | 2 | 1 | $2,634 |
| #4 | 2 | 1 | $2,634 |
| #5 | 2 | 1 | $2,634 |
| #6 | 2 | 1 | $2,634 |
| #7 | 2 | 1 | $2,634 |
| #8 | 2 | 1 | $2,634 |
| #9 | 2 | 1 | $2,634 |
| #10 | 2 | 1 | $2,634 |
| #11 | 2 | 1 | $2,634 |
| #12 | 2 | 1 | $2,634 |
| #13 | 2 | 1 | $2,634 |
| 1× unit | 1 | 1 | $2,438 |
| Total (14 units) | $36,676 | ||
UW: 25.0% down · 7.5% · 30yr · 1.5% tax · 5.0% vac · 8.0% maint · 8.0% mgmt
Financing live
Cash to close
- Down payment
- $687,500
- Closing costs
- $82,500
- Reserves months
- —
- Total cash needed
- —
Loan-product check · same deal, 3 products live
Conventional
25% down · 7.5% · 30yr
- Down + closing
- —
- Monthly P&I
- —
- Monthly cashflow
- —
- DSCR
- —
- Eligible?
- —
Personal DTI + credit; lowest rate.
DSCR
20% down · 8.5% · 30yr
- Down + closing
- —
- Monthly P&I
- —
- Monthly cashflow
- —
- DSCR
- —
- Eligible?
- —
No personal income docs; deal must DSCR.
Hard money
10% down · 12.0% · 12mo
- Down + closing
- —
- Monthly P&I
- —
- Monthly cashflow
- —
- DSCR
- —
- Eligible?
- —
Short-term bridge; refi at stabilization.
Listing history 15 events
-
2026-06-18days on market $2,750,000 Active 22 DOM
-
2026-06-17days on market $2,750,000 Active 21 DOM
-
2026-06-16days on market $2,750,000 Active 20 DOM
-
2026-06-15days on market $2,750,000 Active 19 DOM
-
2026-06-13days on market $2,750,000 Active 17 DOM
-
2026-06-09days on market $2,750,000 Active 13 DOM
-
2026-06-08days on market $2,750,000 Active 12 DOM
-
2026-06-07days on market $2,750,000 Active 11 DOM
-
2026-06-04days on market $2,750,000 Active 8 DOM
-
2026-06-03days on market $2,750,000 Active 7 DOM
-
2026-06-02days on market $2,750,000 Active 6 DOM
-
2026-06-01days on market $2,750,000 Active 5 DOM
-
2026-05-31days on market $2,750,000 Active 4 DOM
-
2026-05-27$2,750,000 Active
-
1974-11-29soldstatus $65,000
ⓘ Source: listings_history table (triggers on properties + properties_extension) + one-shot
backfill from property_details.listing_events for pre-trigger history.
Climate risk First Street
- Flood 9/10 Extreme FEMA zone AO · 99% chance over 30 yrs
- Wildfire 1/10 Low
- Heat 6/10 Major 7 d/yr ≥89°F today · 22 d/yr by 30 yrs out
- Wind 1/10 Low
- Air quality 5/10 Major 7 unhealthy d/yr today · 7 by 30 yrs out
Nearby sold comps map
Loading sold comps map…
Walkable amenities ~0.75 mi
Loading nearby amenities…
Taxation est. · year 1
- Rental income
- $440,112
- − Mortgage interest
- −$154,043
- − Property taxes
- −$41,250
- − Insurance
- −$15,218
- − Repairs & maintenance
- −$35,209
- − Management
- −$35,209
- − Depreciation
- −$80,000
- Taxable income
- $79,184
- Est. tax owed @ 24.0%
- −$19,004
- After-tax cash flow
- $99,161/yr
For passive investors: Depreciation is non-cash, so a rental often shows a tax loss while cash-flowing — sheltering income. Rental losses are passive: they offset passive income freely, and up to $25,000/yr can offset ordinary (W-2) income if you actively participate and your MAGI is under $100k (phasing out to $0 by $150k); unused losses carry forward. On sale, claimed depreciation is recaptured at up to 25%, and gains may owe capital-gains tax (a 1031 exchange can defer both). Figures are a year-1 estimate at your 24.0% rate — not tax advice; consult a CPA.
Schools (NCES district)
- District
- Los Angeles Unified
- NCES district ID
- 0622710
- Math proficiency
- 29% ▼ -4.00%
- Reading proficiency
- 54% ▲ 10.00%
- Median HH income
- $50,403
- Composite
- 35.67/100
- National rank
- #4875
- State rank
- #223 of 517 in CA
Livability — Los Angeles
- Score
- 68/100
- State rank
- #273
- US rank
- #9237
Category grades
Schools grade is shown separately in the Schools card above.
Census & demographics
- Census place
- Los Angeles, CA
- County
- Los Angeles County · 9,444,647 people
- City population
- 3,838,149
- Metro
- Los Angeles-Long Beach-Anaheim, CA
- Population (ZIP)
- 59,548
- Household income
- $73,934
- Rent vs Own
- Severe rent burden
- 5272.0
Population outlook (Los Angeles County) Hauer SSP2
- Today (2025)
- 10,940,515 people
- By 2030
- 11,256,481 · +2.9%
- By 2040
- 11,729,929 · +7.2%
- By 2050
- 11,948,407 · +9.2%
- By 2075
- 11,818,114 · +8.0%
- By 2100
- 10,842,928 · -0.9%
Race, ethnicity, and origin ACS 2023
- Neighborhood character
- Highly diverse neighborhood (Simpson 0.73)
- Race & ethnicity
- Hispanic / Latino 43% White 18% Black 17% Asian 17% Two or more races 13%
- Hispanic origin (detail)
- Mexican 26%
- Common ancestry
- Lithuanian 1% Romanian 1% Italian 1%
- Foreign-born
- 37% · Canada, South Korea, China
- Languages at home
- 45% English-only · Spanish 38% Korean 10% Tagalog/Filipino 1%
Political lean MEDSL · Los Angeles
- 2024 margin
- Solid D (+32.9) · D 64.8% · R 31.9% · Other 3.3%
- 2008→2024 swing
- -7.4pp toward R · 2008: 40.4pp · 2024: 32.9pp
- All cycles
- 2024: D+32.9 2020: D+44.2 2016: D+48.0 2012: D+40.0 2008: D+40.4
Not yet ingested
- Civics
- —
Market trends
- HPI YoY
- ▼ -1477.82%
- Current HPI
- 425.5427
- Rent YoY
- ▼ -0.50%
- Metro
- Los Angeles-Long Beach-Anaheim, CA
- State GDP YoY
- ▲ 3.21%
- F500 in state
- 116
Industry mix (Fortune 500 HQ in CA)
| Industry | F500 HQs | Revenue |
|---|---|---|
| Technology | 27 | $1,492B |
|
||
| Financial Services | 3 | $174B |
|
||
| Retail | 3 | $44B |
|
||
| Insurance | 3 | $26B |
|
||
| Media / Entertainment | 2 | $115B |
|
||
| Pharmaceuticals / Biotech | 2 | $62B |
|
||
Price history
+4130.8% since first listed2 events — show timeline
- 2026-05-27 Listed $2,750,000 CRMLS
- 1974-11-29 Sold (Public Records) $65,000 Public Records
Property tax history
+1.7%/yrLatest (2025): $3,970 · +3.4% YoY. Source: county tax records.
Cash-flow waterfall
monthlySold comps — $/sqft
last 12 mo · ≤1 miLoading sold comps…