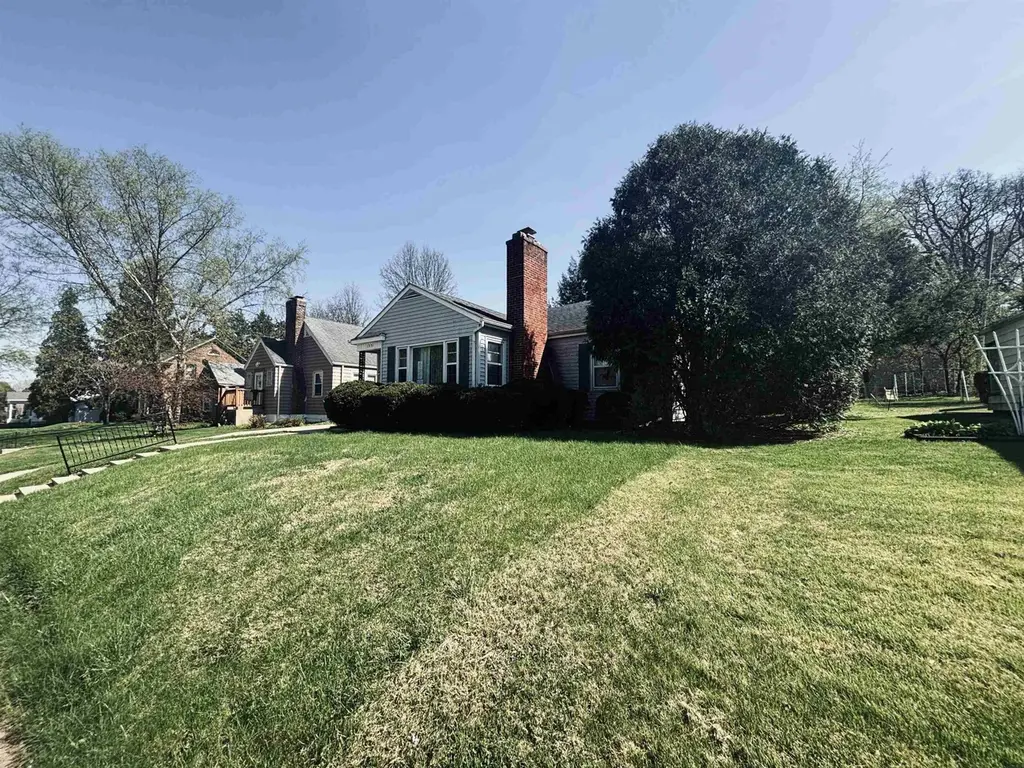
1331 W Logan St · Freeport, IL
Flood risk 1/10 · Minimal
- FEMA flood zone
- X (unshaded)
- Chance of flooding over 30 yrs
- 0.0%
- Est. flood insurance / yr
- $507 – $1,088
Fire risk 1/10 · Minimal
- Est. fire insurance / yr
- $804 – $1,492
Heat risk 2/10 · Minimal
- Hot days now (above 101°F)
- 7 days/yr
- Hot days in 30 yrs
- 15 days/yr
Wind risk 2/10 · Minimal
- Chance of severe wind over 30 yrs
- —
Air-quality risk 2/10 · Minimal
- Unhealthy air days now
- 1 days/yr
- Unhealthy air days in 30 yrs
- 2 days/yr
Risk factors via First Street. Map © Google.
Why this score? — see what drove the B grade
The composite is a weighted blend of 9 inputs, each scored 0–100. Each bar is that input's sub-score; the figure is the points it added to the 100-point composite (weight × sub-score).
- Cash flow +30.0/30.0
- ARV discount +15.0/15.0
- DSCR +10.0/10.0
- 1% rule +9.2/10.0
- Livability +3.6/5.0
- Rent growth +2.5/5.0
- Condition / age +2.5/5.0
- Schools +1.0/10.0
- Appreciation +0.0/10.0
$90,000
🖨 Deal sheet 📄 Offer letter ✓ Due diligence
Listing remarks
Calling all flippers, renovators, and visionaries! This 1,508 sq ft single-family home is priced to move and packed with potential. Located in a quiet neighborhood, this property is a diamond in the rough waiting for the right buyer to bring it back to life. Spacious layout with natural light and solid bones. Whether you're looking to renovate and resell or build long-term equity, this is a rare chance to invest in a property with upside. Bring your contractor, your creativity, and your offer!
Key facts
- 7,405 sq ft lot
- Garage
- Built 1937
Property features AI
Exterior
- Parking: Attached 1-car garage
- Utilities: Public water; Public sewer
- Home design: Single-family residence (house)
- Exterior features: Shingle roof; 0.17-acre lot
Interior
- Kitchen: Gas cooktop; Microwave
- Bathrooms: Two full bathrooms (both on the main level)
- Heating & cooling: Forced air heating; Natural gas
- Interior features: Wood-burning fireplace; Gas water heater
Neighborhood map
What this means for you Summary
Snapshot
- This is a 3-bed/2.0-bath single-family listed at $90k.
Deal economics
- At list price, monthly cash flow is $408 ($5k/yr) — positive.
- The deal already cash-flows at list — no discount required.
- Meets the 1% rule at list price ($1k rent vs $90k).
- Recommended offer: $87k (3.0% below list) — sets the bar for market timing.
- Cap rate 11.7% vs local median 5.8% in Freeport — top-decile yield for the area; either an underpriced asset or a hidden risk that comps aren't pricing in. Stress-test before assuming the spread holds.
Location & tenants
- Location reads 72/100 on livability (#302 in IL) — a middle-class / working-renter tenant base. Strengths: cost of living A+, health & safety A+, housing A-; Watch: commute F, employment F.
- Freeport SD 145 (town): math 11% / reading 12% proficiency, ranked #565 of 620 in IL (top 91%) — low school quality limits family demand, transient renter base, plan for 1-2y turnover; 65% free/reduced lunch — lower-income household profile, screen leases tightly.
- Zoned schools: Empire Elem School (math 12% / reading 12%, grade F, #1,403 of 2,056 statewide, top 71%, 325 students, 0% FRL); Freeport High School (math 11% / reading 18%, grade F, #479 of 693 statewide, top 71%, 1,080 students, 0% FRL) — zoned schools average 0% FRL vs 65% district-wide (65 pts lower); this property's tenant base skews higher-income than the district average.
- Market conditions: 197 active listings in the ZIP; 5 comparable units currently listed for rent nearby; rentals lingering (median 44d on market — plan ~5-8 weeks vacancy on turnover, expect pricing pressure); 100% of comp listings sitting > 30 days — soft ceiling on asking rent; 7 units permitted in Stephenson County in 2024 (0 in 5+ unit buildings).
Forward outlook
- Local home prices are declining (-3.0%/yr); year-one equity from $622 of loan paydown is wiped out by about $3k of value loss. Plan a longer hold.
- Stephenson County population projected at -29% by 2050 — secular population decline; favor cash flow + early exit over multi-decade hold.
- At projected returns (-3.0% appreciation + 3.0% rent growth), your $25k cash investment doubles in ~7 years — after that, you're playing with house money.
Negotiation context
- It's been on market 36 days — a 3% lower offer ($87k) is reasonable based on typical stale-listing flexibility.
- Current owner paid $50k; list at $90k implies a 80% gain — meaningful room to come down on a strong offer.
Risks & watch-outs
- Watch-outs: built in 1937 — expect roof / HVAC / electrical / plumbing capex.
Questions for the listing agent
- It's been on market 36 days. Have you received any prior offers? Is the seller open to a 3% concession, seller financing, or rate buy-down credit?
- Built in 1937 — when were the roof, HVAC, electrical panel, plumbing, and water heater last replaced?
- Is there a deadline driving the sale (1031 exchange, divorce, estate, relocation)? That informs how much negotiation room exists.
- Schools are F-rated, which usually means shorter tenancies and higher turnover. Who's the typical renter profile here, and what's been the actual vacancy rate?
- What's the average days-on-market for RENTAL listings here right now (not sales)? A rising rental-DOM trend means longer vacancies and softer asking-rent achievability than the comps imply.
- What's the recent tenant-quality profile in this submarket — average credit score on applications, eviction rate, late-payment / NSF rate, and stable-employment percentage? A property-management company in the area should have these aggregated.
- How much new for-sale + rental construction is in the pipeline within 1–3 miles? Heavy new supply typically softens prices + rents 12–24 months out; constrained supply supports both.
Investment metrics
- 1% rule
- 1.42% ✓
- Cap rate
- 11.73%
- Cash-on-cash
- 19.42%
- DSCR
- 1.86
- GRM
- 5.9
CMA / ARV
- ARV (median comp)
- $120,011
- List price
- $90,000
- Delta
- -25.01%
- Verdict
- UNDERPRICED
- Comps
- 20 within 1.0 mi
Show comp detail 12 sales within ~0.75 mi
| Address | Dist | Beds/Ba | Sqft | Sold | Price | $/sf | Match |
|---|---|---|---|---|---|---|---|
| 1250 W American St | 0.16mi | 3/1.5 | 1,500 (-0%) | 2mo | $87,500 | $58 | 88 |
| 1529 W Logan St | 0.17mi | 2/1.0 (-1) | 1,528 (+1%) | 3mo | $125,000 | $82 | 79 |
| 52 N Bailey Ave | 0.36mi | 3/1.5 | 1,600 (+6%) | 1mo | $141,400 | $88 | 71 |
| 1221 W Lincoln Blvd | 0.27mi | 3/1.5 | 1,338 (-11%) | 1mo | $150,000 | $112 | 66 |
| 45 N Sunset Ave | 0.37mi | 2/2.0 (-1) | 1,442 (-4%) | 7mo | $135,000 | $94 | 65 |
| 1225 W Lincoln Blvd | 0.27mi | 3/1.0 | 1,634 (+8%) | 8mo | $95,000 | $58 | 63 |
| 1245 W Violet St | 0.27mi | 4/2.0 (+1) | 1,680 (+11%) | 2mo | $96,000 | $57 | 62 |
| 1244 Lacresta Dr | 0.55mi | 3/2.0 | 1,404 (-7%) | 2mo | $150,000 | $107 | 61 |
| 826 W Chestnut St | 0.68mi | 3/1.5 | 1,526 (+1%) | 5mo | $51,500 | $34 | 60 |
| 1460 Bolkinwood Dr | 0.46mi | 3/1.5 | 1,384 (-8%) | 6mo | $142,670 | $103 | 58 |
| 1133 W Staver St | 0.62mi | 2/1.5 (-1) | 1,408 (-7%) | 0mo | $150,000 | $107 | 53 |
| 816 W Pleasant St | 0.72mi | 3/1.5 | 1,376 (-9%) | 1mo | $149,900 | $109 | 49 |
Match score weights: distance 35% · size 25% · config 20% · recency 20%. Top-matched comps best support the ARV.
Projected returns pro-forma
-3.0% appreciation · 3.0% rent growth · sell at horizon
- IRR
- 11.4%
- Equity multiple
- 1.45×
- Total profit
- $11,396
- Equity at exit
- $13,419
- IRR
- 20.4%
- Equity multiple
- 2.72×
- Total profit
- $43,393
- Equity at exit
- $7,782
Cash invested: $25,200 (down + closing). Projections, not guarantees.
Landlord ↔ Tenant lean methodology
- Overall (STATE)
- 43 Moderately Tenant-Leaning
- State Illinois
- 43 Moderately Tenant-Leaning · D+7
- County
- — inherits STATE
- City
- — inherits STATE
ZIP-level market 61032
- Home prices YoY
- -19.5%
- Active inventory
- 197
- Price-to-rent
- 5.9×
Monthly cashflow live
- Estimated rent
- $1,276 high interval (Pro) →
- Mortgage (P&I)
- −$472
- Tax from tax record
- −$91 /mo · $1,089/yr
- Insurance
- −$38
- HOA
- −$0
- Vacancy / Maint / Mgmt
- −$268
- Net cashflow
- $408
Break-even live
UW: 25.0% down · 7.5% · 30yr · 1.5% tax · 5.0% vac · 8.0% maint · 8.0% mgmt
Financing live
Cash to close
- Down payment
- $22,500
- Closing costs
- $2,700
- Reserves months
- —
- Total cash needed
- —
Loan-product check · same deal, 3 products live
Conventional
25% down · 7.5% · 30yr
- Down + closing
- —
- Monthly P&I
- —
- Monthly cashflow
- —
- DSCR
- —
- Eligible?
- —
Personal DTI + credit; lowest rate.
DSCR
20% down · 8.5% · 30yr
- Down + closing
- —
- Monthly P&I
- —
- Monthly cashflow
- —
- DSCR
- —
- Eligible?
- —
No personal income docs; deal must DSCR.
Hard money
10% down · 12.0% · 12mo
- Down + closing
- —
- Monthly P&I
- —
- Monthly cashflow
- —
- DSCR
- —
- Eligible?
- —
Short-term bridge; refi at stabilization.
Rent comps 5 comps
| Address | Beds | Baths | Sqft | Rent | $/sqft | DOM | Units | Dist |
|---|---|---|---|---|---|---|---|---|
| 837 W Stephenson St Freeport, IL | 2.0 | 1.0 | 1330 | $1,000 | $0.75 | 43d | 1 | 0.73mi |
| 742 W Homer St Freeport, IL | 3.0 | 1.0 | 1434 | $1,325 | $0.92 | 43d | 1 | 0.80mi |
| 435 N Apple Ave Freeport, IL | 4.0 | 2.0 | 1500 | $1,450 | $0.97 | 43d | 1 | 1.17mi |
| 320 W Clark St Freeport, IL | 4.0 | 1.0 | 1509 | $1,395 | $0.92 | 43d | 1 | 1.19mi |
| 816 S James Ave Freeport, IL | 3.0 | 1.0 | 1152 | $1,325 | $1.15 | 43d | 1 | 1.33mi |
Listing history 8 events
-
2026-06-17statusdays on market $90,000 Pending 36 DOM
-
2026-06-04days on market $90,000 Active 35 DOM
-
2026-06-02days on market $90,000 Active 34 DOM
-
2026-06-01days on market $90,000 Active 33 DOM
-
2026-05-31days on market $90,000 Active 32 DOM
-
2026-05-31days on market $90,000 Active 31 DOM
-
2026-04-29$90,000 Active 498-char remark
-
2013-05-06soldstatus $50,000
ⓘ Source: listings_history table (triggers on properties + properties_extension) + one-shot
backfill from property_details.listing_events for pre-trigger history.
Tax reassessment forecast IL · Partial reset (capped growth)
- Current annual tax
- $1,089 · $91/mo
- Projected year-2 tax
- $1,566 · $131/mo
- Expected delta
- +$477/yr (+$40/mo · 43.8%)
ⓘ Screening estimate from a state-policy table — verify with the county assessor before closing.
Climate risk First Street
- Flood 1/10 Low FEMA zone X (unshaded) · 0% chance over 30 yrs
- Wildfire 1/10 Low
- Heat 2/10 Low 7 d/yr ≥101°F today · 15 d/yr by 30 yrs out
- Wind 2/10 Low
- Air quality 2/10 Low 1 unhealthy d/yr today · 2 by 30 yrs out
Nearby sold comps map
Loading sold comps map…
Walkable amenities ~0.75 mi
Loading nearby amenities…
Taxation est. · year 1
- Rental income
- $15,312
- − Mortgage interest
- −$5,041
- − Property taxes
- −$1,089
- − Insurance
- −$450
- − Repairs & maintenance
- −$1,225
- − Management
- −$1,225
- − Depreciation
- −$2,618
- Taxable income
- $3,663
- Est. tax owed @ 24.0%
- −$879
- After-tax cash flow
- $4,015/yr
For passive investors: Depreciation is non-cash, so a rental often shows a tax loss while cash-flowing — sheltering income. Rental losses are passive: they offset passive income freely, and up to $25,000/yr can offset ordinary (W-2) income if you actively participate and your MAGI is under $100k (phasing out to $0 by $150k); unused losses carry forward. On sale, claimed depreciation is recaptured at up to 25%, and gains may owe capital-gains tax (a 1031 exchange can defer both). Figures are a year-1 estimate at your 24.0% rate — not tax advice; consult a CPA.
Schools (NCES district)
- District
- Freeport SD 145
- NCES district ID
- 1715900
- Math proficiency
- 11% ▼ -3.00%
- Reading proficiency
- 12% ▼ -5.00%
- Median HH income
- $39,803
- Composite
- 9.89/100
- National rank
- #9821
- State rank
- #565 of 620 in IL
Livability — Freeport
- Score
- 72/100
- State rank
- #302
- US rank
- #5927
Category grades
Schools grade is shown separately in the Schools card above.
Census & demographics
- Census place
- Freeport, IL
- Population (ZIP)
- 29,072
Population outlook (Stephenson County) Hauer SSP2
- Today (2025)
- 41,802 people
- By 2030
- 39,487 · -5.5%
- By 2040
- 34,534 · -17.4%
- By 2050
- 29,693 · -29.0%
- By 2075
- 21,196 · -49.3%
- By 2100
- 14,596 · -65.1%
Race, ethnicity, and origin ACS 2023
- Neighborhood character
- Predominantly White (73%)
- Race & ethnicity
- White 73% Black 12% Two or more races 10% Hispanic / Latino 6% Asian 1%
- Hispanic origin (detail)
- Mexican 4% Puerto Rican 1%
- Common ancestry
- Iranian 3% Romanian 2% Lithuanian 2%
- Foreign-born
- 3% · Canada
- Languages at home
- 96% English-only · Spanish 3% Other Indo-European 1%
Political lean MEDSL · Stephenson
- 2024 margin
- R (+19.4) · D 39.5% · R 58.9% · Other 1.6%
- 2008→2024 swing
- -26.1pp toward R · 2008: 6.7pp · 2024: -19.4pp
- All cycles
- 2024: R+19.4 2020: R+15.7 2016: R+17.0 2012: R+4.6 2008: D+6.7
Not yet ingested
- Civics
- —
Market trends
- HPI YoY
- ▼ -39.75%
- Current HPI
- 163.677
- Rent YoY
- —
- Metro
- —
- State GDP YoY
- ▲ 1.59%
- F500 in state
- 60
Industry mix (Fortune 500 HQ in IL)
| Industry | F500 HQs | Revenue |
|---|---|---|
| Insurance | 4 | $201B |
|
||
| Consumer Goods | 4 | $87B |
|
||
| Industrial Machinery | 3 | $64B |
|
||
| Healthcare | 2 | $55B |
|
||
| Retail / Pharmacy | 1 | $148B |
|
||
| Agriculture / Food | 1 | $86B |
|
||
Price history
+80.0% since first listed4 events — show timeline
- 2026-06-16 Pending — NWIAR
- 2026-06-04 Delisted — NWIAR
- 2026-04-29 Listed $90,000 NWIAR
- 2013-05-06 Sold (Public Records) $50,000 Public Records
Property tax history
-2.4%/yrLatest (2024): $1,089 · -4.6% YoY. Source: county tax records.
Cash-flow waterfall
monthlySold comps — $/sqft
last 12 mo · ≤1 miLoading sold comps…