 🏗️ New Construction
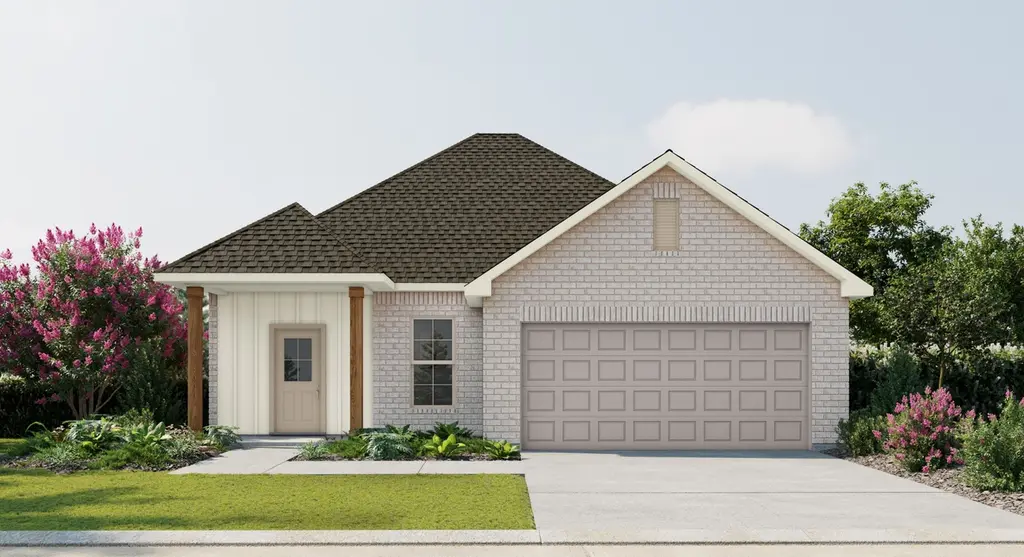
Biltmore II G Plan · Duson, LA
Flood risk No data
- FEMA flood zone
- —
- Chance of flooding over 30 yrs
- —
- Est. flood insurance / yr
- —
Fire risk No data
- Est. fire insurance / yr
- —
Heat risk No data
- Hot days now (above threshold)
- —
- Hot days in 30 yrs
- —
Wind risk No data
- Chance of severe wind over 30 yrs
- —
Air-quality risk No data
- Unhealthy air days now
- —
- Unhealthy air days in 30 yrs
- —
Risk factors via First Street. Map © Google.
Why this score? — see what drove the D grade
The composite is a weighted blend of 9 inputs, each scored 0–100. Each bar is that input's sub-score; the figure is the points it added to the 100-point composite (weight × sub-score).
- Cash flow +14.1/30.0
- ARV discount +7.5/15.0
- DSCR +4.3/10.0
- 1% rule +3.9/10.0
- Schools +3.6/10.0
- Livability +3.3/5.0
- Rent growth +2.5/5.0
- Condition / age +2.2/5.0
- Appreciation +0.0/10.0
$214,990
🖨 Deal sheet 📄 Offer letter ✓ Due diligence
Listing remarks MLS
The Biltmore II G Floor Plan by DSLD Homes is a beautifully designed new construction home offering 4 bedrooms, 2 bathrooms, and 1,465 square feet of well-utilized space. Perfect for first-time buyers or growing families, this energy-efficient layout delivers exceptional value and comfort in a thoughtfully compact design. The exterior features a timeless combination of brick and siding, along with a covered rear porch and a two-car garage-providing both curb appeal and everyday functionality. Inside, the open-concept layout is centered around a bright kitchen enhanced by recessed can lighting, creating a welcoming space for cooking, dining, and entertaining. The primary suite is a private retreat, featuring a relaxing garden tub, separate walk-in shower, and a spacious walk-in closet for added storage and convenience. Built with quality materials and attention to detail, the Biltmore II G is part of DSLD Homes' commitment to affordable, energy-efficient living in beautiful, family-friendly communities.
Key facts
- Brick exterior
- Siding exterior
- 2 garage spots
Tags
Neighborhood map
What this means for you Summary
Snapshot
- This is a 4-bed/2.0-bath single-family listed at $215k. Condition is rated fair.
Deal economics
- At list price, monthly cash flow is $30 ($358/yr) — positive.
- The deal already cash-flows at list — no discount required.
- To meet the 1% rule (rent ≥ 1% of price), the offer needs to be $190k (11.6% below list).
- Recommended offer: $189k (12.0% below list) — sets the bar for market timing.
Location & tenants
- Location reads 66/100 on livability (#134 in LA) — a middle-class / working-renter tenant base. Strengths: cost of living A+, housing A+, health & safety B+; Watch: amenities F, commute F, employment F.
- Lafayette Parish (urban): math 38% / reading 46% proficiency, ranked #19 of 98 in LA (top 19%) — families likely to look elsewhere, expect single-tenant / working-renter base with shorter leases.
- Market conditions: 196 active listings in the ZIP; 1 comparable units currently listed for rent nearby; 1,585 units permitted in Lafayette Parish in 2024 (10 in 5+ unit buildings).
Forward outlook
- Local home prices are declining (-3.0%/yr); year-one equity from $1k of loan paydown is wiped out by about $6k of value loss. Plan a longer hold.
- Lafayette County population projected at +34% by 2050 — long-run rental-demand tailwind backs the buy-and-hold thesis.
Negotiation context
- It's been on market 682 days — a 12% lower offer ($189k) is reasonable based on typical stale-listing flexibility.
Questions for the listing agent
- It's been on market 682 days. Have you received any prior offers? Is the seller open to a 12% concession, seller financing, or rate buy-down credit?
- Have any recent inspections been done? Can we get a copy of the seller's disclosures and any deferred-maintenance estimates?
- Why hasn't it sold? Are there any deal-killer items the seller is aware of (foundation, flood, title, zoning, code violations)?
- Is there a deadline driving the sale (1031 exchange, divorce, estate, relocation)? That informs how much negotiation room exists.
- The area grade is low — what's the realistic commute time and amenity access for the typical tenant pool here? Any planned neighborhood developments (good or bad) we should know about?
- What's the average days-on-market for RENTAL listings here right now (not sales)? A rising rental-DOM trend means longer vacancies and softer asking-rent achievability than the comps imply.
- What's the recent tenant-quality profile in this submarket — average credit score on applications, eviction rate, late-payment / NSF rate, and stable-employment percentage? A property-management company in the area should have these aggregated.
- How much new for-sale + rental construction is in the pipeline within 1–3 miles? Heavy new supply typically softens prices + rents 12–24 months out; constrained supply supports both.
Investment metrics
- 1% rule
- 0.89% ✗
- Cap rate
- 6.46%
- Cash-on-cash
- 0.60%
- DSCR
- 1.03
- GRM
- 9.3
CMA / ARV
- ARV (median comp)
- $212,875
- List price
- $214,990
- Delta
- 0.99%
- Verdict
- FAIR
- Comps
- 20 within 1.0 mi
Show comp detail 12 sales within ~0.75 mi
| Address | Dist | Beds/Ba | Sqft | Sold | Price | $/sf | Match |
|---|---|---|---|---|---|---|---|
| 305 Meadow Ridge Ln | 0.11mi | 3/2.0 (-1) | 1,482 (+1%) | 4mo | $217,946 | $147 | 85 |
| 409 Meadow Ridge Ln | 0.14mi | 3/2.0 (-1) | 1,498 (+2%) | 2mo | $221,370 | $148 | 83 |
| 118 Ember Ridge Ln | 0.15mi | 3/2.0 (-1) | 1,422 (-3%) | 2mo | $208,187 | $146 | 81 |
| 401 Meadow Ridge Ln | 0.14mi | 3/2.0 (-1) | 1,498 (+2%) | 4mo | $220,746 | $147 | 81 |
| 113 Ember Ridge Ln | 0.16mi | 3/2.0 (-1) | 1,498 (+2%) | 5mo | $217,910 | $145 | 79 |
| 111 Ember Ridge Ln | 0.14mi | 3/2.0 (-1) | 1,422 (-3%) | 6mo | $208,040 | $146 | 78 |
| 119 Rosebrook Ln | 0.21mi | 3/2.0 (-1) | 1,422 (-3%) | 4mo | $209,339 | $147 | 78 |
| 205 Meadow Ridge Ln | 0.03mi | 3/2.0 (-1) | 1,321 (-10%) | 1mo | $199,880 | $151 | 76 |
| 106 Rosebrook Ln | 0.10mi | 3/2.0 (-1) | 1,578 (+8%) | 5mo | $221,610 | $140 | 73 |
| 303 Ravensdale Ln | 0.20mi | 3/2.0 (-1) | 1,578 (+8%) | 2mo | $223,102 | $141 | 71 |
| 307 Meadow Ridge Ln | 0.13mi | 3/2.0 (-1) | 1,321 (-10%) | 2mo | $199,035 | $151 | 71 |
| 500 4th St | 0.42mi | 3/2.0 (-1) | 1,296 (-12%) | 3mo | $60,000 | $46 | 54 |
Match score weights: distance 35% · size 25% · config 20% · recency 20%. Top-matched comps best support the ARV.
Projected returns pro-forma
-3.0% appreciation · 3.0% rent growth · sell at horizon
- IRR
- -15.3%
- Equity multiple
- 0.45×
- Total profit
- $-32,564
- Equity at exit
- $31,740
- IRR
- -6.8%
- Equity multiple
- 0.57×
- Total profit
- $-25,790
- Equity at exit
- $18,406
Cash invested: $59,605 (down + closing). Projections, not guarantees.
Landlord ↔ Tenant lean methodology
- Overall (STATE)
- 90 Strongly Landlord-Friendly
- State Louisiana
- 90 Strongly Landlord-Friendly · R+12
- County
- — inherits STATE
- City
- — inherits STATE
ZIP-level market 70529
- Home prices YoY
- -11.1%
- Active inventory
- 196
- Price-to-rent
- 9.4×
Monthly cashflow live
- Estimated rent
- $1,900 medium interval (Pro) →
- Mortgage (P&I)
- −$1,116
- Tax est. 1.5%
- −$266 /mo · $3,193/yr
- Insurance
- −$89
- HOA
- −$0
- Vacancy / Maint / Mgmt
- −$399
- Net cashflow
- $30
Break-even live
UW: 25.0% down · 7.5% · 30yr · 1.5% tax · 5.0% vac · 8.0% maint · 8.0% mgmt
Financing live
Cash to close
- Down payment
- $53,219
- Closing costs
- $6,386
- Reserves months
- —
- Total cash needed
- —
Loan-product check · same deal, 3 products live
Conventional
25% down · 7.5% · 30yr
- Down + closing
- —
- Monthly P&I
- —
- Monthly cashflow
- —
- DSCR
- —
- Eligible?
- —
Personal DTI + credit; lowest rate.
DSCR
20% down · 8.5% · 30yr
- Down + closing
- —
- Monthly P&I
- —
- Monthly cashflow
- —
- DSCR
- —
- Eligible?
- —
No personal income docs; deal must DSCR.
Hard money
10% down · 12.0% · 12mo
- Down + closing
- —
- Monthly P&I
- —
- Monthly cashflow
- —
- DSCR
- —
- Eligible?
- —
Short-term bridge; refi at stabilization.
Rent comps 1 comps
| Address | Beds | Baths | Sqft | Rent | $/sqft | DOM | Units | Dist |
|---|---|---|---|---|---|---|---|---|
| 211 Winter Park PL Duson, LA | 2.0–3.0 | 2.0 | 1275 | $1,900 | $1.49 | 13d | 1 | 0.21mi |
Listing history 17 events
-
2026-06-18days on market $214,990 Active 682 DOM
-
2026-06-17days on market $214,990 Active 681 DOM
-
2026-06-16days on market $214,990 Active 680 DOM
-
2026-06-15days on market $214,990 Active 679 DOM
-
2026-06-14days on market $214,990 Active 677 DOM
-
2026-06-13days on market $214,990 Active 676 DOM
-
2026-06-10days on market $214,990 Active 674 DOM
-
2026-06-09days on market $214,990 Active 673 DOM
-
2026-06-08days on market $214,990 Active 672 DOM
-
2026-06-07days on market $214,990 Active 671 DOM
-
2026-06-05days on market $214,990 Active 668 DOM
-
2026-06-03days on market $214,990 Active 667 DOM
-
2026-06-02days on market $214,990 Active 666 DOM
-
2026-06-01days on market $214,990 Active 665 DOM
-
2026-05-31days on market $214,990 Active 664 DOM
-
2026-05-30days on market $214,990 Active 663 DOM
-
2024-08-05$214,990 Active 1017-char remark
Show marketing remark (1017 chars)
The Biltmore II G Floor Plan by DSLD Homes is a beautifully designed new construction home offering 4 bedrooms, 2 bathrooms, and 1,465 square feet of well-utilized space. Perfect for first-time buyers or growing families, this energy-efficient layout delivers exceptional value and comfort in a thoughtfully compact design. The exterior features a timeless combination of brick and siding, along with a covered rear porch and a two-car garage-providing both curb appeal and everyday functionality. Inside, the open-concept layout is centered around a bright kitchen enhanced by recessed can lighting, creating a welcoming space for cooking, dining, and entertaining. The primary suite is a private retreat, featuring a relaxing garden tub, separate walk-in shower, and a spacious walk-in closet for added storage and convenience. Built with quality materials and attention to detail, the Biltmore II G is part of DSLD Homes' commitment to affordable, energy-efficient living in beautiful, family-friendly communities.
ⓘ Source: listings_history table (triggers on properties + properties_extension) + one-shot
backfill from property_details.listing_events for pre-trigger history.
Nearby sold comps map
Loading sold comps map…
Walkable amenities ~0.75 mi
Loading nearby amenities…
Taxation est. · year 1
- Rental income
- $22,800
- − Mortgage interest
- −$11,924
- − Property taxes
- −$3,193
- − Insurance
- −$1,064
- − Repairs & maintenance
- −$1,824
- − Management
- −$1,824
- − Depreciation
- −$6,193
- Taxable loss
- −$3,223
- Est. tax savings @ 24.0%
- +$773
- After-tax cash flow
- $1,132/yr
For passive investors: Depreciation is non-cash, so a rental often shows a tax loss while cash-flowing — sheltering income. Rental losses are passive: they offset passive income freely, and up to $25,000/yr can offset ordinary (W-2) income if you actively participate and your MAGI is under $100k (phasing out to $0 by $150k); unused losses carry forward. On sale, claimed depreciation is recaptured at up to 25%, and gains may owe capital-gains tax (a 1031 exchange can defer both). Figures are a year-1 estimate at your 24.0% rate — not tax advice; consult a CPA.
Condition & rehab AI · 3 photos
This home requires extensive renovations to improve its condition and increase its value. Significant repairs and updates are needed to the exterior, roof, flooring, interior walls, and systems.
Repairs flagged
- Major exterior siding — Significant damage and peeling paint are visible in the independent image.
- Major roof — The listing photo shows visible wear, and the independent image suggests it may need replacement.
- Major flooring — The independent image suggests the flooring may need replacement.
- Major interior walls — The independent image suggests the walls may need repainting.
- Major systems — The independent image suggests the systems may need updating.
Value-add opportunities
- Resale exterior renovation — A fresh exterior will attract more buyers and increase the home's curb appeal.
- Resale interior renovation — Updating the interior will make the home more appealing to potential buyers.
- Resale roof replacement — A new roof will significantly increase the home's value and appeal to buyers.
- Resale flooring replacement — New flooring will enhance the home's appearance and increase its market value.
- Resale painting and updating systems — Fresh paint and updated systems will make the home more attractive to buyers.
Renovation cost estimate screening
| Repair item | Severity | Est. cost |
|---|---|---|
| exterior siding · Significant damage and peeling paint are visible in the independent image. | Major | $15,000–50,000 |
| roof · The listing photo shows visible wear, and the independent image suggests it may need replacement. | Major | $15,000–50,000 |
| flooring · The independent image suggests the flooring may need replacement. | Major | $15,000–50,000 |
| interior walls · The independent image suggests the walls may need repainting. | Major | $15,000–50,000 |
| systems · The independent image suggests the systems may need updating. | Major | $15,000–50,000 |
| Total estimated repair cost · 5 items | $75,000–250,000 |
Value-add ROI direction
- Resale exterior renovation — A fresh exterior will attract more buyers and increase the home's curb appeal. ↑
- Resale interior renovation — Updating the interior will make the home more appealing to potential buyers. ↑
- Resale roof replacement — A new roof will significantly increase the home's value and appeal to buyers. ↑
- Resale flooring replacement — New flooring will enhance the home's appearance and increase its market value. ↑
- Resale painting and updating systems — Fresh paint and updated systems will make the home more attractive to buyers. ↑
ⓘ Cost ranges are severity-bucket heuristics (US national rule-of-thumb). Get contractor quotes + a written scope before underwriting a rehab budget.
Schools (NCES district)
- District
- Lafayette Parish
- NCES district ID
- 2200870
- Math proficiency
- 38% ▼ -32.00%
- Reading proficiency
- 46% ▼ -24.00%
- Median HH income
- $50,238
- Composite
- 36.15/100
- National rank
- #4741
- State rank
- #19 of 98 in LA
Livability — Duson
- Score
- 66/100
- State rank
- #134
- US rank
- #12322
Category grades
Schools grade is shown separately in the Schools card above.
Census & demographics
- Census place
- Duson, LA
- Population (ZIP)
- 13,557
Population outlook (Lafayette County) Hauer SSP2
- Today (2025)
- 280,930 people
- By 2030
- 301,092 · +7.2%
- By 2040
- 339,456 · +20.8%
- By 2050
- 375,156 · +33.5%
- By 2075
- 451,672 · +60.8%
- By 2100
- 497,203 · +77.0%
Race, ethnicity, and origin ACS 2023
- Neighborhood character
- Diverse neighborhood (Simpson 0.55)
- Race & ethnicity
- White 62% Black 25% Hispanic / Latino 6% Two or more races 6%
- Hispanic origin (detail)
- Common ancestry
- Lithuanian 16% English 1% Iranian 1%
- Foreign-born
- 6% · Canada
- Languages at home
- 90% English-only · Spanish 5% French/Haitian/Cajun 4%
Political lean MEDSL · Lafayette
- 2024 margin
- Solid R (+31.4) · D 33.5% · R 64.8% · Other 1.7%
- 2008→2024 swing
- -0.1pp no change · 2008: -31.3pp · 2024: -31.4pp
- All cycles
- 2024: R+31.4 2020: R+28.7 2016: R+33.6 2012: R+33.7 2008: R+31.3
Not yet ingested
- Civics
- —
Market trends
- HPI YoY
- ▼ -23.96%
- Current HPI
- 192.2639
- Rent YoY
- —
- Metro
- —
- State GDP YoY
- ▲ 3.29%
- F500 in state
- 10
Industry mix (Fortune 500 HQ in LA)
| Industry | F500 HQs | Revenue |
|---|---|---|
| Telecommunications | 2 | $23B |
|
||
| Utilities | 1 | $12B |
|
||
| Wholesale / Distribution | 1 | $5B |
|
||
| Advertising | 1 | $2B |
|
||
Price history
1 event — show timeline
- 2024-08-05 Listed $214,990 Zillow
Cash-flow waterfall
monthlySold comps — $/sqft
last 12 mo · ≤1 miLoading sold comps…